Posts Tagged "new reports"
Divided by Design: Quantifying the damage of our transportation program
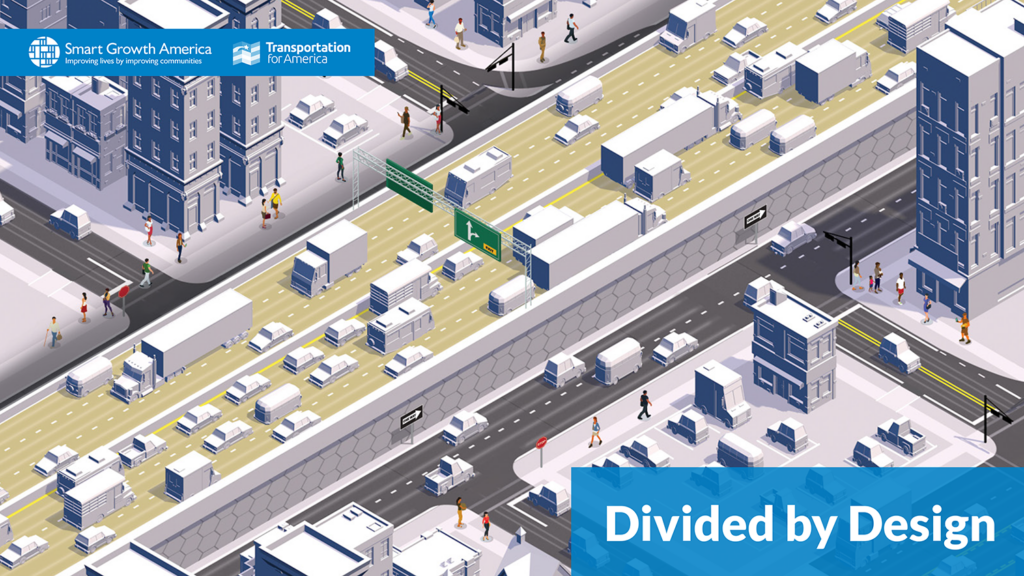
Our new report examines the racist roots of our current transportation system. Most importantly, it demonstrates how today’s policies and practices were shaped by the past, leading to racial disparities today. Without a fundamental change to the overall approach to transportation, today’s leaders and transportation professionals, no matter their intent, will perpetuate and exacerbate the damage.
New Community Connectors grant program and resources for advocates
A new grant program from Smart Growth America will help advance locally driven projects that will reconnect communities separated or harmed by transportation infrastructure and tap available federal and state funds to support them. Removing divisive infrastructure is largely uncharted territory in the United States, but the need to fix the damage it has caused […]
What would a Green New Deal for transportation look like?
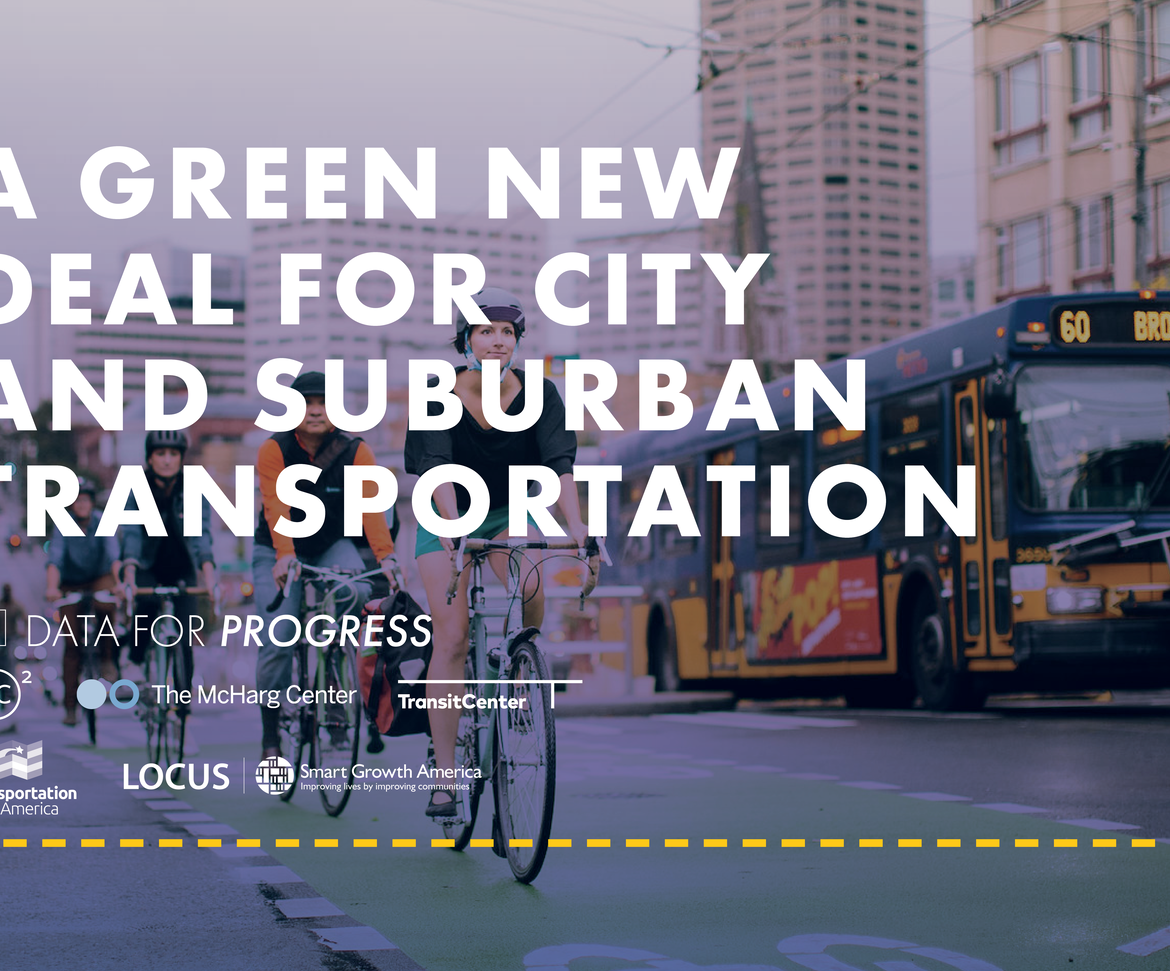
Current federal transportation policy is diametrically opposed to climate action. The Green New Deal framework released a year ago mostly left that unchanged. But a new report T4America contributed to fills in those gaps and gives transportation policy the same visionary makeover to show what we could achieve if our transportation and climate goals were aligned.
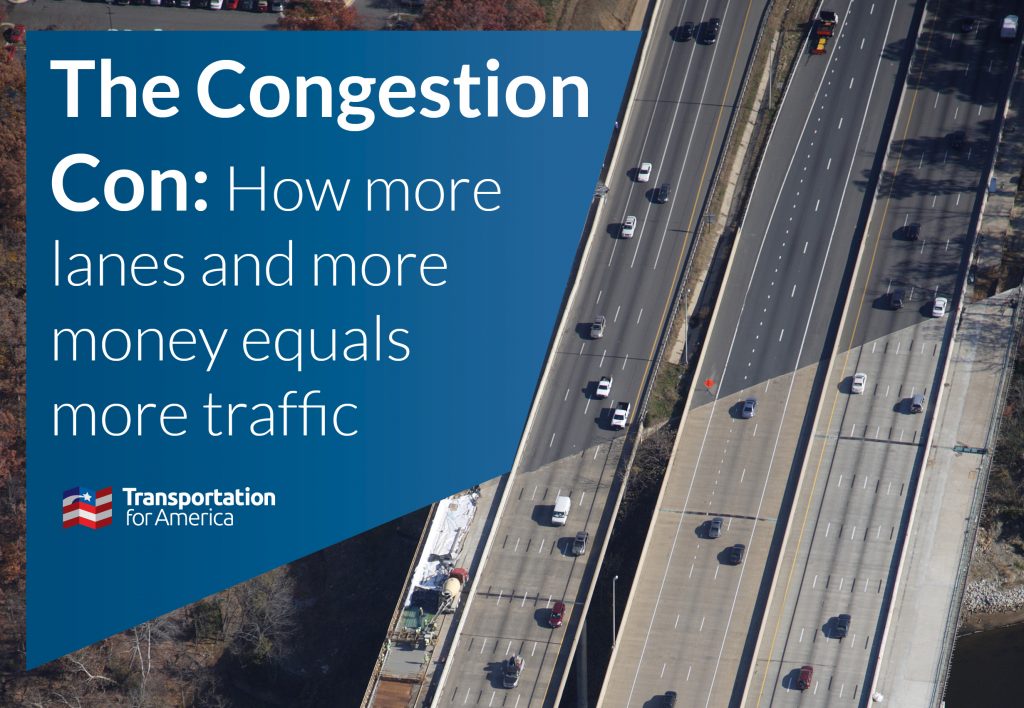
The Congestion Con: You’ve been played
In a new report, The Congestion Con: How more lanes and more money equals more traffic, we show how our approach to curbing congestion with new and wider highways has failed. We have spent decades and hundreds of billions of dollars on highways in the name of beating back congestion, yet in all of the 100 most populous urbanized areas examined in the report, congestion has gotten worse as a result. The Congestion Con lays out a comprehensive look at congestion data, why our “solution” has failed, and what the federal government can do to correct course.
The inside scoop on Repair Priorities 2019
After the release of Repair Priorities 2019, we hosted a webinar in partnership with Taxpayers for Common Sense to talk about the findings and recommendations of our new report.
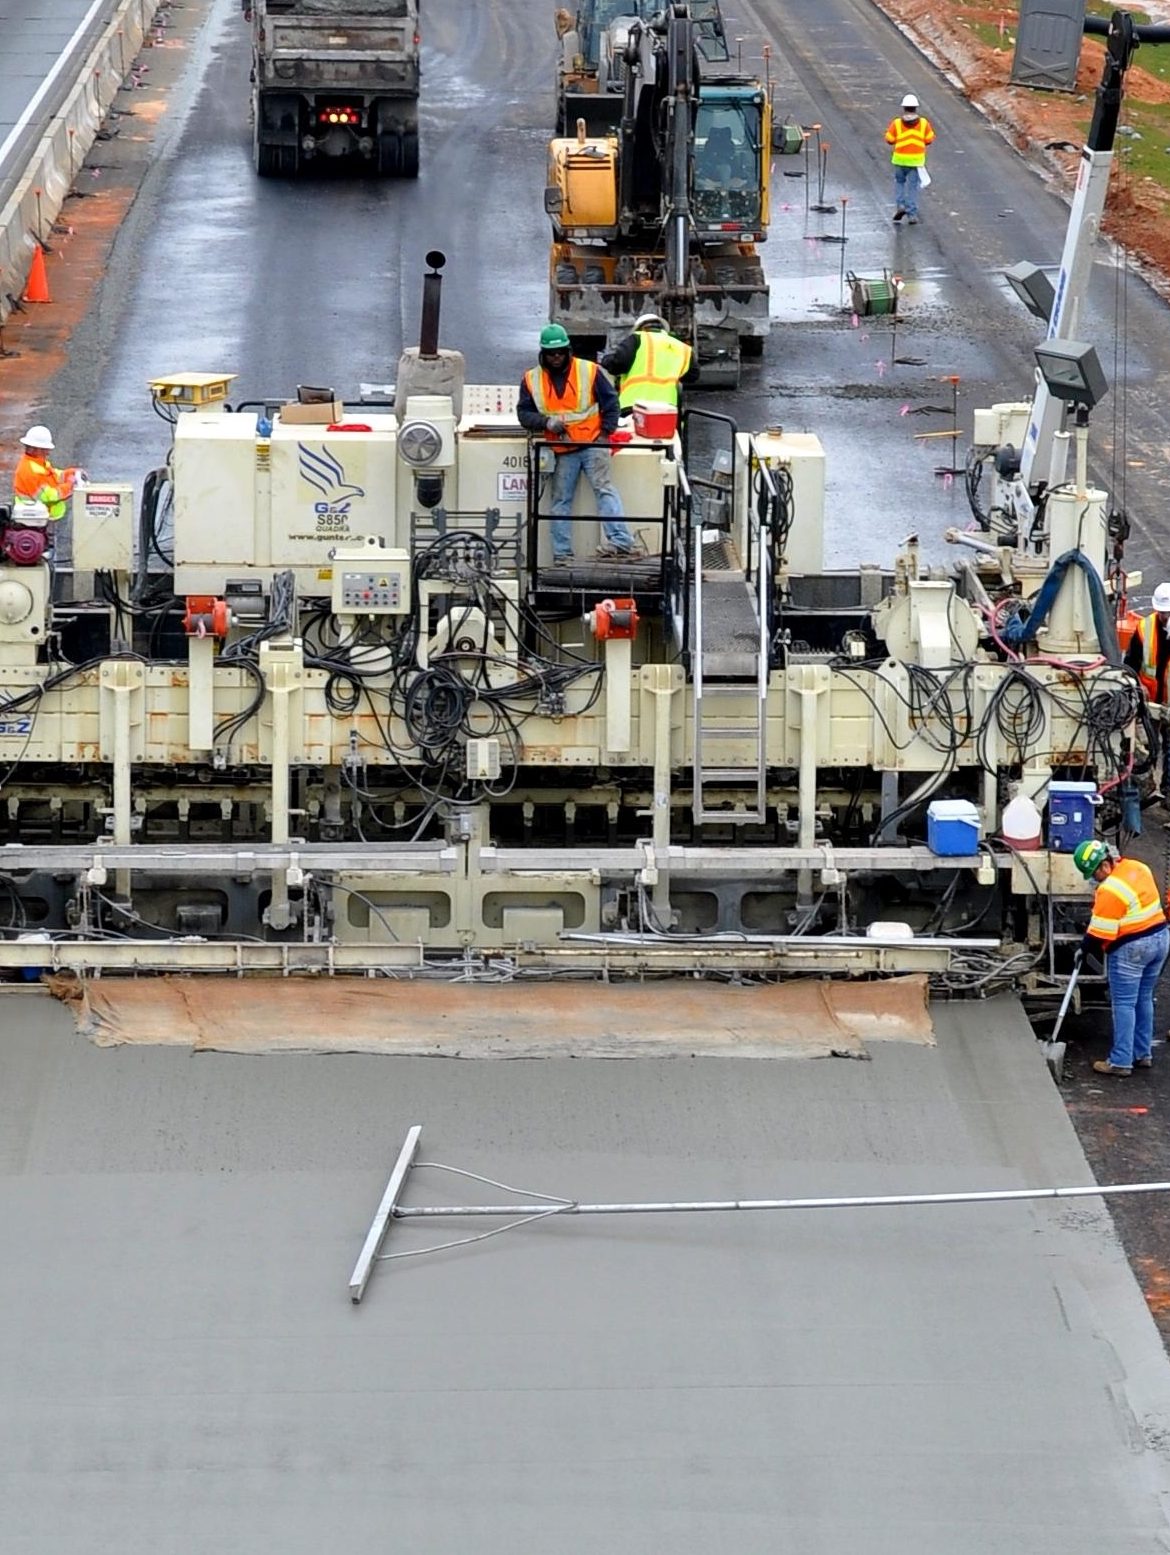
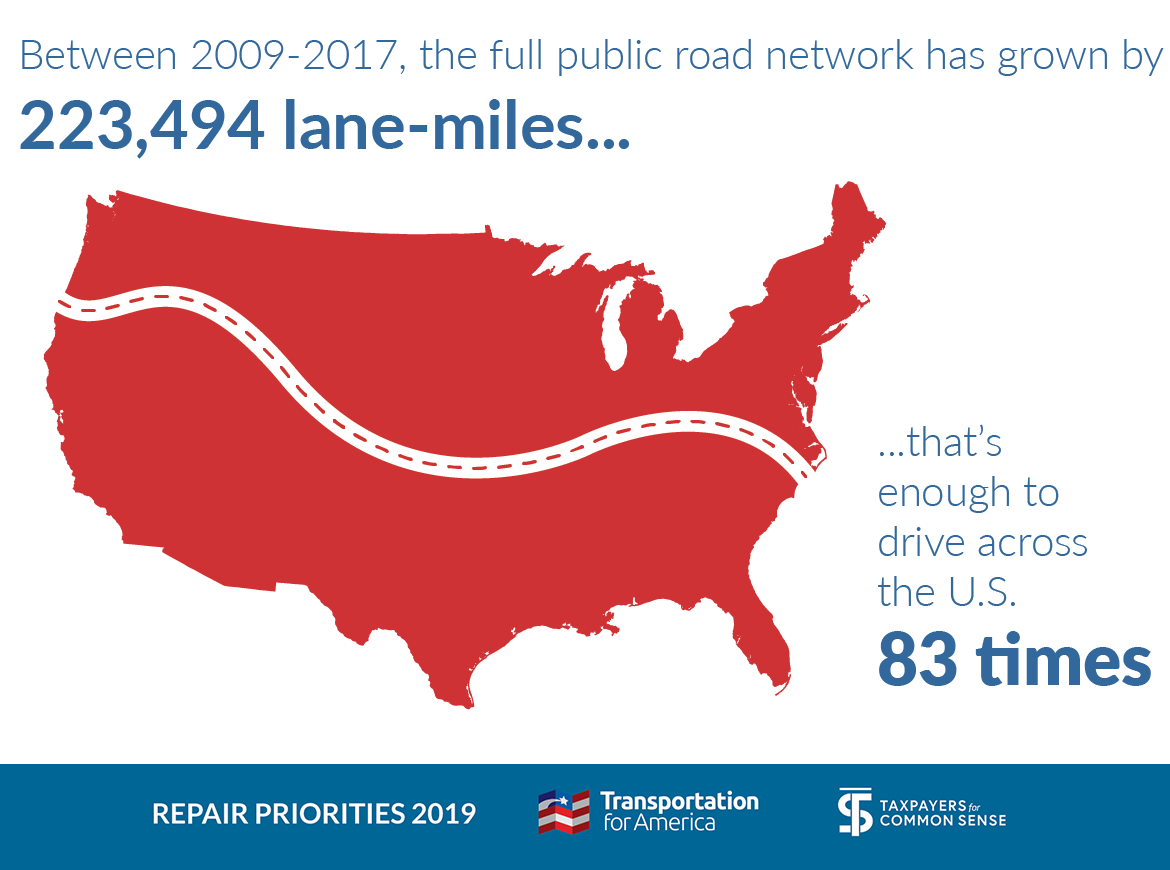
Repair Priorities 2019 is here — and it shows that more money won’t fix our infrastructure problems
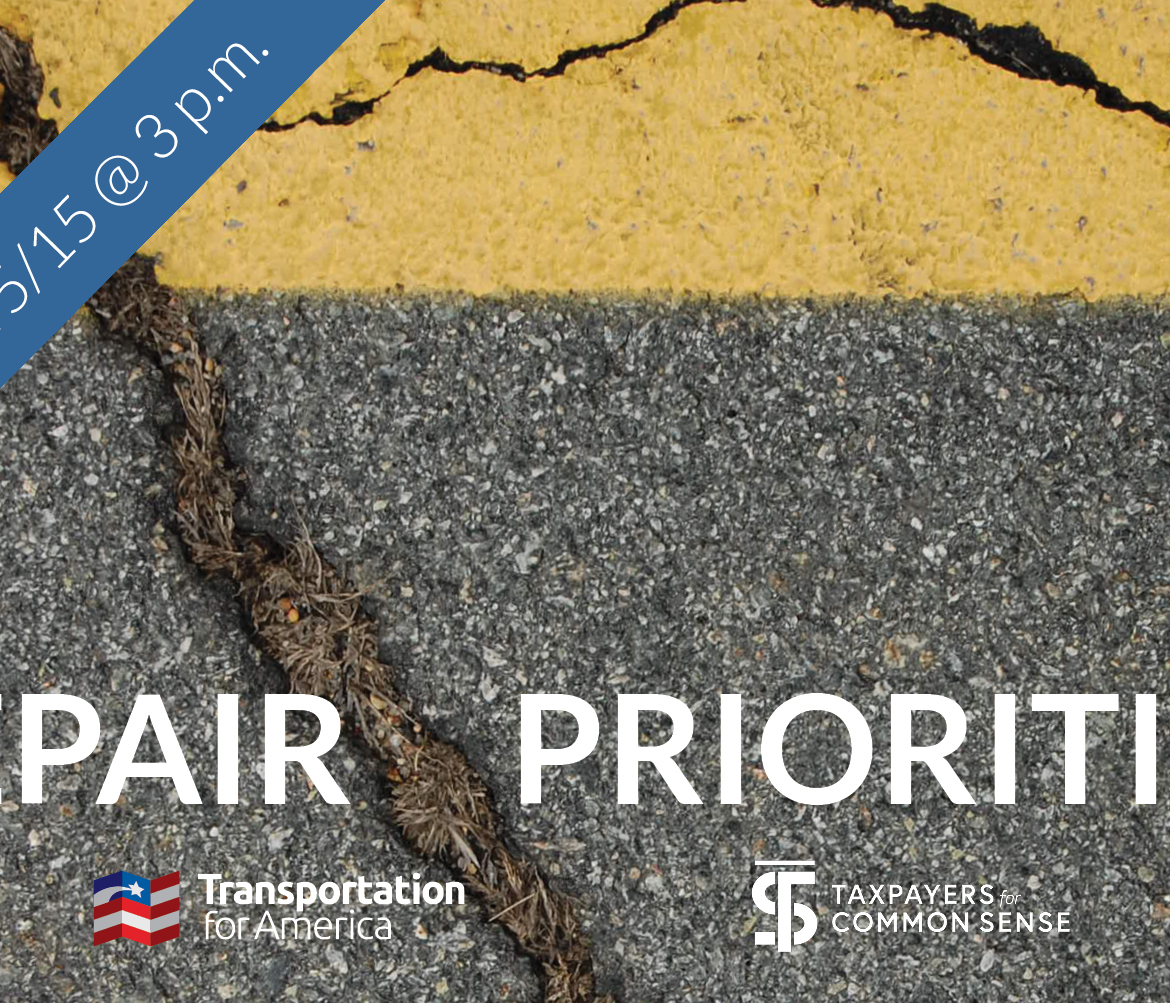
It’s infrastructure Week again and politicians are back at it, bemoaning our “crumbling roads and bridges” and insisting we must spend more to fix the problem. But we’ve got some cold water to throw on this pity party: Despite more transportation spending over the last decade, the percentage of the roads nationwide in “poor condition” increased from 14 to 20 percent.
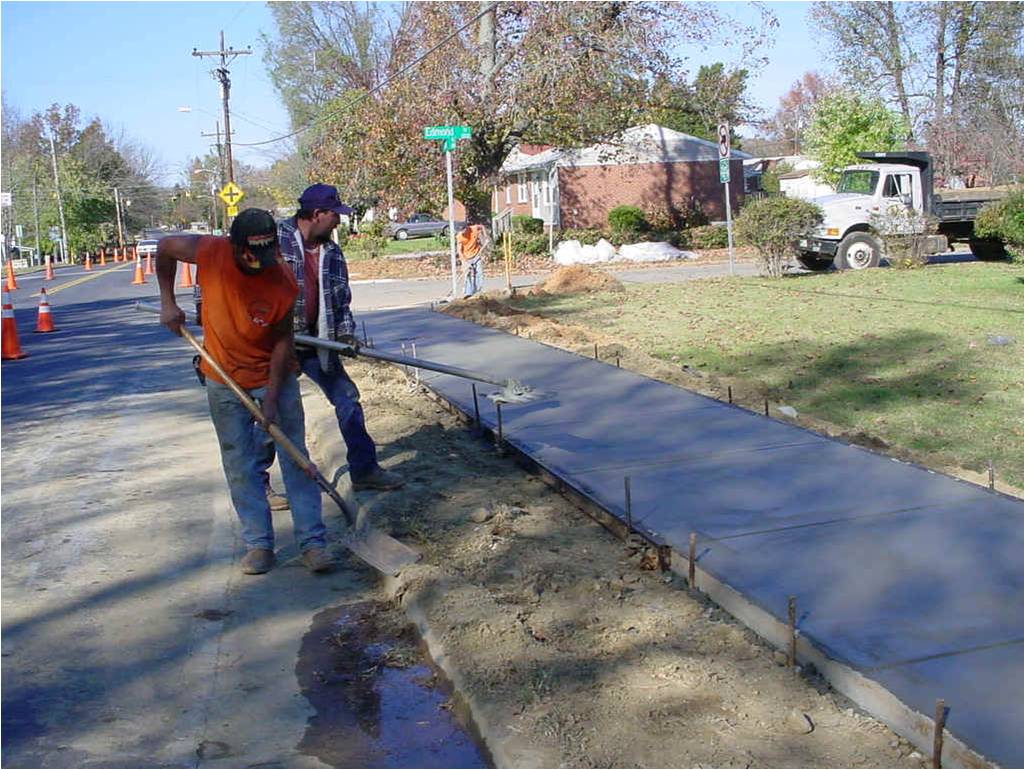
Are we creating assets or liabilities?
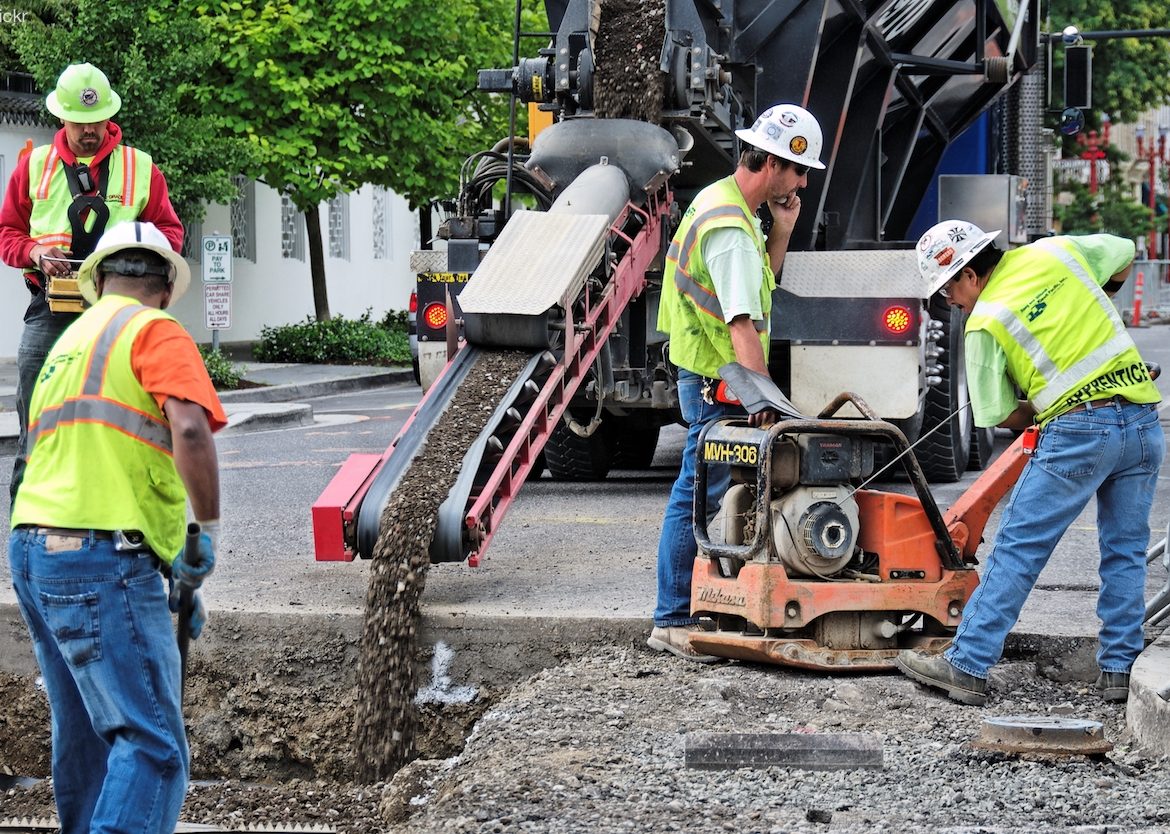
New roads are often considered new assets, but by ignoring repair many states have let those assets become liabilities—as our upcoming Repair Priorities report shows.
Is repair actually a priority?
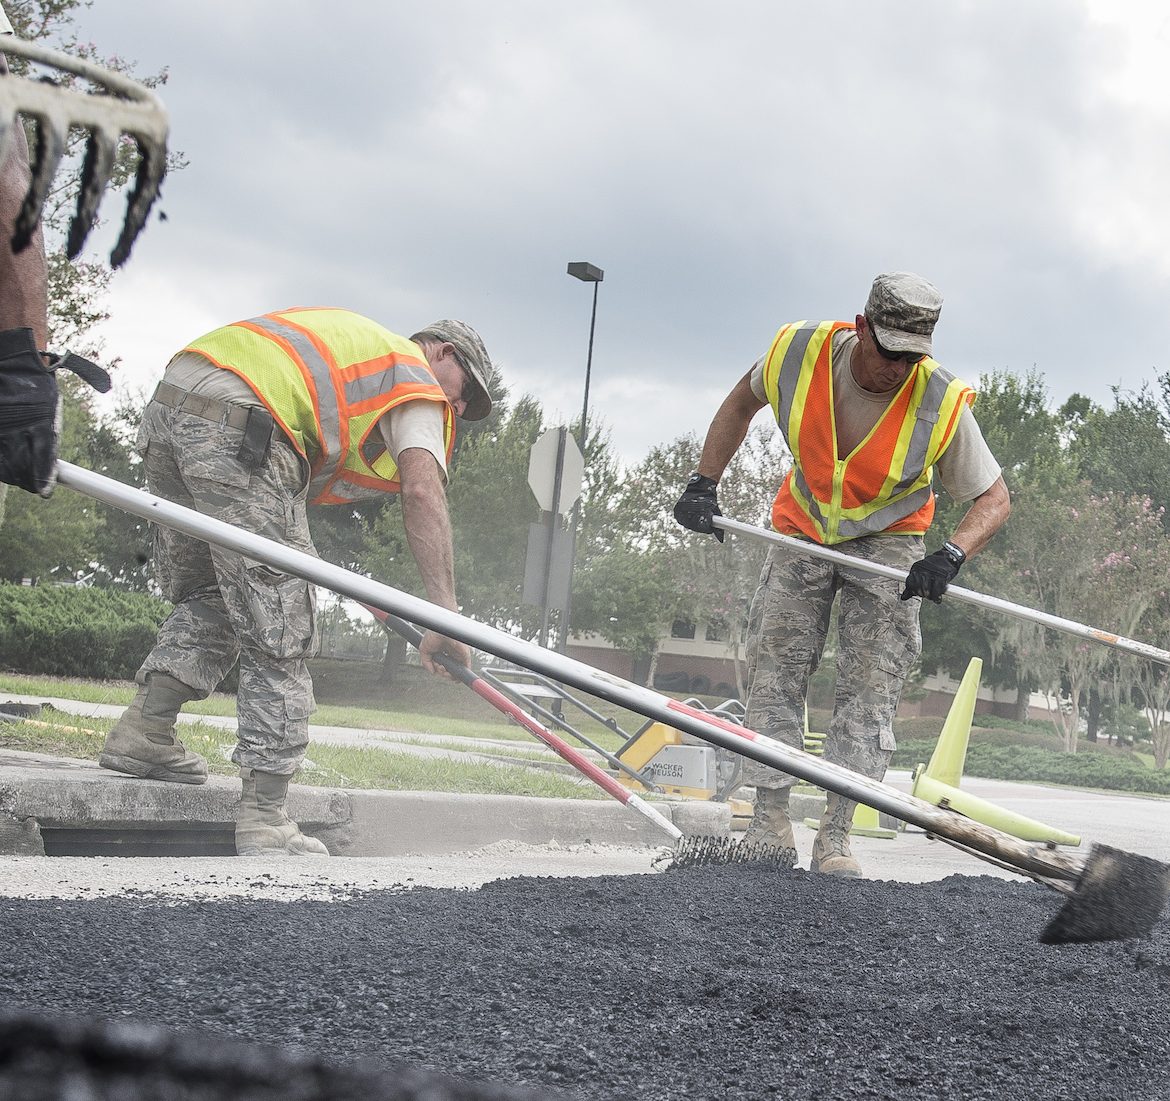
While politicians are focused on how much more funding we should give to infrastructure, our upcoming report sheds light on how states are using existing funding for repair vs. new roads and how policy can get the nation back on track.
Taming the TIGER: Trump turns innovative grant program into another roads program
Under President Trump, the U.S. Department of Transportation has effectively turned the formerly innovative BUILD program—created to advance complex, hard-to-fund projects—into little more than a rural roads program, dramatically undercutting both its intent and utility.
Catch up with the launch discussion of our new guide for improving & expanding transit
Catch up with yesterday’s launch webinar for T4America’s new guidebook, Fight for Your Ride: An advocate’s guide for expanding and improving transit, which offers tangible ways to improve transit in your city and region.
Fight for your ride: An advocate’s guide for expanding and improving transit
This new guide offers local advocates and transit champions practical advice for making real improvements to public transit.
Coming soon: A new report on how metro areas are building more and better bicycling and walking projects
Metro areas of all sizes across the country are strategizing, developing, and implementing new ways to improve bicycling and walking in their regions. Over the last year, T4America worked with metro areas across the country to collect and document these stories, ideas, and strategies into a guidebook that we’re releasing on December 11.
New report: Transit funding supports manufacturing jobs from coast to coast
Public dollars devoted to making capital improvements to public transportation systems support thousands of manufacturing jobs, in communities small and large, in nearly every state across the country.
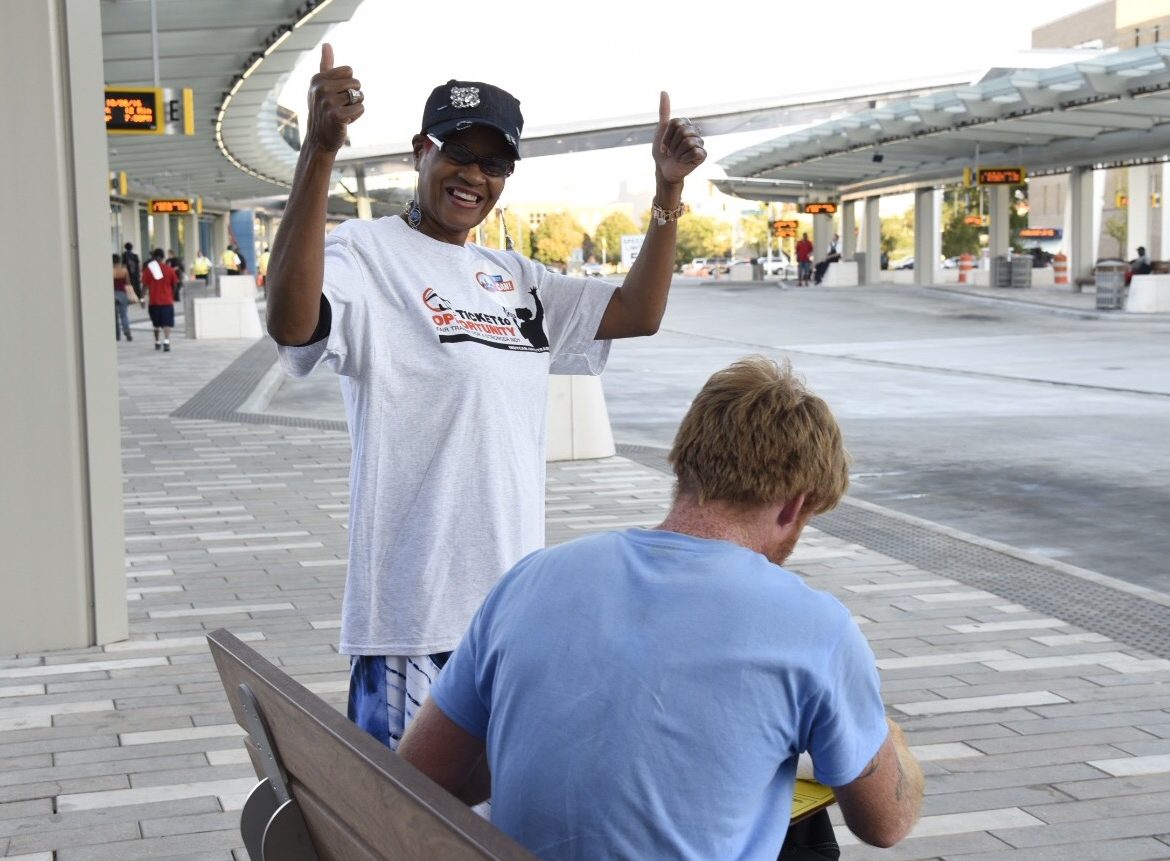
What’s at stake for small and rural transit providers?
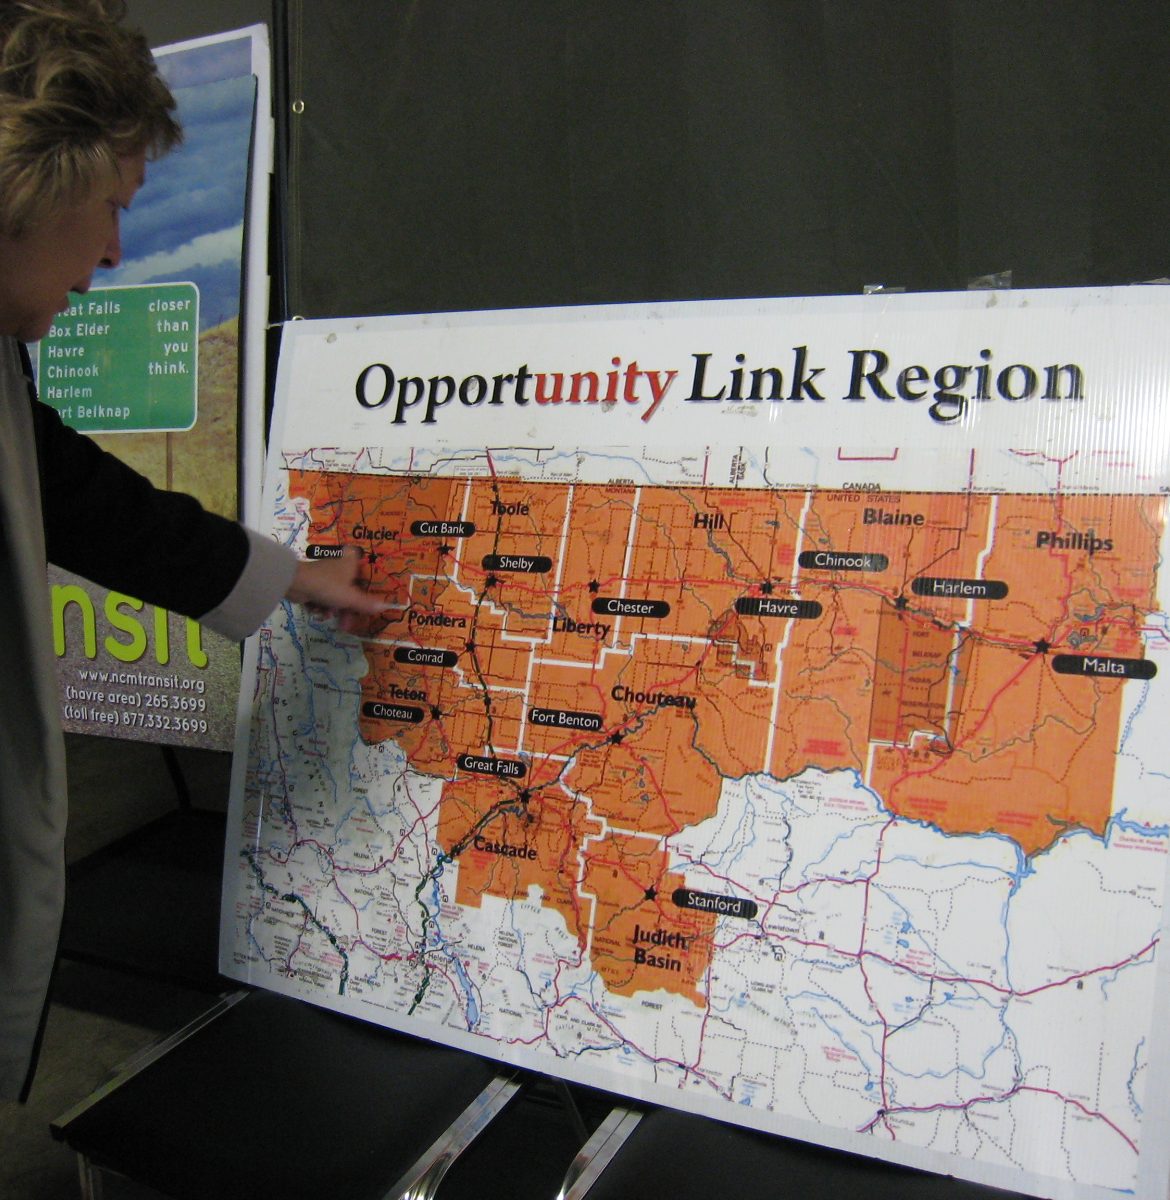
Federal transit funding is still on the chopping block. Those who operate or depend on transit — whether in small, rural areas or large, urban ones — must band together to convince both Congress and the President of the vital nature of public transportation services.
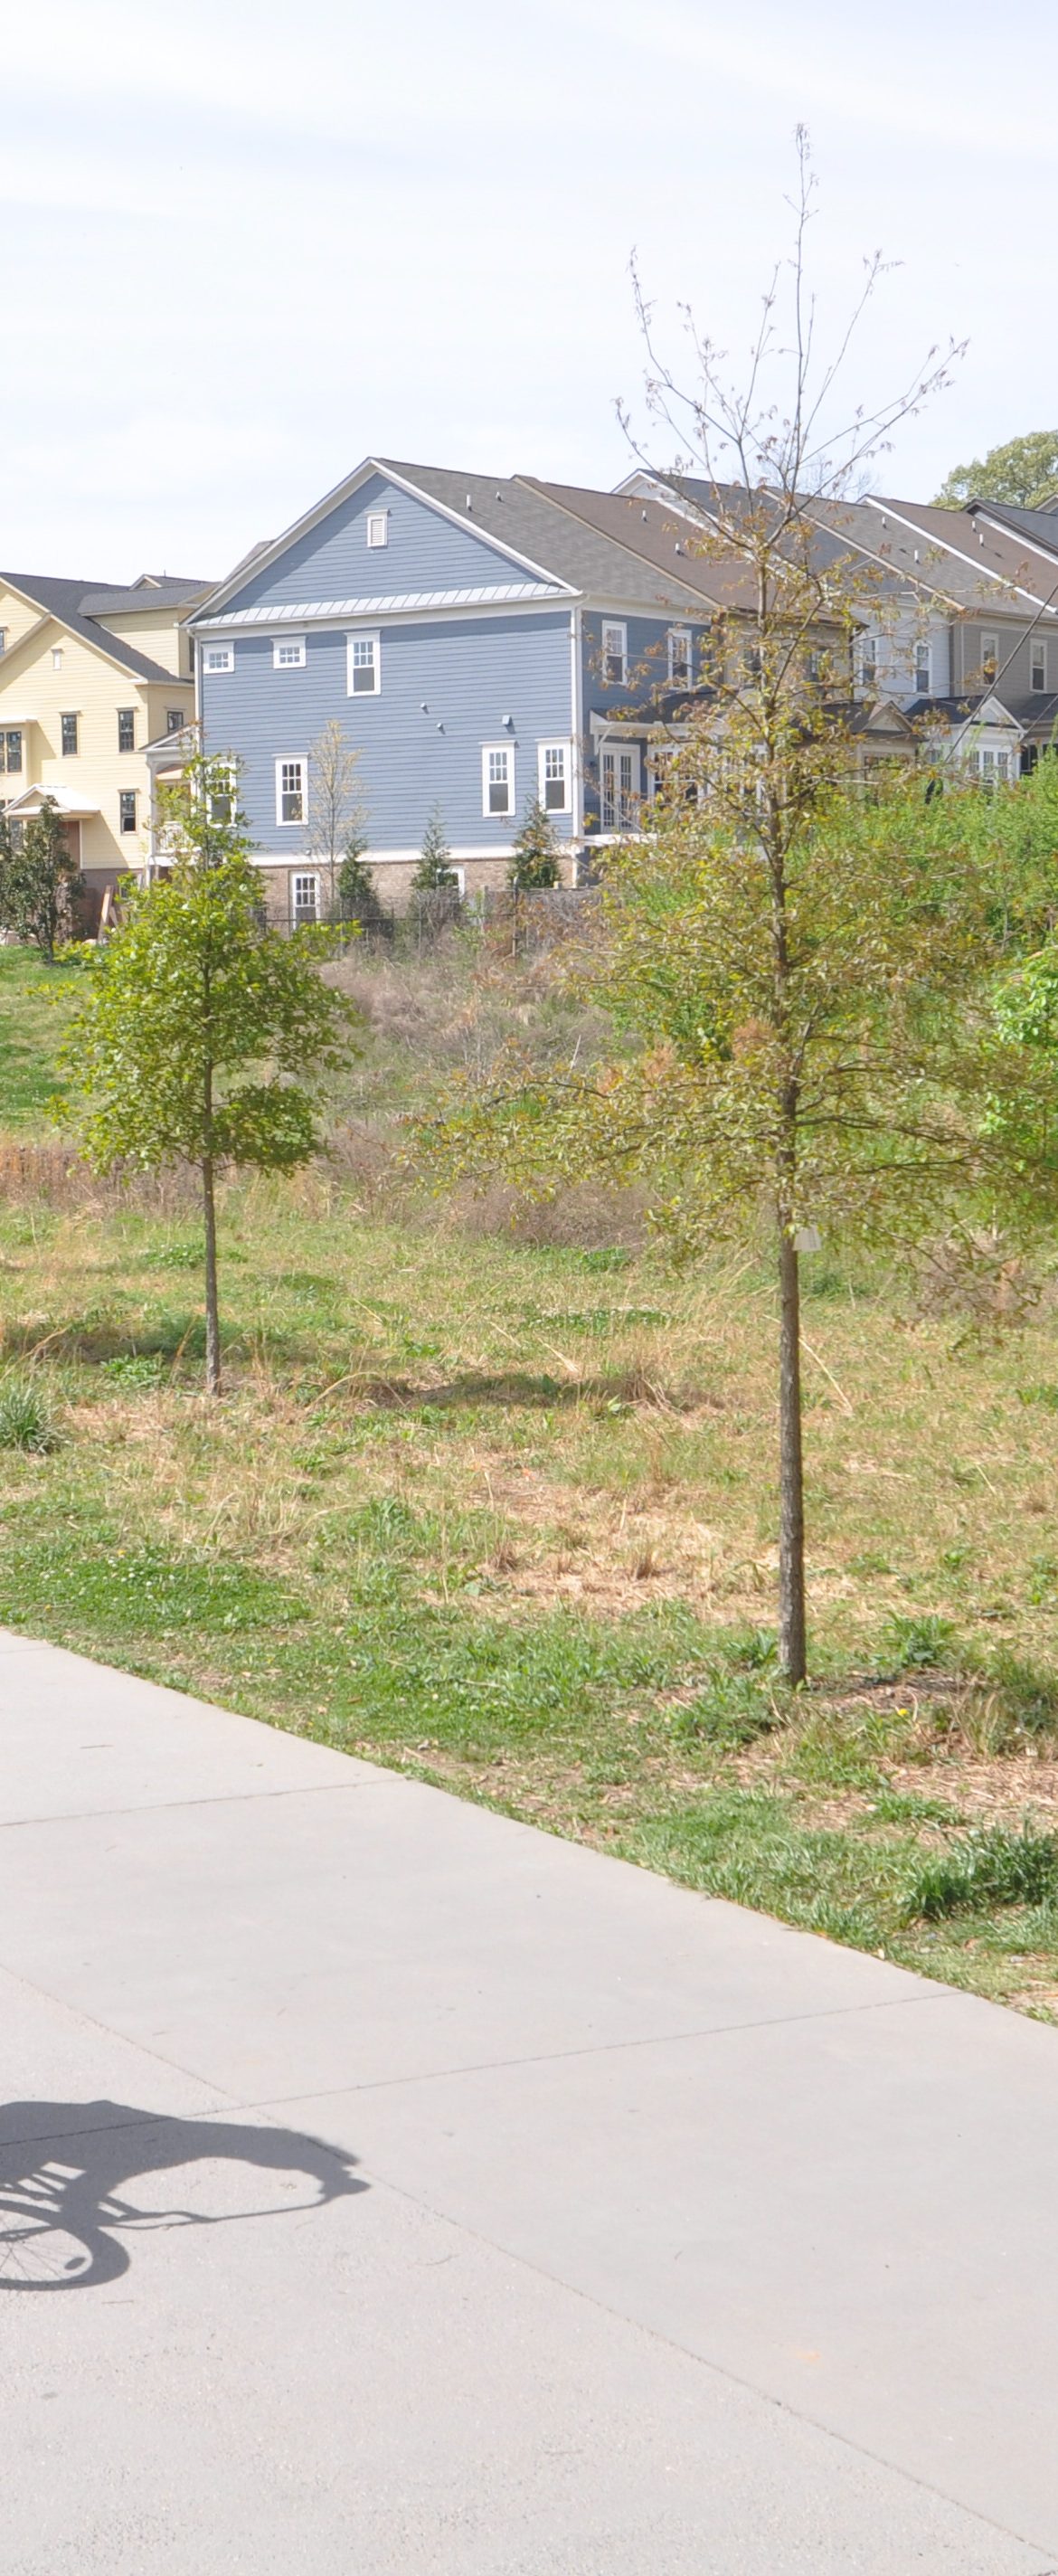
How are metro areas prioritizing health and building more biking and walking projects?
Though there’s booming demand all across the country to build more projects that can help residents get out and bike or walk — whether for exercise or just for getting around safely from A to B — it can be an uphill battle to do so. How are metro areas upending the conventional wisdom and building more projects that help improve their residents’ health?
New national survey examines how metro areas use performance measures to evaluate their spending
Thanks to action taken by Congress, metro areas will be required to use a data-driven process to measure the performance of their transportation spending. But some metro areas already go far beyond the modest new federal requirements. T4America’s new national survey of over 100 metro planning agencies examines the current state of the practice — and where it’s headed.
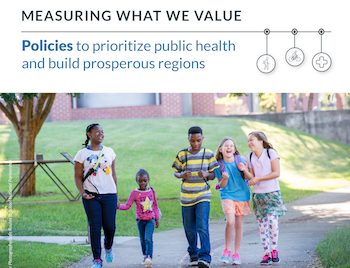
How metro planning agencies are promoting physical activity and health
Join us for the release of a new paper showing how regional transportation planning agencies are promoting physical activity and health.
Introducing “Empty Spaces,” new research about parking requirements for transit-oriented developments
The oversupply of parking around transit — usually at the direction of outdated engineering guidelines — takes up valuable land, raises the cost of development, and misses key opportunities. This new research from Smart Growth America analyzes the amount of parking actually used in five transit-oriented development areas and how it compares to the guidelines that many planners, engineers or developers follow.
Introducing “Dangerous by Design 2016”
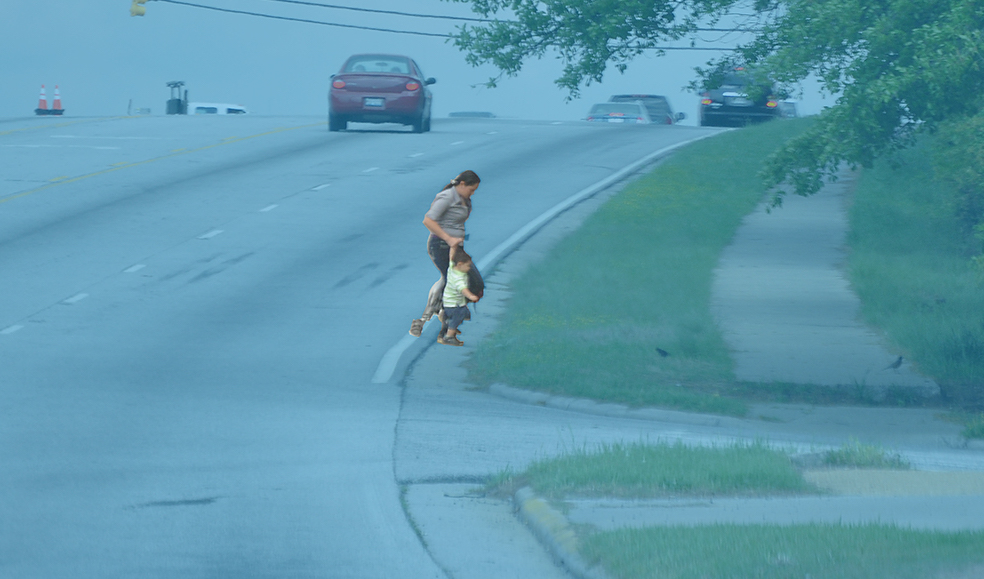
Between 2005 and 2014, a total of 46,149 people were struck and killed by cars while walking. That averages out to about 13 people per day.
While other cities try to replicate Houston’s successful bus network overhaul, Maryland’s plan for Baltimore falls short
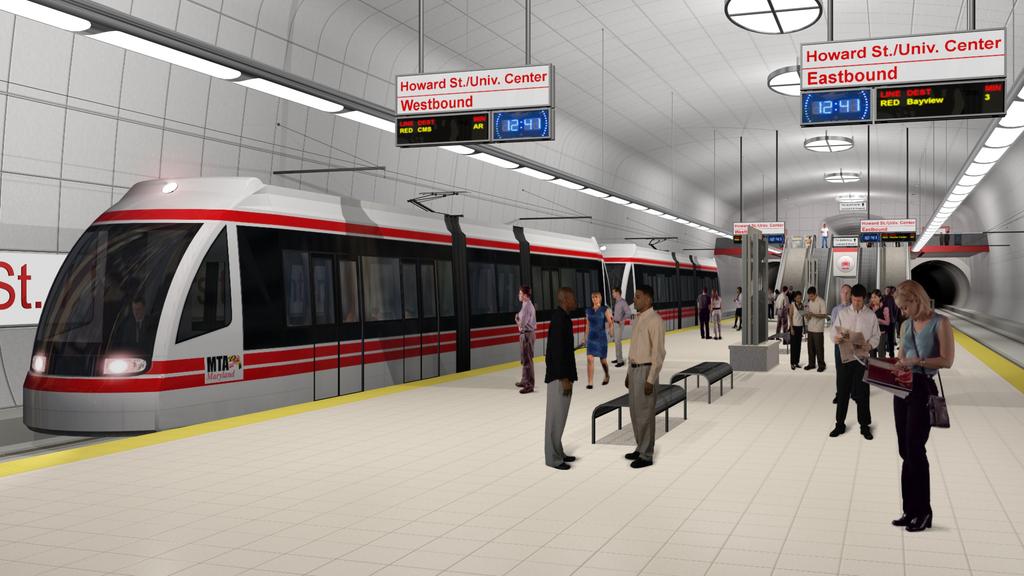
At a time when other cities are redesigning their bus transit service and aggressively investing in public transportation overall to provide more consistent, predictable service to serve residents and employers, Baltimore — thanks to the state of Maryland — is attempting to get the most out of its bus system with only marginal new investment and changes in service that won’t do much to improve access to jobs, schools, or opportunity.
Our three principles
It’s past time to elevate the national conversation about infrastructure beyond just the price tag.
Learn more about our platformLatest From The Blog


There’s a climate cost to America’s freeways, and…
Apr 23rd, 2024


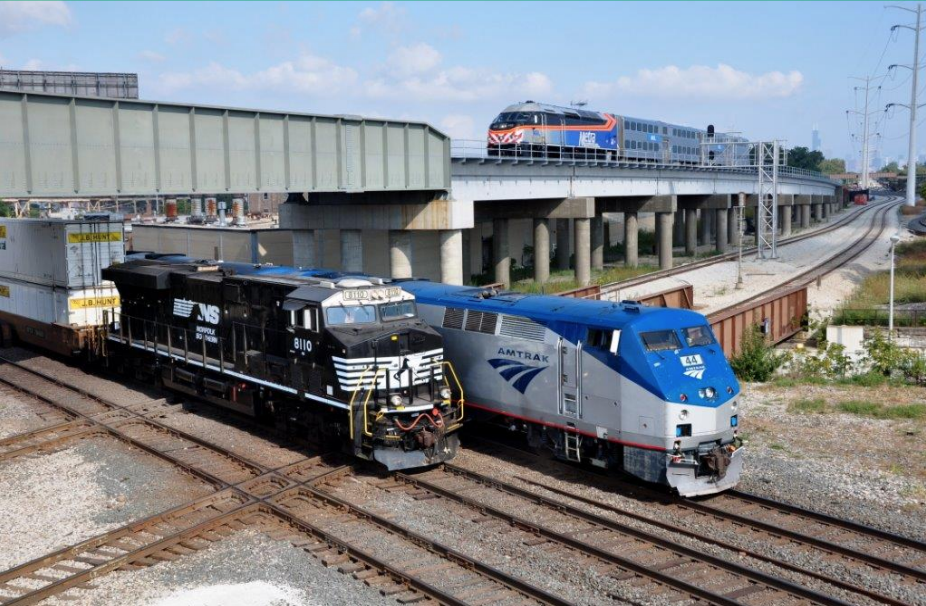
Progress for passenger rail in the South and…
Apr 10th, 2024

I cannot find the zoom link, I registered…
Jan 6th, 2024

A rare look behind the curtain of Transportation…
Jul 28th, 2023

In what Harrison Ford said was his most…
Jul 25th, 2023

Good example, walking to the local taco place…
Jul 24th, 2023