
Los Angeles’s “No Car” Olympic Games are important beyond 2028

The opening of LAX/Metro Transit Center Station on the Los Angeles Metro is a major milestone in the city’s history and is vital for the 2028 Summer Olympics, but there are far more reasons to invest in alternative transportation options beyond major sporting events.

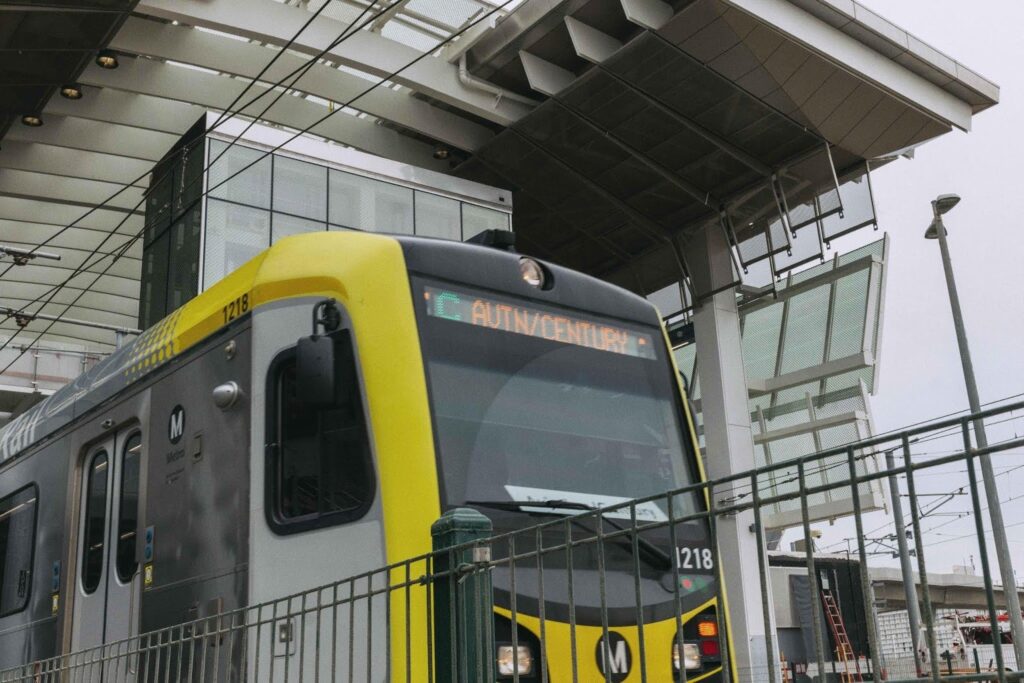
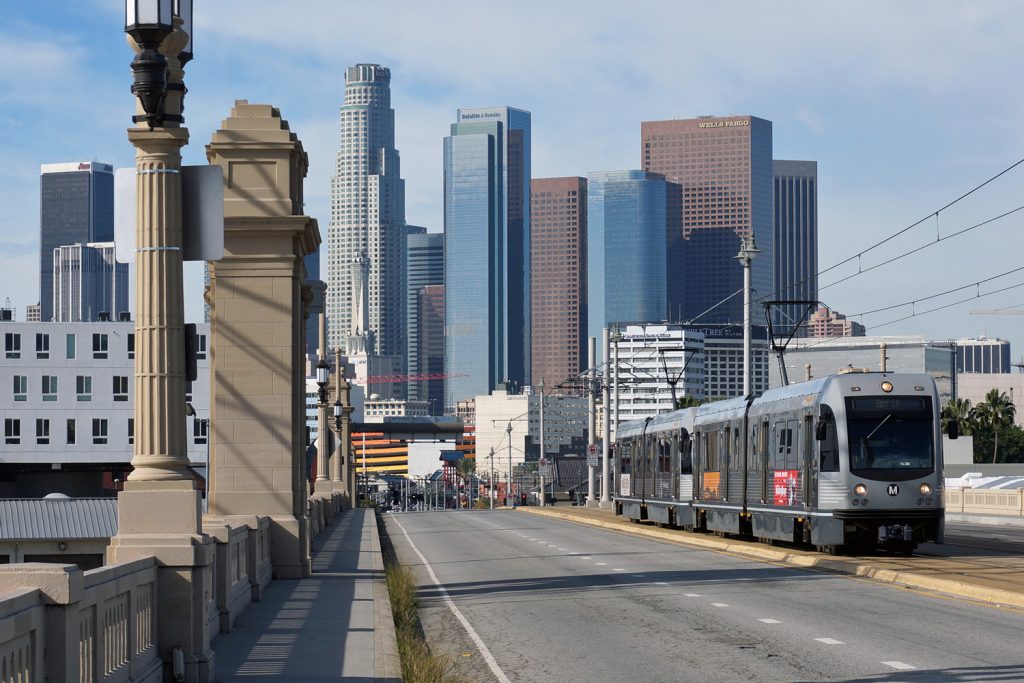
A Los Angeles Metro Rail C Line Train at LAX/Metro Transit Center during the testing phase (Source: LACMTA)

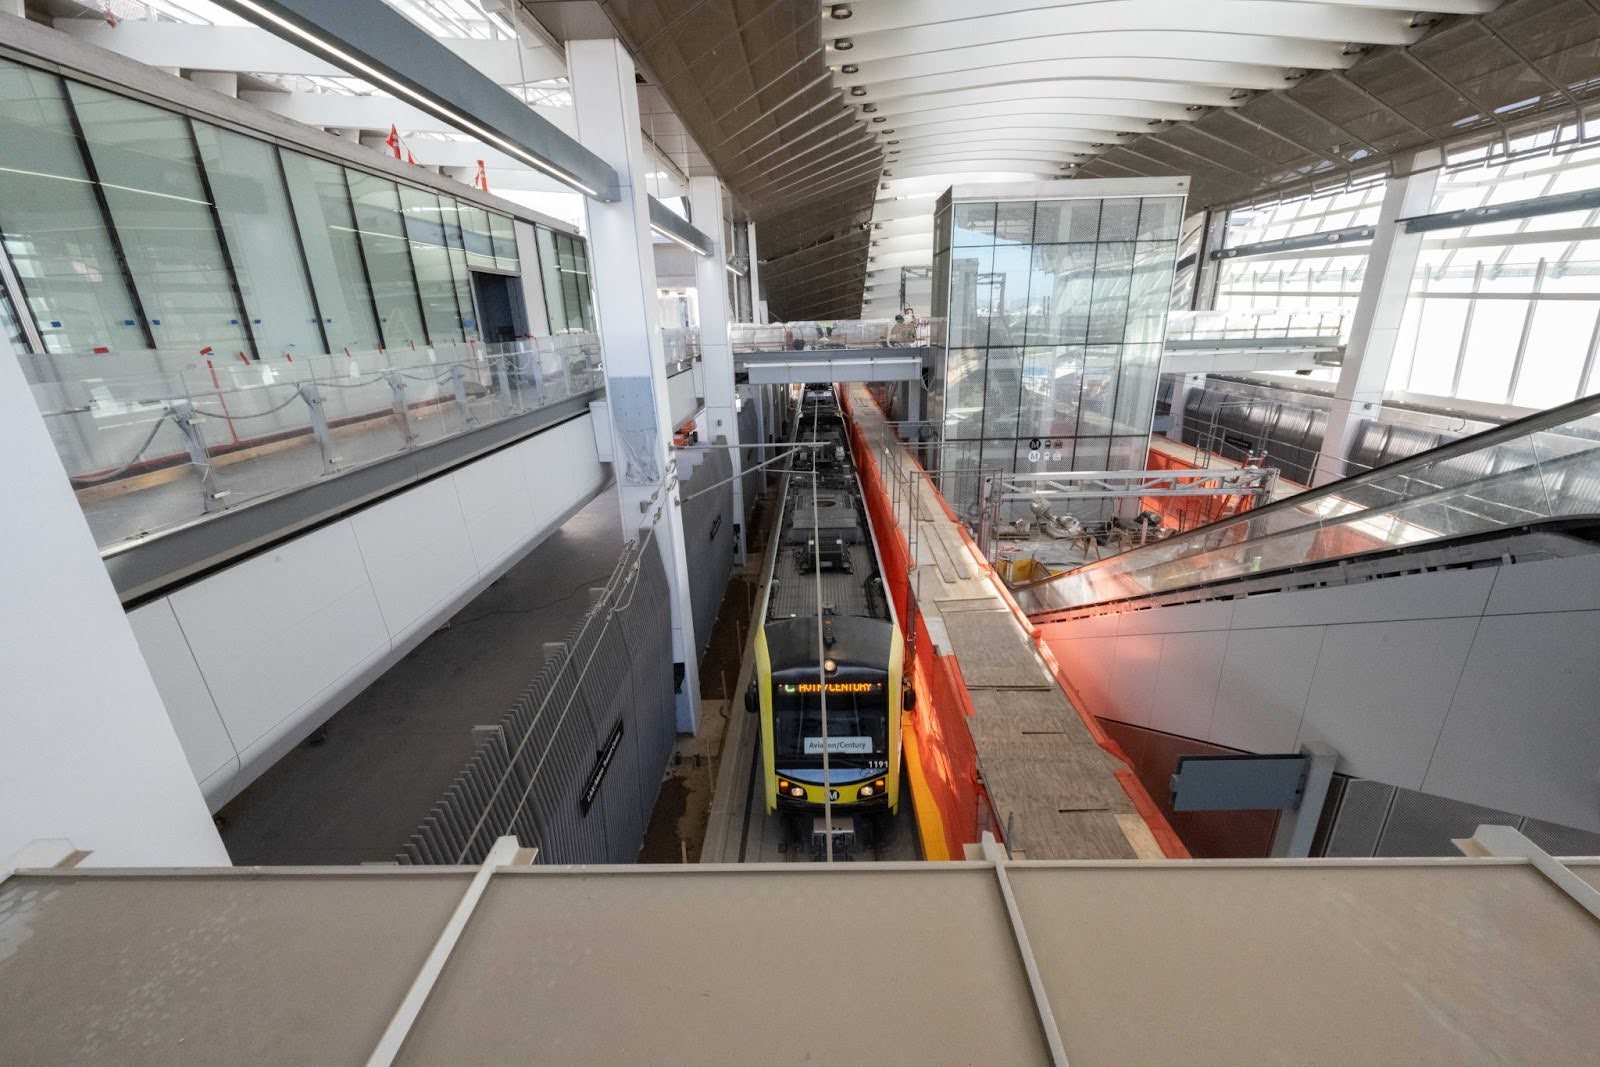
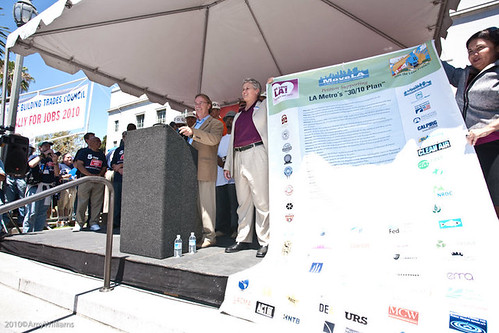
The grand opening of a long awaited station

(Source: LACMTA)

This year, the Los Angeles County Metropolitan Transportation Authority (LACMTA) plans to open the LAX/Metro Transit Center Station on the Los Angeles Metro Rail C and K Lines to serve Los Angeles International Airport (LAX). Despite having the second highest population of any city in the United States behind New York, Los Angeles did not provide rail transit service to LAX (the 8th busiest airport in the world) until 2025. While there is still work to be done on the LAX Automated People Mover (expected to open in 2026) to connect the transit center to the terminals at LAX without the need for a shuttle bus, the opening of LAX/Metro Transit Center is still a major milestone. LA has proven that it is committed to investing in the rest of its transportation system by heavily expanding the LA Metro Rail system and improving frequency and reliability on the LA Metro Bus network.

The LAX/Metro Transit Center Station is part of a larger set of projects known as the Twenty Eight by ‘28 plan in order to ensure Los Angeles and its transportation network are ready for the upcoming Olympic Games in the summer of 2028. Other upcoming notable projects part of the plan include the three phases of the D Line Extension along Wilshire Boulevard to the University of California Los Angeles (UCLA), an extension of the A Line to Pomona, bike lane and pedestrian path improvements along the Los Angeles River, and more. Many of these projects are important initiatives to incentivize other methods of transportation beyond driving and will greatly benefit the local residents beyond the Olympics and the influx of people it will bring.

Competing Priorities for “Car-Free Games”

Los Angeles is a city well known for its car culture and particularly for its traffic. However, Los Angeles Mayor Karen Bass has stated that the 2028 Olympics will be a “no-car games. This is a tall order for LA, and such an investment will require cooperation from the federal, state, and local levels. However, this mission statement by Mayor Bass aims to avoid congestion by making transit and active transportation the primary focus of the city for the Olympics.

These Olympic Games are a prime time to build transit better in LA, and show the world that a car-free Olympics is possible, even in a city famous for its traffic. In addition, these policy decisions to prioritize alternative transportation for the Olympics will have broad implications beyond the games themselves, as the transit improvements such as the A and D Line Extensions will permeate far beyond the Olympics in 2028, and greatly enhance how Angelenos move throughout the region.

However, it is important that Mayor Bass and the LA Metro follow through with their vision for a car-free games. The need to focus on traffic alleviation and unsafe freeway interchange has prompted LA Metro to shift their focus to freeway expansions, including Express Lanes in I-105, increasing capacity at the interchange of State Routes 57 and 60, and expanding capacity for I-5. These projects run counter to the notion of a car-free games and should be re-examined in favor of other, smaller multimodal improvements which emit less carbon and cause less congestion.

Beyond the Olympics

By focusing on other methods of transportation such as cycling, walking, and many modes of public transit from buses to light rail and heavy rail, LA is creating options for moving around the city beyond driving that will last far beyond the 2028 Olympics. Oftentimes, after the Olympics, many of the facilities built and used for the events end up being underutilized and expensive to maintain (also known as a white elephant facility). By primarily investing in mobility options and reusing existing facilities, LA is creating a lasting mobility legacy beyond the Olympic Games.

A local coalition started by Move LA (the only countywide organization dedicated to public transportation funding that passed transformative initiatives like Measures R and M), FASTLinkDTLA, Agency Artifact, LA Commons, LA Neighborhood Initiative, and the California Community Foundation have come together to create the “Festival Trail” as a legacy project. This 28-mile-long zero-emissions, non-vehicular corridor connects the major venues currently proposed for the 2028 Games in the greater LA region. The Festival Trail is a linkage to current and planned Caltrans, LA Metro, and LA city projects with new public spaces celebrating each community and unlocking up to 20,000 units of new affordable housing in the most under-resourced communities of south LA and downtown.

Ideally, it should not take a major sporting event such as the Olympics to see the benefits of public transit, cycling, and other alternative transportation improvements. Building more public transit, both bus and rail, and investing in cycling and pedestrian pathways should be principles that cities across the United States implement regardless. But these mega-events do provide a deadline to move these projects along at a much faster pace. If a city so famous for its car culture such as Los Angeles can understand the value of alternative transportation, any city can.

Connecting people to jobs and services week: How bad metrics lead to even worse decisions

When the top priority of our transportation investments is moving cars as fast as possible, the end product is streets that are wildly unsafe—as chronicled in depth last week. This focus on vehicle speed and throughput is the result of outdated metrics that utterly fail to produce a transportation system that connects people to what they need every day. 

A “successful” street, according to the metrics used by most state DOTs and metro areas. But “moving cars fast” as a goal fails to measure whether or not anyone can get where they are going. We need a better standard for success.

For “connecting to jobs and services” week, which focuses on our last of three principles for transportation investment, we’re re-surfacing portions of a post we wrote in 2016 about how one bad metric for evaluating potential transportation investments leads to expensive road projects that fail to get people where they are going every day.

All this week, we’re going to be unpacking our third principle for transportation investment, which is admittedly the most difficult to explain, especially compared to the first two: (1) prioritizing maintenance, and (2) prioritizing safety over speed. Before we can explain “connecting people to jobs and services,” we need to explain how the current federal transportation system is oriented around all the wrong things.

As we chronicled two weeks ago, if there are any existing priorities for the $40+ billion in annual federal transportation investment, it’s that cars should move fast, at all times, on all types of roads, no matter how many people die as a result. But we do almost nothing to measure whether or not any of this federal spending actually helps people get where they need to go each dayOne reason why is this wonky metric—created by the federal government—that nearly every state and local transportation agency uses to evaluate the success or failure of their transportation network.

Bad measures for success lead agencies to make bad decisions

As they plan projects and decide which transportation projects to fund, state and local transportation agencies exhaustively measure something called “vehicle level-of-service” for almost every single investment. Here’s a story to illustrate:

Wanting to rejuvenate their local economy, a local community cooks up plans to redesign the local street running through downtown that was perhaps even short-sightedly widened or converted to one-way travel in the 1960s or 70s. They want to make it safer and create a better environment for doing business—to make it a place to travel to, not through.

But because the street is also a state highway, they soon hear from the state department of transportation (DOT) that their proposed changes will slow down traffic and fail to meet “level-of-service” requirements. As a result, the project will fail to make the cut of the state’s short list of projects. Worse yet, the community is told that in order to make this street safer and “solve” congestion, they actually need to widen it and smooth out any curves, making it a virtual speedway, undercutting their plans to build a place with more enjoyable places to walk and visit—a framework for creating economic prosperity.

This terrific cartoon from Andy Singer shows how this rationale leads us to obliterate all the good things about our streets and places in pursuit of improving level of service:

A guy rototills his garden to eliminate weeds

andy singer cartoon rototil congestion city level of service street road design

What is level of service, and how do DOTs come to this conclusion?

Level of service is a system by which road engineers measure how well a road is performing based on the number of cars and the delay that vehicles experience on that roadway. Letters designate each level, from A to F. Just as with our time in school, A is great, and F is terrible.

A, B and C represent free-flowing conditions and F is stop-and-go traffic for vehicles. The score is assessed based on the highest level of congestion on that roadway, even if it only occurs for a few minutes a day. (To be clear, a street that is nearly empty 23.5 hours of the day can get an F if it gets congested during rush hour.) Traditionally, roadway conditions are acceptable if they score a C or higher on non-urban streets and a D or higher on urban streets.

This graphic, created by Jeff Tumlin, the new head of the SFMTA in San Francisco, illustrates how roads can be massively over-engineered to avoid level-of-service “F” with expensive capacity that largely goes wasted during the bulk of the day. Graphic via Strong Towns.

The level-of-service measurement is calculated by first measuring the amount of traffic during the busiest 15 minutes of an evening rush hour. Next, traffic engineers project the amount of traffic on the road in 20 or 30 years to determine if the road has enough capacity to cover the lifespan of the asset. If a road is projected by traffic engineers to lack capacity 20 years in the future—an incredibly fuzzy practice that’s far more art (or more accurately magic) than math—that road still receives a failing LOS grade today, even if the road is adequately suiting capacity needs.

Though there are no formal or federal requirements to do so, most DOTs, metropolitan planning organizations and traffic engineers rely on the level of service (LOS) transportation metric as they plan and design projects, and evaluate which ones will receive funding. I.e., projects that “improve” it get the fast track for funding, and projects that might make it “worse” are shelved or modified.

According to Jason Henderson, professor of geography at San Francisco State University, “Every city I’ve ever come across has some use of [LOS].” Because of the ubiquity of LOS, this largely misunderstood measurement has profound influence on the design of our communities.

This heavy reliance on level of service has dramatically shaped our cities, and it’s why states and metro areas and cities have spent billions to “solve” congestion in a way that has produced dangerous streets, dilapidated downtowns, economic disaster, and long-term maintenance costs that no locality can cover on their own.

Toledo and many other Rust Belt cities have little to no congestion and many of their in-town streets enjoy level of service “A.” Is that a good measure for success?

As Gary Toth from the Project for Public Spaces brilliantly put it in this piece, transportation professionals, “in search of high LOS rankings, have widened streets, added lanes, removed on-street parking, limited crosswalks, and deployed other inappropriate strategies” all because level of service has been the de facto standard over the last 50 years.

Every great street that you can think of in most places you want to visit on vacation probably “fails” level of service.

Congestion and level of service is “bad” because the street is home to numerous places people want or need to visit, the sidewalks are too wide and filled with pedestrians window shopping, there might be bike lanes to allow people to arrive without a car, and it’s almost certainly chock full, not necessarily of vehicles, but of people.

Poor level of service in Annapolis, MD. Tear down those buildings and you could add a couple of lanes in each direction and fix it!

Where did this measure come from?

The 1965 federal Transportation Research Board Highway Capacity Manual introduced this metric and it quickly became accepted as the standard measure of roadway performance. One reason that states adopted level of service so quickly was that it suited our country’s transportation goals in the 1960s of building out a network of interstates and prioritizing automobiles to travel quickly.

But as we explained at length last week, building highways and interstates with speed as the top priority is wildly different from building local and regional streets that create a framework for capturing value and providing for the safe movement of people, whether in a car or not.

Although LOS quickly became the standard, transportation agencies at any level are actually not explicitly required to use it: there are no planning or project design requirements that mandate the use of either LOS or travel modeling. FHWA [in 2016] issued a memo clarifying that level-of-service was never a federal requirement.1 But states persist, partially because the feds have never proposed a better measure of success or a more holistic overarching goal for what our billions are supposed to accomplish.

California was the first to make a notable shift, but more is needed

California set out to change the way they designed their streets and communities by changing the way they measure their performance. In 2013, California legislature passed a law directing the Office of Planning and Research (OPR) to instead measure vehicle-miles traveled (VMT), making it possible for projects aiming to reduce driving to fare well in the evaluation process. In 2013, Governor Jerry Brown signed into law SB 743, eliminating the use of level of service for projects within designated transit priority areas (i.e, areas with decent transit service.)

As Streetsblog LA reported in 2013, because most urban areas fall within the state-defined parameters of a transit priority area, this means that level of service is largely eliminated as a consideration for urban projects. Additionally, SB 743 authorized Governor Brown to develop a new way of measuring traffic impacts of major projects statewide and based the new way on total vehicle miles traveled (VMT) rather than intersection congestion.

Depending on how California implements this, it would change how development and transportation projects are analyzed and scored in traffic impact studies and thus send the state’s billions in transportation dollars toward projects that will help meet the state’s overall goals—rather than projects that will simply keep the cars moving quickly at all costs.

In short, instead of measuring the success of a proposed project by only the limited measure of whether or not traffic might slow for a few minutes per day at rush hour, CalTrans will now measure whether or not a project contributes to other state goals, like reducing greenhouse gas emissions, developing affordable multimodal transportation options for residents, preserving open spaces, or promoting diverse land uses and infill development. It is expected that this change will make it easier to build transit projects, as well as bicycle and pedestrian-friendly infrastructure—instead of encouraging more development that works against California’s own environmental and other goals.

$40+ billion is spent each year with no clear measures for success other than “move cars fast”

We need better priorities for federal transportation investment than just “move cars fast, all the time.” A fundamental principle has to be that the people who use our transportation system should be able to get where they are going. That’s where we are going with our third principle, which we’ll be unpacking in another post: “Connect people to jobs and services.” This metric would be a far better measure of success than anything on the books today, and some places are already starting to implement it.

Mixed messages on transportation at the ballot box this week

With a range of notable ballot measures for transportation considered by voters Tuesday, how did the issue fare at the ballot box? Did the recent trends for transportation-related measures continue?

Metropolitan Transit System, Trolley # 4014

Compared with two years ago when there were a number of major, big-ticket ballot measures to raise billions in new local revenue for transit on the ballot, there were relatively few local ballot measures raising new money for ambitious bus or rail transit projects in 2018. We’ll get into what actually happened at the local level, but this year, one of the more interesting trends emerged at the state level.

[member_content]

T4America members: We’ve produced a more detailed post-election analysis for you. You can download that short document here. Reach out to us if you have any questions.

[/member_content]

Statewide

The biggest question on the ballot was Proposition 6 in California, which would have undone the state’s 2017 legislation that increased fuel taxes to raise more than $50 billion to prioritize repair and pledge billions toward transit, safe streets for walking and biking, and an overall multimodal approach to solving the state’s transportation challenges. The legislation also gave money directly to California localities to spend on their greatest needs, allowing for a strong measure of local control.

Proposition 6 was defeated—preserving 2017’s tax increase—with just 45 percent in favor. Of all the states that have raised new transportation revenues since 2012, California was one of the few that raised new money that could be used on a diverse range of needs. Voters just signaled their approval for this approach a year later.

By contrast, statewide proposals to raise new revenues for transportation—almost all for only roads—failed in Missouri and Colorado, as well as a non-binding advisory measure in Utah that went down by a wide margin. While a portion of Colorado’s gas tax dollars (those directed to localities) can be used on any transportation purpose, both Missouri and Utah have constitutional prohibitions on 100% of their gas tax dollars, preventing them from being spent on any other transportation needs.

What’s the trend to extrapolate from these four measures? The latter three measures were essentially status quo referenda on whether or not voters want to put more money into the existing state system for transportation. The taxpayers resoundingly answered “no.” In Missouri’s case, this was their second run at raising state fuel taxes for only roads, and like in 2014, voters in the state’s metro areas widely rejected the measure, viewing the taxes as regressive and a way to funnel money out of their metro area to pay for needs elsewhere in the state. All three contrast with California’s new system to devote new taxes toward a range of multimodal projects that was reaffirmed by voters.

This will be the most pressing question of 2019 as Congress ramps up to work on reauthorization. Do the American taxpayers believe that the federal transportation system works for them? Will they be supportive of federal legislators raising their taxes or creating new revenues to put into the same old system?

Local

At the local level, there were notable measures approved in Broward County (north of Miami) and Hillsborough County (Tampa). Broward’s penny sales tax increase would raise $15.6 billion over 30 years, largely for transit with about $9 billion earmarked for new light rail lines. In Tampa’s case, after a few failed attempts, they finally passed a measure with money for transit that raises the sales tax by a penny to raise about $275 million annually for transportation. (Revenues are split 45/55 between transit and roads/other projects.)

Federal

Many want to know how the changeover in House leadership will impact transportation, and particularly transit funding. It’s worth noting, however, that it’s been a bipartisan effort in Congress to press on USDOT to keep these transit projects moving. It was a Republican House and Senate that approved an unprecedented provision to the 2018 appropriations bill requiring USDOT to obligate all of their 2018 transit capital grants before the end of 2019. And it was a Republican move in the Senate to require Trump’s USDOT to use President Obama’s TIGER grant qualifications for the last round of TIGER grants.

Will much else change with the House’s leadership transition? The top Democrat on the House Transportation and Infrastructure Committee—the committee charged with writing policy for the 2020 reauthorization—went on the record today saying that federal transportation policy is just fine as it is. All we need is more money.

We’ll have more on the federal angle in the coming days. View our tracker for 2018 state and local ballot measures for transportation here.

California prioritizing repair, transit investments, and walking & biking with new gas tax increase

California could be the next state to raise new revenues to invest in transportation, and unlike most states doing so since 2012, CA lawmakers are prioritizing repair and pledging billions toward transit, safe streets for walking and biking, and an overall multimodal approach to solving the state’s transportation challenges.

Metropolitan Transit System, Trolley # 4014

Updated (4/7/16): The Senate voted 27-11 and the Assembly voted 54-26 to approve the measure on Thursday night. It is expected to be signed soon by Gov. Brown.

A bill (SB 1) currently before the California legislature would raise $52 billion in new transportation revenue by raising the gasoline tax — unchanged in 23 years — by 12 cents (to 30 cents per gallon), increasing diesel taxes by 20 cents (to 36 cents per gallon) and creating a new annual fee on almost all vehicles based on value. The bill has the strong backing of Gov. Jerry Brown (D). It is being considered by the Senate on Thursday and could be approved in a matter of days. The bill requires a two-thirds supermajority to pass and, though Republicans have uniformly opposed the bill, Democrats hold this majority in both chambers, but only barely.

The bill is projected to raise $52 billion in total over the next decade, directing $7.5 billion to transit capital and operations, putting $1 billion into the state’s Active Transportation Fund and reserving $4 billion expressly for bridge repair. (Interesting fact: if you sort a list of the entire country’s 60,000-plus deficient bridges by traffic volume carried, California claims more than the first 100 spots.)

The multimodal approach to solving the state’s mobility challenges, a heavy focus on prioritizing repair and maintenance, the commitment to supporting public transit and local priority projects, and dedicating about two percent of all new revenues to making it safer and more convenient to walk or bike set California’s approach apart from other states that have advanced legislative packages over the last few years.

It’s worth noting that numerous environmental groups are opposing the bill because of a provision, added late in the process with little debate, which would make it difficult for air quality regulators to create stiffer rules down the road to require cleaner trucks. Others support the overall package while urgently pressing legislators to remove this truck-related provision. (This Streetsblog CA piece fleshes out more of the details about the opposition.)

On the flip side of this equation, part of the tax increase on diesel trucks would be directed into a multimodal freight program, creating a mechanism to tax a negative externality (diesel emissions) and steer a portion of those revenues into cleaner, multimodal projects to move freight.

The bill is currently before the state Senate, and could be considered by the full Assembly in the days ahead. Read about other states that have raised new transportation revenues in the past few years, and find out more about our network for state advocates and elected leaders interested in doing the same.

California officially dumped the outdated “level of service” metric — your state should too

California made a small but crucial change to how they measure the performance of their streets in 2013, shifting away from a narrow focus on moving as many cars as fast as possible and taking a more holistic view and measuring a street’s performance against a broader list of other important goals. So what is this outdated “level of service” measure and how can other states follow California’s lead?

Wanting to rejuvenate their local economy, a community cooks up plans to redesign the local street running through downtown that was perhaps even short-sightedly widened or converted to one way travel in the 1960’s or 70’s. But as the street is also a state highway, they soon hear from the state department of transportation (DOT) that their proposed changes will slow down traffic and fail to meet “level of service” requirements and won’t make the cut of the state’s short list of projects. Worse yet, the community is told that in order to make a street safer, they actually need to widen it and smooth out any curves, making it a virtual speedway, undercutting their plans to build a place with more enjoyable places to walk and visit — a framework for creating economic prosperity. Heard this story before?

What is level of service, and how do DOTs come to this conclusion?

Though there are no formal or federal requirements to do so, most DOTs, metropolitan planning organizations and traffic engineers rely on a metric known as level of service (LOS). According to Jason Henderson, professor of geography at San Francisco State University, “Every city I’ve ever come across has some use of [LOS].” Because of the ubiquity of LOS, this largely misunderstood measurement has profound influence on the design of our communities.

Level of service is a system by which road engineers measure how well a road is performing based on the number of cars and the delay that vehicles experience on that roadway. Letters designate each level, from A to F. A, B and C represent free-flowing conditions and F is stop-and-go traffic. The score is assessed based on the highest level of congestion on that roadway, even if it only occurs a few minutes a day. Traditionally, roadway conditions are acceptable if they score a C or higher on non-urban streets and a D or higher on urban streets.

The LOS measurement is calculated by first measuring the amount of traffic during the busiest 15 minutes of an evening rush hour. Next, traffic engineers project the amount of traffic on the road in 20 or 30 years to determine if the road has enough capacity to cover the lifespan of the asset. If a road is projected by traffic engineers to lack capacity 20 years in the future — an incredibly fuzzy practice that’s far more art (or magic?) than math — that road still receives a failing LOS grade today, even if the road is adequately suiting capacity needs.

This heavy reliance on LOS has dramatically shaped our cities. As Gary Toth from the Project for Public Spaces brilliantly put it in this piece, transportation professionals, “in search of high LOS rankings, have widened streets, added lanes, removed on-street parking, limited crosswalks, and deployed other inappropriate strategies” all because LOS has been the de facto standard over the last 50 years. This terrific cartoon from Andy Singer that Toth includes shows the rationale in practice:

A guy rototills his garden to eliminate weeds

andy singer cartoon rototil congestion city level of service street road design

Where did this measure come from?

The 1965 federal Transportation Research Board Highway Capacity Manual introduced the LOS metric and it quickly became accepted as the standard measure of roadway performance. One reason that states adopted the LOS so quickly was that it suited our country’s transportation goals in the 1960’s of building out a network of interstates and prioritizing automobiles to travel quickly.

Although LOS quickly became the standard, transportation agencies at any level are not explicitly required to use it: there are no planning or project design requirements that mandate the use of either LOS or travel modeling. FHWA recently issued a memo clarifying that level-of-service was never a federal requirement. Read more about that (and some other important changes) in this recent story:

If we are going to change the way our streets and communities are designed, we will need to change the way we measure their performance. And that’s exactly what California has set out to do. In 2013, California legislature passed a law that began the shift, directing the Office of Planning and Research (OPR) to use an alternative of measuring vehicle-miles traveled (VMT).

In 2013, Governor Jerry Brown signed into law SB 743, eliminating the use of LOS for projects within designated transit priority areas (TPAs). As Streetsblog LA reported in 2013, because most urban areas fall within the state-defined parameters of a TPA, this means that LOS is largely eliminated for urban projects. Additionally, SB 743 authorized Governor Brown to develop a new way of measuring traffic impacts of major projects statewide and based the new way on total vehicle miles traveled (VMT) rather than intersection congestion. This will change how development projects are analyzed and scored in traffic impact studies and thus the type of projects that match up with the state’s goals for development.

In short, instead of measuring the success of a project by only the limited measure of whether or not it will make it less convenient to drive, CalTrans will now measure whether or not a project contributes to other state goals, like reducing greenhouse gas emissions, developing affordable multimodal transportation options for residents, preserving open spaces, and promoting diverse land uses and infill development. It is expected that this change will make it easier to build transit projects, as well as bicycle and pedestrian-friendly infrastructure — instead of encouraging more development that works against California’s own environmental and other goals.

How can other states replicate this move?

Great question.

This change in California is just one of the many smart policy changes that we’ll be covering in detail in Sacramento this November at Capital Ideas II, our one-of-a kind conference on state transportation policy. We’ll have experts on hand from California who will be discussing their legislative and policy shift away from level of service. Expect to hear more about that as we finalize the agenda in the coming weeks and share it here with you.

Learn More & Register

Capital Ideas II


What progress did states make this year on raising new funding or improving policy?

Nearly all state legislatures have adjourned for the year. Here’s our regular look at the progress made in states working to create more transparency, build more public trust in transportation spending, or raise new money.

Though most states have wrapped up their legislative sessions, transportation funding fights still loom large on the agendas for many of the states still in session. And one key issue to watch is the scores of local governments putting forward ballot measures for this November’s election to approve new local funding.

tracking state policy funding featuredOur state policy bill tracker is the best way to keep tabs on the most current information about these states attempting to raise new funding in 2016, states attempting to reform how those dollars are spent and states taking unfortunate steps in the wrong direction on policy — all tracked in three separate searchable, sortable tables of that information.

In addition, our hub for state policy and funding related resources includes all past and current reports, bill trackers, and other state-focused resources.

STATE FUNDING

New Jersey faces perhaps the worst transportation funding crisis in the country with a trust fund that is bankrupt. Transportation funds will be shut off completely on July 1st unless state leaders find new funding.

Legislative leaders are reportedly developing a “tax fairness plan” that would raise new revenue for transportation and cut other state taxes. Negotiating a package that will pass the assembly and senate with bipartisan, veto-proof supermajorities would sidestep Gov. Chris Christie (R), who has not supported any new revenues for transportation. In fact, the governor and transportation commissioner have downplayed the crisis and put the obligation on the legislature to find new revenue.

A tax agreement would likely include income tax deductions and a reduction of the estate tax, resulting in cuts to the general state budget, while a fuel tax or other new revenue would add to the state’s Transportation Trust Fund. Another possible funding source under consideration is adding new tolls on highways that are now free.

The state has the second lowest gas tax in the country and $30 billion in outstanding debt from past transportation projects. As a result, 100% of the dollars collected through the gas tax go to cover debt on past projects. The Transportation Trust Fund will run dry when it reaches a borrowing limit on June 30th.

Democrats are pushing for $2 billion in annual transportation spending; Republicans are looking for $1.6 billion annually, the average amount of state funding each of the last five years. The state’s transportation needs — especially the need for expanded transit service — are growing. The population around rail transit stations in the state is booming.

Illinois Senate President John Cullerton (D-Chicago) proposed a per-mile driving charge (SB 3267) as an alternative to the state’s per-gallon fuel tax. Though after receiving feedback he says he will not move forward with the proposal.

There’s been little visible progress toward any sort of agreement on transportation funding in Minnesota, and other policy and budget issues stand in the way of a bipartisan agreement.  A bill (SF3211) introduced in the senate by Sen. Vicki Jensen (DFL-Owatonna) would direct the state DOT to develop a new, objective process to score and select projects. Moving in this direction could help steer the limited funds to the best projects while also building up public support for additional transportation funding.

The Colorado House passed a bill (HB1420) 39-26 to make budget changes that would allow additional state funds to flow to transportation. The bill faces an uncertain future in the Republican-controlled Senate.

The Oregon Legislature has named a new, special, bicameral, bipartisan study committee to develop a transportation funding package. The committee will begin regularly holding public meetings in May. This is a big improvement in transparency from the closed-door negotiation that resulted in a dead-end transportation funding proposal last year.

LOCAL FUNDING

Sacramento County, California, is moving ahead with a $3.6 billion, 30-year local sales tax. A deal struck by the Sacramento Transportation Authority will split these funds, with 70 percent going toward highways and streets and 30 percent toward transit. The county transit agency had reportedly anticipated as much as half of the new funding. In the first five years, three-quarters of the local road money would be used exclusively for repairing city streets. The proposal will need to be approved by the county board this summer and then supported by two-thirds of county voters in the November election.

We’ll see the results when we are in Sacramento November 16-17 for Transportation for America’s Capital Ideas state policy conference. Which reminds us…

Registration is now open for Capital Ideas, the premier conference on state transportation funding and policy, coming up this November 16-17, 2016, in Sacramento, CA. Sign up today to secure your seat and grab one of the limited number of discounted hotel rooms available.

As Sound Transit, the transit agency for metro Seattle, Washington, finalizes a $50 billion local funding plan to go before voters in November, free parking has become a major point of contention. The plan initially called for thousands of free parking spaces alongside new transit lines, but local leaders are calling for more housing and business development alongside transit stops, instead. Spokane-area voters will decide on a major expansion of transit service and the addition of a new bus rapid transit line at the ballot this November. Voters will consider a 0.1 percent sales tax increase in April 2017 with a second 0.1 increase to follow two years later and both running through 2028.

The county commission in Hillsborough County, Florida (which includes Tampa) voted 4-3 against putting a transportation sales tax measure on the November ballot. The long-debated measure would have raised new funding for highways and transit.


Stay up to date on all progress with state transportation funding and policy issues with our bill tracker.

What can other states learn from California’s shift to better measure how streets move people

In 2013, the State of California passed legislation that makes a dramatic change in how the state measures the performance of their streets. Rather than use the traditional level of service (LOS) measure that focuses far too narrowly on moving as many cars as fast as possible — regardless of the context or needs of a street — California’s Office of Planning and Research (OPR) is shifting to an alternative of measuring vehicle-miles traveled (VMT).

In this first post of a six-post series only for T4America members, Transportation for America will walk through the change from LOS to VMT, highlight the opinions of a variety of leaders on this issue and discuss the implications for California’s transportation system and potential implications nationwide.

Reminder, moving away from level of service (LOS) was one of the key recommendations in our new state policy report, released in January 2016. Don't miss that helpful resource.

Note: moving away from level of service (LOS) was one of the key recommendations detailed in our new state policy report, released in January 2016. Don’t miss that helpful resource.

In 2013, Governor Jerry Brown signed into law SB 743, eliminating the use of LOS for projects within designated transit priority areas (TPAs). As Streetsblog LA reported in 2013, SB 743 was a compromise between interests who wanted the full elimination of LOS in California and advocates pushing for the full and immediate elimination of LOS as a requirement for any project. But, because most urban areas fall within the state-defined parameters of a TPA, the enactment of SB 743 means that LOS is largely eliminated for urban projects.

Additionally, SB 743 authorized Governor Brown to develop a new way of measuring traffic impacts of major projects statewide and based the new way on total VMT rather than intersection congestion. (1) This will change how development projects are analyzed and scored in traffic impact studies and thus the type of development projects that California supports.

What this means

In short, instead of measuring whether or not a proposed project will make it less convenient to drive, (CalTrans) will now measure whether or not a project contributes to other state goals, like reducing greenhouse gas emissions, developing multimodal transportation, preserving open spaces, and promoting diverse land uses and infill development. (2) It is expected that this change will make it easier to build transit projects, as well as bicycle and pedestrian-friendly infrastructure.

But perhaps a larger change will be the type of development the law now encourages. Instead of encouraging sprawl that goes against California’s own environmental goals, these new guidelines will encourage development that moves California to a more sustainable transportation system. (3)

Status of Draft Guidelines

In August 2014, OPR released draft guidelines proposing to substitute VMT for the LOS metric (as authorized by SB 743). Under the draft guidelines, California no longer considers bad LOS a problem that needs fixing under the California Environmental Quality Act (CEQA). (4)

On January 20th 2016, OPR released the final draft of the changes to CEQA. The January 20th release signals the 45-day initial public comment period before finalizing the proposal and submitting to the California Natural Resources Agency to begin the formal rulemaking process under the Administrative Procedure Act. The regulations are anticipated to be effective statewide in 2019. (5)

Final Guidelines

The final guidelines are very similar to the draft guidelines with only slight changes. In the final proposal, OPR continues to recommend replacing LOS with VMT as the primary metric for analyzing a project’s transportation impacts, including the presumption that projects near transit (1/2 mile or less) should be presumed to cause a less than significant transportation impact and that transportation projects which add lane miles may result in induced vehicle travel. (6) In a big win for smart growth advocates, the guidelines emphasize that effects on automobile delay do not constitute a significant environmental impact. (7)

The new guidelines would remain optional for a two-year period following adoption, but would apply statewide to all development projects by 2019. (8)

Draft Guideline Rules on Impact Analysis

The final guidelines contain significant changes on the types of triggers needed to spur an environmental impact statement. Divided into three categories; land use projects, residential projects and office projects, all triggers are established at below a commonly accepted baseline level. The new proposal attempts to streamline the implemention of SB 743, with recommendations regarding significance thresholds, for required traffic analyses of development projects. (9)

These new threshold guidelines mean that development projects that will significantly increase the amount of automobile traffic that will be required to undergo rigorous environmental impact statements to ensure that they are compliant with California’s statewide greenhouse gas law.

Citations:

  1. Newton, D. and Curry, M. (2014, August 7th). California Has Officially Ditched Car-Centric ‘Level of Service’. LA Streetsblog. Retrieved February 1st from /http://la.streetsblog.org/2014/08/07/california-has-officially-ditched-car-centric-level-of-service/
  2. Newton, D. (2016, January 22nd). State Releases Proposed Rules That Would Finally End LOS in Enviro. Law. Streetsblog California. Retrieved February 1st from http://cal.streetsblog.org/2016/01/22/state-releases-proposed-rules-that-would-finally-end-los-in-environmental-law/
  3. Ibid 2
  4. Ibid 2
  5. Ibid 3
  6. Lathom and Watkins LLP. (2016, January 26th). California Governor’s Office Releases Updated CEQA Guidelines Proposal on SB 743 Implementation. Retreived 2016/2/01 from http://www.lexology.com/library/detail.aspx?g=b070fa40-a4ff-4ce1-a6db-f2bd104cce31
  7. Ibid 5
  8. Ibid 5
  9. Ibid 5

The Senate’s multi-year transportation bill misses the mark on multimodal freight

Below is an in-depth explanation of one of the 10 things you need to know about the Senate’s DRIVE Act.

The Senate’s multi-year transportation bill recognizes that efficient freight movement is important, but the bill prioritizes freight moving on highways over that moving by rail, air, ports and pipelines.

The DRIVE Act (HR 22) is unique from past transportation bills in that it creates a program for freight. The bill includes almost $1 billion for freight in its first year and up to $2.5 billion toward the end of the authorization in 2021. (The bill was more robust when originally introduced in the Senate Environment and Public Works Committee, providing $2 billion in the first year and rising to $2.5 billion. It was scaled back to a smaller cost when some of the DRIVE Act’s “pay-fors” were deemed too controversial).

The program features a comprehensive and thoughtful national- and state-level planning framework to analyze the condition and performance of the national freight transportation system.  It would require states to identify priority projects for improving freight movement regardless of mode – including rail, seaports, pipelines and airports. Yet the program restricts the majority of funds to highway projects. Only 10 percent of the money it provides to states can go to other modes.

This funding model would fall far short of the costs of multimodal freight projects. California, for example, would be allocated $90 million under this program in 2016, only $9 million of which could be used for non-highway projects. The Port of Los Angeles’s West Basin Railyard project – a rail and port project – costs $137.7 million.

Similarly, Illinois would have less than $4 million available. Chicago’s CREATE program – one of the most significant freight projects in the nation, which would improve rail freight efficiency throughout much of the country – costs over $3 billion.

This restriction seems burdensome, particularly since the new program would be paid for out of the general fund, not by roadway users. Congress has taken funding from across the board and restricted it to highway projects, even if a state says that its priorities for freight are elsewhere.

Also troubling is the fact that the National Freight Program’s funding would be distributed among the states evenly, using a formula that ignores where freight volumes are highest or where goods get stuck in congestion or bottlenecks. It’s the equivalent of investing wildfire prevention dollars in all 50 states even though a majority of fires are in the dry, arid west.

Reducing the country’s freight bottlenecks and helping businesses efficiently move commerce is a worthwhile goal, and one that can only be achieved with a truly multimodal freight program. When the House takes up their transportation bill in the early fall, we hope they rethink the DRIVE Act’s distribution formula and the restrictive funding cap on non-highway projects to ensure this program lives up the goals outlined for the National Freight Program.

As many states close out their legislative sessions, the latest intel on state transportation funding

As we near the midpoint of the year and some state legislatures wrap up their sessions or approach recess, it’s a good time to take a look at where a few states stand on their efforts to raise new transportation funding.

In the only state to raise new money since our last update, Nebraska’s legislature passed and then overrode Republican Gov. Pete Ricketts’ veto (30-16) of a 6-cents-per-gallon gas tax increase, to be phased in over the next four years. The additional tax will annually bring in $25 million for state roads and $51 million to be distributed to cities and counties when fully implemented.

Follow state transportation funding updates for every state as they happen with T4America's state funding tracker.

Follow state transportation funding updates for every state as they happen with T4America’s state funding tracker.

A handful of states have been searching for ways to improve transparency and accountability as a first step to raising new funding. In Louisiana, the House and Senate unanimously passed a bill in May that reforms the way the state DOT prioritizes and selects highway projects in an effort to provide greater transparency to the process. This strong piece of legislation was introduced and advanced by a member of T4A’s state advocacy network (START), House Speaker Pro Tempore Walt Leger.

(We hope to go into more detail soon on this trend of states either reforming their project selection process or expanding the use of performance measures, so stay tuned for that. -Ed.)

Additional bills that would raise gas and general sales taxes to fund transportation projects have cleared committee, though a bill to raise the state sales tax by one cent to fund major projects just fell short of the two-thirds majority it needed to pass the House last week.

Some other states are still active in their legislative sessions with transportation funding proposals on the docket, while a handful of others have failed to pass a package during this session.

California’s Senate is considering a bill that would hike the state gas tax by 10-cents-per-gallon (and the diesel tax by 12-cents-per-gallon), increase the vehicle tax to 1 percent of the value of the vehicle, increase registration fees by $35, and add a new $100 annual fee on electric vehicles.

Projections show the bill would bring in more than $4 billion annually. The bill has been cleared out of multiple senate committees. It requires a two-thirds supermajority to pass.

Just a year after Texas voters overwhelmingly approved a separate measure to set aside a portion of oil and gas royalties explicitly for highways, legislators in Texas have reached a deal that will direct a greater share of future state sales tax revenue to transportation. Specifically, $2.5 billion of the state sales tax revenue will be reserved for transportation, so long as overall sales tax receipts are at least $28 billion (approximately the collections this year). Additionally, 35% of revenue growth from taxes on vehicle sales and rentals will be set aside for transportation beginning in 2020, netting $250 million to $350 million annually.

The House and Senate have both passed the bill, and now it will need approval from Texas voters in November.

In Delaware, Gov. Markell is urging legislators to pass a $25 million annual increase in transportation funding through increased vehicle fees.

Minnesota’s legislature adjourned without reaching an agreement on how to increase funding for transportation and passed a status-quo budget instead. But with a special legislative session looming, there’s a possibility that legislators will have another opportunity to reach an agreement on new funding.

Similarly, Missouri failed to pass a transportation funding measure. The legislature had debated a 2-cent-per-gallon gas tax increase, but adjourned without passing the measure. According to that state’s DOT, legislators must come up with new state funding in their next session or the state will not have adequate money to match federal transportation dollars, leaving federal money on the table.

In Oregon, legislative negotiations over new transportation funding seem to have ground to a halt.

But Oregon is on the leading edge of testing a new mechanism for funding transportation that could serve as a model for the rest of the country, shifting away from a per-gallon tax to a tax on miles traveled. This month the state started enrolling 5,000 drivers into its new (voluntary for now) road usage charge program called OReGO. The new road usage charge program officially began Tuesday.

Transportation Vote 2012: San Diego mayoral candidates indicate strong commitment to investing in transportation options in a televised debate

In San Diego, a region facing significant growth on a congested transportation system, the two mayoral candidates signaled their commitment to expanding transportation options throughout the region in the years to come — but shrinking transportation funding will test that commitment.

This post is one of our Transportation Vote 2012 series, looking at the role of transportation in local and state elections this fall.

Like most other metro areas across the country San Diego is facing major transportation challenges. Over the next 40 years the region’s population is expected to grow by 1.3 million, 42 percent, with the city itself absorbing half of that increase.

With regional freeways and roads already straining to deal with the congestion that threatens economic competitiveness, health, and quality of life, San Diegans need and are demanding more and better options for getting around where they need to go day-to-day. While the city is making plans to significantly expand their public transportation systems and invest in making streets safer for walking and biking, the limited transportation funding available in the years to come will test its leaders’ commitment to prioritizing these investments over more of the status quo.

And just who that leader will be is a decision voters will make this election season.

Last week in San Diego, Transportation for America partners Move San Diego, WalkSanDiego, and the San Diego County Bicycle Coalition held a mayoral debate titled “Walk Bike Move Live” between the two candidates for mayor. Congressman Bob Filner and San Diego City Councilman Carl DeMaio, both put forth their visions for improving transportation and quality of life in San Diego.

“We want San Diego residents to know the candidates’ plans on how to improve transportation alternatives that support smart growth, and what those plans are for improving our environment, the local economy and preserving and enhancing the quality of life that defines America’s Finest City”, said Elyse Lowe, Executive Director of Move San Diego.

Though accelerating public transportation improvements were emphasized, most of the energy of the debate focused on how to make San Diego one of the most bikeable and walkable cities in the country.

Both candidates stressed their commitment to making San Diego’s communities safer for biking and walking with Councilman DeMaio saying it is in an investment in making the city more competitive, creating jobs, and “the San Diego way of life.”

Congressman Filner stressed that this would be one of his top priorities and that he sees San Diego’s future as a “city of villages” connected by walkable and bikeable streets that promote the arts, community, and the economy.

Biking and walking are gaining significant traction as transportation options in San Diego. The regional transportation planning organization SANDAG is planning to invest more than $3.5 billion in bicycle and pedestrian infrastructure by 2050. This investment will make streets safer as more people travel by foot and bicycle and enhance access to transit, jobs, and housing while reducing the cost of transportation.

“Making our communities more walkable is one of the best ways to make the San Diego region a better place to live”, said Jim Stone, Executive Director of WalkSanDiego. “Walkable neighborhoods lead to healthier people, lower healthcare costs, higher real estate values, better retail sales, less air pollution, and an improved quality of life. Walkability is a winning proposition.”

Even as both candidates repeatedly trumpeted their commitment to this approach — certainly easy to do in debates typically long on promises and short on specifics — questions remain as to how they’ll achieve this vision given the fiscal realities facing cities today and in the days to come.

The federal programs that fund the majority of bicycle and pedestrian projects was significantly cut in the recently passed federal transportation bill, (MAP-21) and state revenues for transportation funding have remained flat and sometimes decreased.

“The San Diego County Bicycle Coalition is looking for a bold leader who will commit to join us in our quest to become the nation’s most bicycle friendly city”, said Andy Hanshaw, Executive Director of the San Diego County Bicycle Coalition.

“Working together we can change the way we think and get around by taking the initiative to provide safe and accessible bike connections throughout our city.”

You can watch a full video of the debate below.

New York Times: High-speed rail deserves continued support

Originally uploaded by pgengler to Flickr.

The New York Times resolutely defended high-speed rail in an editorial this morning, characterizing the elimination of remaining funds for the program this fiscal year as “harebrained.”

The budget deal reached by the White House and Congress zeroed-out the $1 billion allocated for high-speed rail in fiscal year 2011 and rescinded an additional $400 million that had been returned by Florida Governor Rick Scott. A previous agreement to keep the government running for an additional week had already included $1.5 billion in cuts.

Governor Scott weathered heavy criticism for rejecting the funds, including from fellow Republicans, and his administration has since acknowledged getting key facts about the project wrong in a presentation to the state Supreme Court.

The Times strongly opposed Scott’s decision, but noted that his action has enabled other interested governors, including 11 Republicans, to put in bids. Transportation Secretary Ray LaHood has 90 proposals from 24 states to choose from, with a total price tag of $10 billion, and a total of $2.4 billion to distribute. The Times wrote:

Two areas stand out on that list: the Northeast corridor from Boston to Washington; and California, which has ambitions to build a high-speed rail system from San Francisco and Sacramento to San Diego. California voters have approved almost $10 billion in bonds for the project (which has an ultimate price tag of some $45 billion), but the state wants the $2 billion for an extension.

While supportive of California’s efforts, the Times would like to see Amtrak’s application for an upgrade to the Northeast corridor’s Acela line receive top priority. Their $1.3 billion request would boost Acela’s speed from 135 miles per hour to 160 miles per hour between Philadelphia and New York City, one of the busiest and most popular stretches in the country. And, New York submitted an application to clear a path for Acela through New York City’s Penn Station, which more than 750 trains pass through daily.

USDOT has not yet announced when recipients will be selected.

California needs smart station planning to maximize high-speed rail’s benefits

This is a projected image of the area around the Sacramento station, courtesy of the California High-Speed Rail Authority.

High-speed rail investment has the potential to yield great economic and environmental rewards for California, but only if communities make smart decisions about land-use and growth at and around new stations.

A new report prepared by the San Francisco Planning and Urban Research Association offers prescriptions for how communities can prepare for rail investments.

“The new statewide rail system presents a once-in-a-century opportunity to reshape their local economies and set the course for more compact, less automobile-dependent growth,” according to the report.

The first leg of California’s high-speed rail is the backbone of the system through the state’s Central Valley, including population-rich Bakersfield and Fresno. Once all 26 stations have been completed, the system will reach northward to Sacramento and include service from San Francisco to Los Angeles and further southward to San Diego.

The benefits are plentiful. For starters, by shortening travel time between successful metro areas, high-speed rail brings geographically distant focal points closer, connecting more people to opportunities and jobs. The new stations and ease of travel can also revitalize downtowns, bring economic opportunity to low-income communities and reduce suburban sprawl.

By providing a viable alternative to the car — and, in the case of longer journeys, to energy-intensive air travel — high-speed rail is also a terrific means of reducing greenhouse gas emissions and assisting California in meeting the targets of its groundbreaking climate change law, AB 32.

But each of these potential benefits comes with a cautionary tale. The BART system in the San Francisco Bay Area, for instance, was intended to fuel compact and transit-oriented development, but many of the more suburban stations were surrounded by parking lots and built away from town centers, missing the opportunity to add ridership by building up those areas or spurring new walkable centers. Similarly, most of California’s airports are surrounded by parking lots and access roads, making nearby development less desirable. Policymakers must make a concerted effort to avoid a similar fate near high-speed rail stations and be willing to prioritize growth in strategic areas.

The station sites face myriad challenges and opportunities. Some, like San Francisco and Sacramento already have traditional downtowns, while San Jose and Anaheim have emerging downtowns with the potential for growth. Stockton, Merced, Fresno and Bakersfield have downtowns as well, but struggle with high unemployment and a lack of private sector investment. Reconciling rail with more traditional suburbs and major airports will be the focus at other stations.

SPUR offers ten recommendations for planning preparation, which include:

  • Developing station area plans for each high-speed rail station area
  • Drafting statewide station area planning and development guidelines to inform local decision-makers
  • Drafting a statewide implementation plan
  • Providing financial support for local planning as needed
  • And, establishing local development corporations to facilitate local area development

To see the rest of SPUR’s recommendations and the entire report, you can visit their website here.

American Lung Association: smart growth saves lives, improves health

Photo courtesy of Compass Blueprint

There are many reasons smarter growth makes sense. By building more sustainably and closer to where people work and shop and plan, we reduce hours stuck in traffic and make it easier to reach life’s necessities.

But there is something even more important at stake: our health. According to new data from the American Lung Association in California, smart growth policies can prevent 140 premature deaths and 105,500 asthma attacks every year in that state. The figures resulted from looking at a proposed 2035 planning scenario for California that prioritized more compact and sustainable development with better transportation options.

Changing how we build and plan would also relieve our communities of $1.66 billion in public health costs. It would also prevent:

•    260 heart attacks
•    215 acute bronchitis incidents
•    95 cases of chronic bronchitis
•    2,370 asthma attacks
•    101,960 other respiratory symptoms
•    205 respiratory ER trips and hospitalizations
•    16,550 lost work days
•    132,190 tons of criteria pollutants

Chelsea Allinger discussed the link between smart growth and active living over at Smart Growth America:

Like many Americans, I grew up knowing only one type of community design — drivable suburbia. In my community, exercise wasn’t something that happened naturally over the course of the day. It required carving out designated time slots from a crowded schedule.

Frankly, that didn’t happen as often as it should.

Since that time, I’ve learned that cultivating a more active lifestyle doesn’t have to mean finding a 25th hour in the day. Moving to a walkable, mixed-use, smart growth community quite literally changed my life — with, as it turns out, more significant health benefits than I’d initially realized.

Here is Dr. Sonal Patel in Capitol Weekly, discussing why many of her colleagues in health care also see the connection:

Most California cities were designed to make it easy to drive and park cars. Homes were separated from stores, workplaces and other commercial activities. The unwitting result was sprawling cities that maximize the amount of miles we drive and the time we sit idling in traffic and that minimize healthier options like walking, biking or public transit.

In the past decade, California has been on the cutting-edge of efforts to build more sustainably and closer to transit. In 2008, Governor Arnold Schwarzenegger signed SB 375, which required local communities to include greenhouse gas reduction targets in their land-use and transportation planning policies.

LA residents rally for transit, jobs and an economic boost for region

Thousands rallied last Friday at the Los Angeles City Hall in support of the jobs that could be created by a visionary program to fast track a slate of planned public transportation projects — if the federal government will do what’s necessary to help a metro area that’s helping itself.

At the rally, Transportation for America’s deputy director Lea Schuster stood shoulder-to-shoulder with prominent labor leaders and California lawmakers to tell Washington to help speed up the 30/10 Plan – a plan to build 12 major local transit projects in 10 years rather than 30. The plan would spur economic growth and protect the environment, create 166,000 jobs, ease congestion, and reduce air pollution and dependency on oil.

LA Labor Rally Denny: Lea Originally uploaded by Transportation for America to Flickr.
Move LA’s Denny Zane speaks at the podium, flanked on his right by T4 deputy director Lea Schuster, holding the Move LA banner touting the 30/10 plan for the LA metro area.

If Congress establishes the programs needed to move 30/10 forward, cities and regions around the country that have local transportation tax measures could receive up-front loans from the federal government to speed the construction of vital public transportation projects and programs. Fast-tracking the projects and speeding up the timetable would save millions in escalating material costs, while creating thousands of new jobs in the short run. Guaranteed and preapproved local tax revenues would then be used to repay the loans.

In the case of Los Angeles, voters approved a measure at the ballot box (Measure R) to tax themselves for 30 years to pay for transportation. Implementing 30/10 would allow them to get the money up front to build 12 projects over 10 years and pay back the loans over 30 years.

Speakers supporting the effort to establish the federal lending programs included Senator Barbara Boxer, AFL-CIO President Rich Trumka, Los Angeles Mayor Antonio Villaraigosa, LA County Federation of Labor leader Maria Elena Durazo, and Move LA’s Denny Zane.

All the speakers cited 30/10 as a job creating and environmentally progressive transportation model for the rest of the country. As Senator Boxer said, “We know if we do embrace this notion of 30/10, we will create thousands of good-paying union jobs and we will reduce our billion-dollar-a-day addiction to foreign oil.”

LA area Representatives Jane Harman and Judy Chu both stated their support for the initiative with Jane Harman declaring, “30/10”’ will be my number one priority in Congress. And LA labor leader Richard Slawson hailed it as “our stimulus package.”

As roads, freeways and bridges have grown increasingly congested and fallen into a state of disrepair and federal transportation funds have become scarce, taxpayers in communities across the country have voted to tax themselves to raise money for long-term transportation programs to expand public transportation and fix aging infrastructure — proving again that Americans will increase their own taxes to pay for transportation if they know what their taxes are buying.

As with 30/10, well-planned transportation programs can provide the immediate economic stimulus needed to put people back to work and provide safe, clean, and affordable transportation options.

As Denny Zane, Executive Director of Move LA and one of the founders of the 30/10 Plan stated, getting the legislation needed to establish the federal lending programs to provide the upfront loans will take a national effort, a national coalition, and national leaders. He cited the success of Transportation for America and its leadership in putting together a coalition of more than 500 organizations and elected officials fighting for federal transportation reform as performing the “type of work that we need” and being the campaign that will “help put the votes together” to establish the programs to ensure that the 30/10 Plan and other initiatives like it become a reality.

“I don’t know what this talk around DC is about livability not having anything to do with rural areas…”

Earlier this week, we hosted 15 of our partners from rural areas across America for a two day “fly-in” focusing on the transportation needs of rural areas and small towns. We hosted a briefing at the Capitol in the morning and then these partners from all over the country, from Virginia to California, took the message up to their leaders in Congress through dozens of meetings with legislative staff or Senators and Representatives themselves.

Kathy Moxon, the director of Redwood Coast Rural Action in (extreme) northern California, a participant and speaker at the briefing, took a few moments in between meetings at the Capitol to talk to T4 America about this idea of “livability” in rural areas that some in Congress have been questioning.

We wanted to know more about the view from rural northern California — is livability a rural value?

We’d like to thank Kathy for coming to D.C and participating in the fly-in and giving us a few minutes of her time.

Bay Area bridge shutdown puts transportation network in the spotlight

San_Francisco-Bay_Bridge01
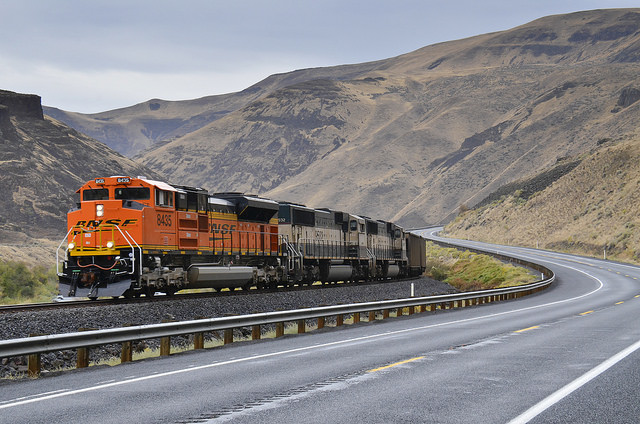
Even in the San Francisco Bay Area, a renowned transit hub with higher than average rates of walking, biking and transit ridership, more than 280,000 vehicles cross the San Francisco-Oakland Bay Bridge every day. It’s a critical artery connecting downtown San Francisco with the thousands of residents who live in Oakland and the surrounding suburbs.

It is thus understandable that panic ensued after a part snapped off in high winds and fell onto the roadway, resulting in a complete shutdown of the Bay Bridge early Tuesday. Thankfully, though at least two vehicles either ran into or hit the fallen part, no injuries resulted. As of this morning, the bridge remains closed without a date certain for re-opening.

The Bay Bridge was last closed down over Labor Day weekend, during which engineers discovered an unexpected crack. This structural flaw nearly delayed the bridge from reopening on-time, but crews received the needed materials in just enough time for the post-weekend morning commute.

It was one of those last minute repair pieces that broke off Tuesday, although engineers could not say whether the Labor Day rush had anything to do with it. Heavy winds are another potential culprit — hardly an uncommon occurrence in the Bay Area, however.

Once the bridge was closed, the immediate focus shifted to the Wednesday morning commute. Prognosticators were predicting mass chaos and never-ending gridlock as far as the eye could see on Wednesday morning.

Officials with the BART subway system arranged for extra train cars and personnel to accommodate the expected surge in passengers, leading to a record day of ridership that crushed the previous high water mark. Ferry agencies across the Bay ramped up service and Amtrak is providing a shuttle. MUNI, AC Transit, and other local agencies also stepped up rates of service and frequency to meet the demand.

“When the Bay Bridge closed we saw a 49 percent spike in transit use. Thank goodness we had that transit option there.”
Federal Transit Adminstration Administrator Peter Rogoff today at the Rail~Volution Conference

Despite similar predictions of chaos and gridlock, commuters, transit agencies and officials effectively coped with the collapse of a major overpass near the Bay Bridge in April 2007. Many drivers quickly developed alternate routes or shifted their schedule, BART was effective at expanding capacity and major thoroughfares were crowded, but not gridlocked.

Media accounts accounts for this week indicate Bay Area officials have handled the shutdown relatively smoothly, especially considering how many vehicles use this bridge every day. BART trains were filled to capacity and the Richmond-San Rafael and San Mateo-Hayward bridges — both adjacent to the Bay Bridge — were jammed with cars but still moving, albeit at a sluggish pace.

As far as we can tell, California Department of Transportation officials have been responsive and responsible about safety and structural integrity. It is important they be given the time to get this right.

But even if the time crunch during Labor Day weekend did not contribute to the problem, it should be cause for concern. In too many transportation projects, safety is shelved in favor of speed and grandeur. Part of the Bay Area’s ability to cope is the investment they’ve made in a variety of transportation options and modes. Which begs the question, how would metropolitan areas that lack these alternatives fare if a similar incident occurred?

Diversity of options isn’t just about cutting emissions or reducing fuel consumption. A complete network is one that can continue functioning when a few parts go down. A city dependent completely on cars and interstates (or 1 or 2 transit lines) is a vulnerable city.

Across America, children, seniors, the disabled and people who do not or cannot drive are at risk due to unsafe streets and crumbling sidewalks. We cannot afford to spend untold billions on new projects if we cannot keep old ones from crumbling.  Including strong “fix-it first” language in the transportation bill re-authorization would ensure that existing roads and bridges get the upgrades they need to keep commuters and all users safe.

In addition, the Critical Asset Investment Program proposed in Chairman Oberstar’s transportation bill would create a substantial, dedicated funding stream for maintaining roads and bridges, preventing states from diverting those funds to more political popular highway expansion projects. This program would also require transit agencies to show how they are maintaining their systems and keeping them in “a state of good repair.”

The Bay Area will get through this. But the incident is a reminder that transportation policy cannot be a piecemeal, crisis-to-crisis endeavor.

Bay Area business leaders push the Senate for clean transportation

Carl Guardino 1 Originally uploaded by Transportation for America
Carl Guardino, president and CEO of the Silicon Valley Leadership Group, a T4 America partner, addresses a gathering at a recent reception hosted by T4 America that brought together administration officials and supporters.

An organization representing more than 300 elite Silicon Valley businesses from Apple to Yahoo! sent a letter last week to Senate Environment and Public Works Chairman Barbara Boxer, a California Democrat, urging her to make sure the Senate climate bill adequately invests in clean transportation alternatives to reduce emissions in their region while keeping it mobile and competitive.

The Silicon Valley Leadership Group, made up of mostly tech-focused organizations in Silicon Valley, works to enhance economic competitiveness and maintain a high quality of life for the region. SVLG members employ more than 250,000 people in the Valley and generate more than $1 trillion worth of business each year. (SVLG is a partner of Transportation for America.)

Started in the 1970’s by the founder of Hewlett Packard, they recognize that investments in transit and safe, accessible, walkable neighborhoods are keys to their continued economic success and ability to lure smart and talented workers to the region.

In the letter, president Carl Guardino thanked Chairman Boxer for her leadership on the issue of climate change, and pointed out that California will need to make a large investment in cleaner transportation options if they are going to have any chance of meeting the ambitious reductions proposed in the climate bill:

Transportation represents the fastest growing source of national greenhouse gas emissions (GHG), and the largest single source in California, accounting for 40% of emissions. In Silicon Valley and the Bay Area, that number is higher still – 51% of GHG’s.

House bill, H.R. 2454 (Waxman/Markey), recognizes the importance of reducing transportation emissions by requiring states and metropolitan areas adopt new planning requirements and GHG reduction goals. However, the bill provides virtually no allowances for this purpose. Without adequate funding to address transportation’s increasing contribution to climate change, we will not be able to rise and meet this challenge.

The debate over the Senate’s climate bill is expected to heat up in the next few days as Chairman Boxer’s Senate committee releases the numbers showing where the allocations from the Clean Energy Jobs and American Power Act will be directed.

Transportation for America, our 28,000 supporters and 350+ partners like SVLG have been calling on the Senate to direct 10 percent of the funding to clean transportation alternatives.

The Senate bill will require states and cities to reduce emissions from transportation. Giving them 5-10% of the revenues will give them the tools they need to make investments in clean transportation alternatives, like public transportation and passenger rail, affordable neighborhoods around transit stops and neighborhood projects that increase safety for cyclists and pedestrians.

Click the jump to read through the entire letter from the SVLG.

Silicon Valley Leadership Group logo (more…)

California Supreme Court hands victory to local transit riders and providers

OC busA recent California Supreme Court decision could restore billions in funding for public transportation in the nation’s most populous state.

The Court’s ruling late last week upheld a lower court decision declaring the state’s $3.6 billion raid of public transit funds illegal and ordered that the money be returned to local transit providers.

Two months ago, Transportation for America released “Stranded at the Station: The Impact of the Financial Crisis in Public Transportation,” illustrating the painful cuts transit systems have sustained at the state and local level. The cuts plateaued as unemployment reached 10 percent and Americans were demanding more transportation options, not less.

It is no secret that California has fallen hard as a result of the recession, but the severity of the cuts to public transportation in California was vastly disproportionate to the rest of the country. The reason for this was no mystery: the State was raiding dedicated transit funds every year in order to alleviate other budgetary shortfalls since 2007.

More than two dozen transit providers throughout the state enacted some combination of fee hikes and service reductions, according to our map of transit cutbacks. BART in the San Francisco Bay Area increased its base fare by 17 percent, and many transit systems in Southern California raised fares as much as 20 percent. The County Connection in suburban Contra Costa reduced its bus lines by 23 percent, and rural areas were hit hard as well. The California Transit Association, or CTA, an affiliation of local transit providers, logged 38 agencies facing cuts of some kind in their own version of our transit cuts map.

Last week’s state Supreme Court’s decision helps explain how things got this bad.

Since 2007, Gov. Arnold Schwarzenegger has successfully diverted $3.6 billion from the state’s transit fund to deficit reduction, prompting a lawsuit from the CTA to get the money back. The CTA argued that the raided funds came from gas tax revenues specifically designated for public transit. By refusing to review a lower-court decision in favor of the association, the high court effectively ruled Schwarzenegger’s raid illegal, ending the seizure of desperately-needed transit funds.

This is a huge victory and vindication for local transit providers. Randy Rentschler, director of the Bay Area Metropolitan Transportation Commission, told the San Francisco Chronicle, “everyone knows that the state’s in a budget crisis, but that crisis also exists in local governments in part because the state has taken transit money away from local entities.”

The case has broader implications for public transportation as well.

In tough budget years, Governor Schwarzenegger and the legislature are constantly looking for places to trim and local governments are an easy target. But money saved is not money earned, as local cuts tend to bite the state later through increased demand for social services and counties being unable to meet the basic needs of their citizens. The decision will hopefully lead to more caution.

Most importantly, California can no longer rob Peter to pay Paul.

But at this point, it remains unclear how much of the original $3.6 billion will be returned to the transit fund, and ultimately, to local providers to preserve vital service for riders. That money is desperately needed, not only because of the millions of Californians who rely on public transportation for their day-to-day mobility, but also because many communities are on the cusp of becoming success stories. Transportation for America’s “Stranded” report profiles how efforts in Sacramento, Orange and Contra Counties have already improved quality of life and relieved congestion, highlighting the need to keep up the support.

Does transportation have an impact on growing health care costs?

Albuquerque8 Originally uploaded by Transportation for America
Streets safe for walking and biking — especially streets that encourage incidental exercise by encouraging walking or biking — can help residents be more healthy, lowering the health care costs associated with obesity and inactivity.

With Congress directing their attention to the contentious debate over health care reform and how to pay for it, it seems that transportation has been relegated to the back burner. In the meantime, evidence is continuing to mount that transportation investments — what we build and where — have an enormous impact on our health and the financial bottom line of providing health care.

Last week the California Center for Public Health Advocacy (CCPHA) released The Economic Costs of Overweight, Obesity and Physical Inactivity Among California Adults. In a state making national headlines for its current budget crisis, the study found that (in 2006) “overweight, obesity and physical inactivity cost the state $41.2 billion – $21.0 billion for overweight and obesity, and $20.2 billion for physical inactivity.”

An even more shocking recent study found that the already-dangerous effects of air pollution are magnified for pregnant women living near busy roads.

According to this study from a team of researchers from the University of California, Irvine, exposure to traffic-generated air pollution during pregnancy increases the risk of preeclampsia and premature birth. The study examined over 80,000 birth records and found that the risk of the life-threatening condition preeclampsia increased 33% and the risk of premature birth rose 128% in women living closest to congested corridors.

Many other negative health effects from vehicle emissions, congestion and air pollution have already been documented — with low-income and minority populations typically experiencing the most harmful side effects due to where interstates and highways get built.

The CCPHA report on obesity included some concrete policy recommendations for improving public health, a few of which are connected to our transportation spending decisions.

  • Locate residential, commercial and office buildings close together so more residents can walk and bike to meet their daily needs
  • Build neighborhoods with safe and attractive parks and other places for recreational exercise
  • Create transportation corridors that support pedestrians and bicyclists

Including some realistic goals for improving public health in the transportation bill — one of T4 America’s six national transportation objectives for the bill — would be a great place to start. If we’re ever going to truly move away from a prescriptive health care model to a preventative model — saving us billions in health care costs — we’re going to have to address more than just the skyrocketing costs of treating illnesses and diseases — we’re going to have to look upstream and address some of the contributing factors.

Doing so could keep us healthier and save us billions.

With research from Becca Homa