Telling only half the story of congestion, travel time and the quality of our metro areas
A popular study on traffic and congestion in our metropolitan areas is widely cited by the national, state and local media with every annual release, but it doesn’t tell the entire story. Far from it. That’s because measuring congestion while ignoring the actual time and distance spent commuting is a poor measure of what residents’ actually experience on a day-to-day basis.
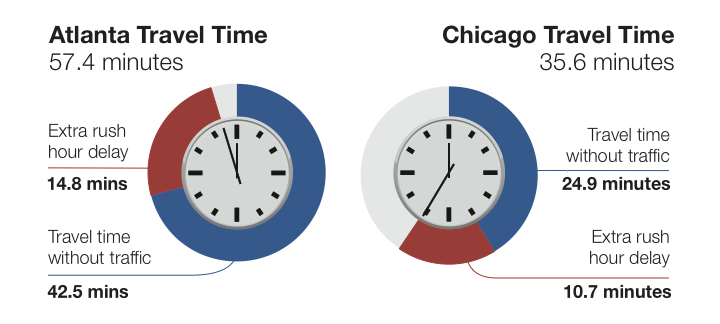
The popular and oft-cited Texas Transportation Institute’s annual Urban Mobility Report isn’t an incorrect metric, it just tells half of the story. For starters, let’s consider two metros that appear to be ranked pretty close together in the latest report out today. Atlanta and Chicago appear to both be pretty miserable in regards to congestion, right? According to the 2012 Travel Time Index (pdf), they’re near the top with TTI scores of 1.24 and 1.25 respectively, and tied for seventh in yearly delay per commuter. (In 2009, Chicago’s TTI was 1.43 – 23% worse than Atlanta’s 1.35.)
That must mean that the commute is just as bad in both of these areas, right? Well, no.
These statistics are from 2007, due to a limitation with how we can break down the TTI data.
Take an informal poll of your friends and co-workers: Who wouldn’t agree that a 35-minute commute is better than a 57-minute commute? Then why do we rely on measuring performance in a way that says the exact opposite? The TTI is almost the exact same for these two metros now, yet Chicago commuters had an average travel time of almost twenty minutes less than their counterparts in Atlanta a few years ago. That’s because TTI focuses only on how fast we can drive at peak while ignoring how far apart the destinations are in these two places.
In Chicago, the average trip to work is 35.6 minutes – 38% less time than the 57.4 minutes it takes Atlantans to drive to work. A major reason for the better highway performance in Chicago is that drivers do not have to travel as far as drivers in Atlanta – 13.5 miles compared with 21.6 miles. The amount of time it takes to go somewhere isn?t just about speed, that’s only half of it — it?s influenced both by how fast you travel and the distance you have to travel. Chicago and Atlanta are different places, so what about comparing an apple to an apple?
Denver, Colorado (8th worst TTI in 2012) has experienced a rebirth in its city core in the last decade or two, with residents flocking to new apartments and homes in the city center and close-in neighborhoods, attracted in part by the huge investment in regional transit. More people live near transit today in Denver than years ago, and with accompanying investments in new housing and jobs near transit and in more walkable neighborhoods, that means more people have shorter trips to get to work each day. Yet TTI shows that commuting in Denver is far worse in 2007 than it was 25 years ago. (TTI in 2012 is 1.27)
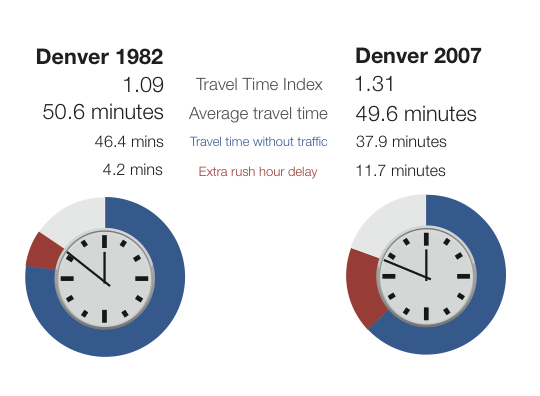
Look at the average travel time in 2007 in Denver compared to 25 years ago — it’s about the same. Rush hour delays have almost tripled, but the travel time without traffic (a good proxy for the average length of trips) actually decreased by almost ten minutes. Destinations are closer. Residents have more options. Commuters take shorter trips.
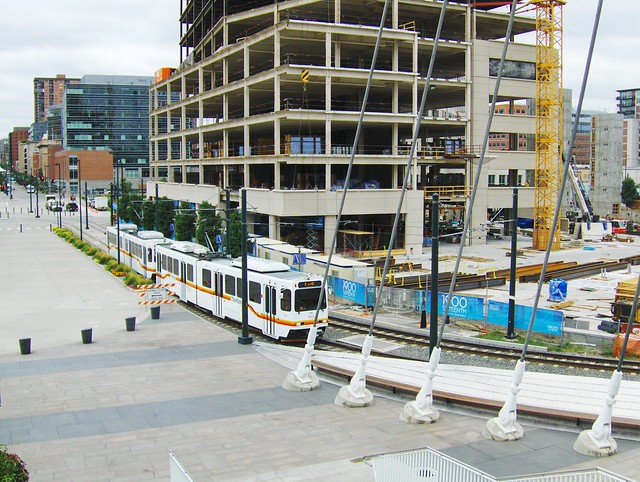
Denver downtown construction near light rail. Creative Commons Flickr photo by vxla ***
Relying solely on TTI to try and measure congestion and travel time in your city is like measuring only measuring two dimensions of a three-dimensional object. Like measuring the length and height of a new couch for your living room while ignoring the depth. The couch is 48 inches tall, but without measuring the depth, do you have any idea if it’ll fit through your front door?
This gets at the core problem with TTI — when cities and regions (or the USDOT) rely solely on TTI as the single measure of congestion and make all their decisions about future transportation investments based on only part of the whole picture, regions prioritize projects to reduce TTI or shave a few seconds off of rush hour delay.
Legislators, the Federal Highway Administration, state DOTs, and newspapers all use the Travel Time Index to measure highway performance. Then we spend millions or billions to build projects that lower this number, but we rarely get to work in less time.
As the nation shifts to a performance-based transportation system — beginning under MAP-21 — it is key that the first national performance measures get this right. Any national performance measure needs to allow communities to consider both factors — speed and distance.
There’s probably a handful of federal, state or local legislators looking at the headlines in their local newspaper today about congestion in their metro region. Maybe they’re saying “we’ve got to do something about this!” We need to do “something” — they’re right! But accurately measuring the problem is the only way to find an appropriate solution.
Let’s start there.
Our three principles

It’s past time to elevate the national conversation about infrastructure.
Learn more about our platformLatest From The Blog

Five for ’25: What to expect on transportation…
Dec 11th, 2024

Meeting the moment after the 2024 elections
Nov 27th, 2024


A pause for TransportationCamp DC
Nov 19th, 2024

I cannot find the zoom link, I registered…
Jan 6th, 2024

A rare look behind the curtain of Transportation…
Jul 28th, 2023

In what Harrison Ford said was his most…
Jul 25th, 2023

Good example, walking to the local taco place…
Jul 24th, 2023