
Will pending federal transportation rule double down on outdated view of congestion?

USDOT is on the cusp of releasing crucial directions for how states and metro areas will have to measure traffic congestion. The new rule could push local communities to try in vain to build their way out of congestion, or mark a shift toward smarter approaches like shortening trip times, rewarding communities that provide more options or better accounting for other travel modes and telecommuting.

Updated: The rule is out — read our more detailed post on ten things you should know about it, and take action by sending a letter to USDOT.

Friday Night Lights

Thanks to new requirements in the 2012 transportation law (MAP-21), USDOT is working to establish a new system of performance measures to help govern how federal dollars are spent and hold states and metro areas accountable for making progress on important goals. For two years, USDOT has been slowly developing, releasing and then refining new metrics for safety and state of good repair for highways and bridges. And any day now, they’re expected to release the final highway rule that will cover traffic congestion, air emissions, freight movement and system performance.

How we measure traffic congestion matters

While all of those specific metrics are important, how USDOT instructs states and metro areas to measure congestion will have huge impacts on communities of all sizes. Why? Because there’s a direct connection between how we decide to measure congestion and the resulting strategies for addressing it. And we need a measure that rewards solutions like aggressively investing in additional travel options, eliminating trips, reducing trip length, creating more places to live close to jobs or more effectively managing travel demand.

One of the most commonly used methods for measuring congestion today (and how proposed transportation projects would improve it or make it worse) is incredibly narrow and generates major criticism: roadway delay.

Every year, the Texas Transportation Institute releases their annual Travel Time Index congestion report that generates tons of news coverage across the country. Our piece from last year explained the limitations of comparing average rush-hour speeds to empty roads in the middle of the night, as TTI uses those middle-of-the-night speeds as their baselines for comparison. And then as a direct result of how congestion gets measured, many agencies attempt, at enormous price tags, to build enough road capacity to keep traffic moving at free-flow speeds during rush hour, usually bringing limited benefits (a few seconds of savings per commuter) at enormous costs.

Roadway delay, typified by TTI, also rewards places with long average commutes that happen at a high rate of speed, dinging places where people spend less time commuting or commuting shorter distances — just because they travel at slower speeds compared to that baseline of average travel speeds at the middle of the night.

Another major shortcoming is that roadway delay focuses only on drivers — not commuters as a whole, ignoring the millions of people opting out of congestion entirely by using various other options like transit, walking or biking or skipping the trip by telecommuting.  Under a roadway delay measure, if a city has made investments like these that allow a large share of its commuters to skip roadway congestion entirely, it can be rated the same as another city where the average delay on the roads is the same, even if 100 percent of that second city’s commuters are stuck in traffic.

Delay is also blind to how many people a corridor is actually moving — it only looks at the number of vehicles. Should two similar corridors, where the first moves three times the amount of people as the second because of a carpool requirement or a lane dedicated to high-capacity transit, have the same scores for delay just because the travel speed is the same?

STEX 9587C deadheading in Mountlake Terrace

With USDOT about to propose this new framework for measuring congestion, it’s worth stating plainly: Roadway delay, similar to what TTI measures, represents a flawed and unrealistic view on measuring congestion.

It also doesn’t mesh with USDOT’s overall priorities, running counter to the stated goals of President Obama’s seven rounds of successful multimodal TIGER investments as well as the priorities of Secretary Foxx’s ambitious Ladders of Opportunity initiative.

A better, properly constructed measure will reward states and regions for investing in projects that make the most cost-effective difference in managing congestion, reducing travel times and improving system performance, regardless of what type of transportation mode is proposed.

What we’re expecting from USDOT

Unfortunately, early indications lead us to believe that the final congestion measure due to be released any day now will incorporate a variation on roadway delay. But that won’t be the end of the line for something better. Just like the past two rules that largely focused on safety and the conditions of roads and bridges, USDOT will be opening a comment period after the rule is released and then refining it one last time.

Though we’ll have an uphill battle, through coordination and agreement on a preferred alternative (more on that in our next post), we stand a strong shot at getting language included that acknowledges the limitation of these conventional congestion measures and invites development of a better, more holistic measure that provides a fuller picture of congestion and who is or isn’t affected.

But we won’t be able to do this alone. We will need cities, MPOs, transit agencies, the business community, state DOTs and advocates just like you to support our effort to ensure that the final congestion measure more fully accounts for all modes of transportation and doesn’t reinforce flawed 1950’s measures of success.

More on the engineering metric that has an outsize impact on the design of our communities

California changed how the state measures the performance of their streets in 2013, shifting away from a narrow focus on moving as many cars as fast as possible — level of service (LOS) — and taking a more holistic view and measuring their performance against a broader list of other state goals that were often in conflict with LOS. But what is LOS? How does it impact how communities can design their streets?

In this second post of a longer series on level of service (LOS) only for T4America members, we walk through this metric in more detail and explain how it often works against a state’s, metro area’s or city’s other stated goals. Read the first post here.

Introduction

You may be familiar with this story: a community has plans to rejuvenate the economy by redesigning the local street (yet also state highway) running through its downtown, only to be told by the state department of transportation (DOT) that their proposed changes will slow down traffic and doesn’t rate high enough on their metrics to make it onto the short list of projects. Worse yet, the community is told that in order to make a street safer, they actually need to widen it and smooth out any curves, making it a virtual speedway, which would undercut the economic development opportunities.[1]

How do DOTs come to this conclusion that the proposed changes or new development would cause the roadway not to perform well? Most DOTs, metropolitan planning organizations and traffic engineers rely on a metric known as level of service (LOS). According to Jason Henderson, professor of geography at San Francisco State University, “Every city I’ve ever come across has some use of [LOS].”[2] Because of the ubiquity of LOS, this largely misunderstood measurement has profound influence on the design of our communities.

What is level of service?

Level of service is a system by which road engineers measure road performance on a graded scale of A through F. LOS measures how well a road is performing based on the number of cars and the delay automobiles experience on that roadway. Letters designate each level, from A to F, with LOS A, B and C representing free flowing conditions, while LOS F is stop-and-go traffic.[3] The score is assessed based on the highest level of congestion on that roadway, even if it only occurs a few minutes a day. Traditionally, roadway conditions are acceptable if they score a C or higher on non-urban streets and a D or higher on urban streets.[4]

Example of level of service graphic[5]

Santa Clara County Expressway Level of Service Map

The LOS measurement is calculated by first measuring the amount of traffic during the busiest 15 minutes of an evening rush hour. Then traffic engineers project the amount of traffic on the road in 20 or 30 years using the result of that measurement to determine if the road has enough capacity to cover the lifespan of that asset.[6]

One surprising aspect of the usage of LOS that many people don’t realize is how LOS is not just about how a road functions today. If a road is projected by traffic engineers to lack capacity 20 years in the future — an incredibly fuzzy practice that’s more art than math — that road still receives a failing LOS grade today, even if the road is adequately suiting capacity needs.[7]

The history of LOS

The 1965 federal Transportation Research Board Highway Capacity Manual introduced the LOS metric and it quickly became accepted as the standard measure of roadway performance.[8] One reason that states adopted the LOS so quickly was that it suited the country’s transportation goals in the 1960’s of building out a network of interstates and prioritizing automobiles to travel.[9]

Although LOS became the standard, transportation agencies at any level are not explicitly required to use it: there are no planning or project design requirements that mandate the use of either LOS or travel modelling. Planning manuals from both the the Association of American State Highway and Transportation Officials (AASHTO) and the Federal Highway Administration “clearly state that these are guidelines to be applied with judgment — not mandate(s)”[10]

It is important to point out that although LOS was initially meant exclusively for highways and cities aren’t required to abide LOS as a course of law, over the years the measure has hardened into convention for all roads. The adoption of this convention means that LOS has routinely been used for the design of city streets.[11] Eric Jaffe of Atlantic Cities in 2011 noted that “By the time cities recognized the need for balanced transportation systems, LOS was entrenched in the street engineering canon.”[12]

What’s next in the series on LOS?

In our forthcoming third post in this series, we will explain in more practical detail how LOS has damaged communities, organizations, and advocates promoting smart-growth. As Gary Toth from the Project for Public Spaces brilliantly put it, transportation professionals, “in search of high LOS rankings have widened streets, added lanes, removed on-street parking, limited crosswalks, and deployed other (anti-smart growth) strategies” all because LOS has been the de facto standard over the last 50 years.[13]

If we are going to change the way our streets and communities are designed, we will need to change the way we measure their performance.

Citations

What can other states learn from California’s shift to better measure how streets move people

In 2013, the State of California passed legislation that makes a dramatic change in how the state measures the performance of their streets. Rather than use the traditional level of service (LOS) measure that focuses far too narrowly on moving as many cars as fast as possible — regardless of the context or needs of a street — California’s Office of Planning and Research (OPR) is shifting to an alternative of measuring vehicle-miles traveled (VMT).

In this first post of a six-post series only for T4America members, Transportation for America will walk through the change from LOS to VMT, highlight the opinions of a variety of leaders on this issue and discuss the implications for California’s transportation system and potential implications nationwide.

Reminder, moving away from level of service (LOS) was one of the key recommendations in our new state policy report, released in January 2016. Don't miss that helpful resource.

Note: moving away from level of service (LOS) was one of the key recommendations detailed in our new state policy report, released in January 2016. Don’t miss that helpful resource.

In 2013, Governor Jerry Brown signed into law SB 743, eliminating the use of LOS for projects within designated transit priority areas (TPAs). As Streetsblog LA reported in 2013, SB 743 was a compromise between interests who wanted the full elimination of LOS in California and advocates pushing for the full and immediate elimination of LOS as a requirement for any project. But, because most urban areas fall within the state-defined parameters of a TPA, the enactment of SB 743 means that LOS is largely eliminated for urban projects.

Additionally, SB 743 authorized Governor Brown to develop a new way of measuring traffic impacts of major projects statewide and based the new way on total VMT rather than intersection congestion. (1) This will change how development projects are analyzed and scored in traffic impact studies and thus the type of development projects that California supports.

What this means

In short, instead of measuring whether or not a proposed project will make it less convenient to drive, (CalTrans) will now measure whether or not a project contributes to other state goals, like reducing greenhouse gas emissions, developing multimodal transportation, preserving open spaces, and promoting diverse land uses and infill development. (2) It is expected that this change will make it easier to build transit projects, as well as bicycle and pedestrian-friendly infrastructure.

But perhaps a larger change will be the type of development the law now encourages. Instead of encouraging sprawl that goes against California’s own environmental goals, these new guidelines will encourage development that moves California to a more sustainable transportation system. (3)

Status of Draft Guidelines

In August 2014, OPR released draft guidelines proposing to substitute VMT for the LOS metric (as authorized by SB 743). Under the draft guidelines, California no longer considers bad LOS a problem that needs fixing under the California Environmental Quality Act (CEQA). (4)

On January 20th 2016, OPR released the final draft of the changes to CEQA. The January 20th release signals the 45-day initial public comment period before finalizing the proposal and submitting to the California Natural Resources Agency to begin the formal rulemaking process under the Administrative Procedure Act. The regulations are anticipated to be effective statewide in 2019. (5)

Final Guidelines

The final guidelines are very similar to the draft guidelines with only slight changes. In the final proposal, OPR continues to recommend replacing LOS with VMT as the primary metric for analyzing a project’s transportation impacts, including the presumption that projects near transit (1/2 mile or less) should be presumed to cause a less than significant transportation impact and that transportation projects which add lane miles may result in induced vehicle travel. (6) In a big win for smart growth advocates, the guidelines emphasize that effects on automobile delay do not constitute a significant environmental impact. (7)

The new guidelines would remain optional for a two-year period following adoption, but would apply statewide to all development projects by 2019. (8)

Draft Guideline Rules on Impact Analysis

The final guidelines contain significant changes on the types of triggers needed to spur an environmental impact statement. Divided into three categories; land use projects, residential projects and office projects, all triggers are established at below a commonly accepted baseline level. The new proposal attempts to streamline the implemention of SB 743, with recommendations regarding significance thresholds, for required traffic analyses of development projects. (9)

These new threshold guidelines mean that development projects that will significantly increase the amount of automobile traffic that will be required to undergo rigorous environmental impact statements to ensure that they are compliant with California’s statewide greenhouse gas law.

Citations:

  1. Newton, D. and Curry, M. (2014, August 7th). California Has Officially Ditched Car-Centric ‘Level of Service’. LA Streetsblog. Retrieved February 1st from /http://la.streetsblog.org/2014/08/07/california-has-officially-ditched-car-centric-level-of-service/
  2. Newton, D. (2016, January 22nd). State Releases Proposed Rules That Would Finally End LOS in Enviro. Law. Streetsblog California. Retrieved February 1st from http://cal.streetsblog.org/2016/01/22/state-releases-proposed-rules-that-would-finally-end-los-in-environmental-law/
  3. Ibid 2
  4. Ibid 2
  5. Ibid 3
  6. Lathom and Watkins LLP. (2016, January 26th). California Governor’s Office Releases Updated CEQA Guidelines Proposal on SB 743 Implementation. Retreived 2016/2/01 from http://www.lexology.com/library/detail.aspx?g=b070fa40-a4ff-4ce1-a6db-f2bd104cce31
  7. Ibid 5
  8. Ibid 5
  9. Ibid 5

Seven metropolitan areas selected to participate in yearlong transportation training academy

Continuing T4America’s dedication to cultivating local transportation expertise and knowledge, we’re proud to announce the selection of seven local groups of metropolitan leaders to participate in a new yearlong training academy focused on performance measurement to better assess the impacts and benefits of transportation spending.

This 2016 Transportation Leadership Academy is the second such training program for local leaders created by T4America in as many years. (Our first academy was created in partnership with TransitCenter in 2015. -Ed.)

What is performance measurement?

Performance measurement — more carefully measuring and quantifying the multiple benefits of transportation spending decisions to ensure that every dollar is aligned with the public’s goals and brings the greatest return possible for citizens — is an emerging practice that forward-looking metropolitan areas of all sizes are beginning to use.

The transportation law passed in 2012 (MAP-21) created a nascent system for states and metropolitan planning organizations (MPOs) to measure the performance of their investments against federally-required measures. Some metro areas were doing this for years before MAP-21 passed; others are now trying to determine how to incorporate this new system into their process of creating plans, selecting projects, and measuring the effectiveness of each transportation dollar that gets spent. This yearlong training program will provide these local leaders with tools and support for this endeavor.

The academy is particularly timely considering that the U.S. Department of Transportation is working to finalize a new set of transportation performance measure procedures and regulations — possibly as soon as this year — which we’ve been writing about here regularly.

Why performance measures?

“It’s never easy to raise money to invest in transportation, and more than ever before, citizens want to know how the decisions are being made to spend their money,” said Transportation for America Director James Corless in our press release today. “A more accountable system that sets tangible goals with input from the community, chooses transportation projects that will help the community meet those goals, and then measures the outcomes in a feedback loop will be essential to rebuild public confidence in transportation agencies and for ensuring that we get the best bang for the buck going forward,” Corless said.

This program, created in partnership with the Federal Highway Administration (FHWA), will educate these seven teams made up of local business, civic, elected leaders, and transportation professionals, prepare them to act on opportunities within their communities and plug them into a dynamic national network of like-minded leaders throughout the country.

The yearlong academy will consist of in-person workshops with participants from all seven regions — Boston, MA; Cleveland, OH; Des Moines, IA; Indianapolis, IN; Lee County, FL; Seattle, WA; and South Bend, IN — ongoing technical assistance throughout the year, regular online training sessions, and expert analysis of their plans and progress on deploying performance measures.

What the participants had to say

“The benefit of being selected for this is program allows Central Indiana to have access to best practices in the industry as they’re being developed,” said Anna Gremling, executive director of the Indianapolis MPO, in their official release today. “Our team will use what we learn through this process to assist in the development of the 2045 Long Range Transportation Plan that will begin in mid-2016.”

“This is the future of transportation in an era of aging infrastructure and limited revenue – continually measuring the performance of the transportation network to ensure we’re making the smartest investments possible,” Des Moines Area MPO Executive Director Todd Ashby said. “We are thrilled to be included in cutting-edge thinking on the best practices in this field.”

“Our entire team is honored to be selected by Transportation for America for this first-ever transportation leadership program, particularly with groups from such a diverse cross-section of the country,” said Brian Hamman, Lee County Commissioner and Chairman of the Lee County MPO. “The knowledge this team will gain, and the national network we’ll create with other forward-thinking leaders, will serve Lee County’s transportation efforts well into the future.”

Updated – Ten things to know about the House transportation bill

Updated 11/5/2015 5 p.m. EST. We wrote this post in preparation for consideration of this bill on the House floor. But after the House finished consideration of the bill on Thursday (11/5), we updated this post to reflect the changes made (or not made) over the last few days. Look for the updated notes in the blue boxes with each item below and read our full statement on the bill here. -Ed.

The House Transportation and Infrastructure (T&I) Committee debated and approved their multi-year transportation reauthorization proposal last week. Next step is consideration on the House floor and then, if approved, conferenced (merged through negotiations) with the Senate, which passed their multi-year DRIVE Act back in July. Here are ten things you need to know about what’s in (or not in) the House bill which is expected to be considered on the House floor early next week.

ten-things-house-bill-strr

1) The House will likely tap the same non-transportation revenue sources as the Senate did to pay the tab

Though the House has yet to officially pass a plan to pay for their bill (unlike the Senate), we expect them to closely emulate the Senate plan to cobble together about $45 billion from numerous future funding sources to fully cover the cost of the first three years of their bill. Though as many as 10 years would be needed to realize some of the new revenues to cover the next three years of spending, it would instantly transfer billions from the general fund to the transportation fund, increasing the deficit, a practice that Senator Bob Corker (R-TN) called “generational theft.” We’ve already tapped general taxpayer dollars to the tune of $73 billion over the last few years to keep the nation’s transportation trust fund solvent.

One factor possibly complicating this plan is that the House and Senate just reached a separate budget agreement (to keep the government operating) that also requires selling oil from the country’s Strategic Petroleum Reserve — a mechanism that comprised the second largest stream of funding for the Senate’s bill. If that expected $9 billion in revenue for the DRIVE Act is no more, how will the House fill this gap?

For a detailed rundown of the Senate’s funding plan the House is expected to emulate, read our ten things post on the Drive Act.

Updated: The House did indeed use the Senate funding sources as their starting point, but there was a fairly stunning development late on Wednesday night when an amendment was proposed that taps billions from a Federal Reserve surplus account; an amount that could be sufficient to fund the bill for a full six years. It may be one way to allow other contentious payfors from the Senate to be removed — the dividend rate change for banks among them — but it could also nearly double the amount of money available. We’ll be watching this closely as more news develops.

2) Enshrines three more years of policy into law than we can pay for

The Senate bill — and we expect the House bill to follow suit as covered above — authorizes the surface transportation program for six full years but includes a funding plan that can only cover the first three years of the bill. The bill would use $46 billion in future offsets to cover its three-year length, leaving a future Congress to find another $50 billion or so to pay for the last three years. We’d be the first to say that we urgently need the certainty and stability that a multi-year bill provides to states and local communities as they plan transportation investments, but this is unprecedented and it’s incredibly shortsighted to lock our country’s transportation policy in stone for six years when we aren’t willing to pay for it. Especially when we’re enshrining transportation policy into law for the next six years, which simply doesn’t do enough to meet the needs of local communities of all sizes. Which leads us to…

Updated: Per the point above, it’s unclear just how much funding is going to be available. Enough funding for the first three years will be transferred, but the new funding sources tapped via amendment on Wednesday will provide far more funding and could be enough for the full six years of the House bill. Leadership will have decisions to make about what to do with the additional funding.

3) Misses a golden opportunity to provide more funding to local communities

The House bill is a major missed opportunity for giving cities, towns and local communities of all sizes greater access and control over federal transportation dollars. An amendment from Representatives Davis (R-IL) and Titus (D-NV), with broad bipartisan support, would direct more flexible funding to towns and cities and increase transparency in how projects are selected, but it was not included by the committee. Representatives Davis and Titus will be offering this amendment on the floor and we are going to need your help to make sure it gets into the bill.

Just like the Senate, the House bill does slightly increase the share of the bill’s most flexible funds that go to local communities by five percent (up to 55 percent of just one of many core highway programs), but that improvement only happens incrementally over the six years of the bill. This means that the full increase comes in the later years of the bill that likely won’t be paid for anytime soon — see #2 above. The House bill does lower to $10 million the minimum cost of projects that can apply for low-cost TIFIA loans, making it easier for local communities to access this smart federal financing program, but far more must be done to ensure that towns and cities both big and small have the resources and control they need to stay to invest in the infrastructure they need to be economically competitive.

Updated: The Davis-Titus amendment was not allowed to be brought to the floor by the House Rules Committee, despite the significant bipartisan support — among the most for any amendment offered. This means that there was no airing of the argument on the House floor and no chance for even debating the merits of giving local communities more control or authority over transportation dollars. This was a major point of contention raised in our final statement on the bill.

4) Includes a freight program to help states and metro areas address goods movement issues, but needlessly limits innovative multimodal projects

Similar to the DRIVE Act, the House bill encourages crafting a multimodal freight plan but only about 10 percent of the new roughly $725 million per year discretionary freight grant program can be spent on multimodal projects. This means that the House is dictating from Washington exactly how states and metro areas should solve their freight challenges, robbing them of the flexibility to invest in whatever option can best keep freight moving.

This flies in the face of past statements from this same committee, which stated clearly in a report three years ago that our freight issues are multimodal and require multimodal solutions. “Moving goods and people effectively depends on all modes of transportation,” said Chairman Shuster in that report. “Because bottlenecks at any point in the transportation system can seriously impede freight mobility and drive up the cost of the goods,” Rep. John Duncan added, “improving the efficient and safe flow of freight across all modes of transportation directly impacts the health of the economy.” The committee’s recommendation was to “ensure robust public investment in all modes of transportation on which freight movement relies.” The committee should take its own advice.

Updated: This was unchanged.

5) Small changes to transit funding with sizable implications

While the bill largely preserves the historical share of funding overall intended for transit, it makes two changes that will have significant impacts on communities planning new or expanded transit service to meet the burgeoning demand for housing and jobs near public transportation.

First, while highway projects will continue to have 80 percent of their costs covered by federal highway funds, the committee lowered the share paid on transit capital projects to 50 percent. While many big transit projects already match more than half of the cost locally, especially in more prosperous metro areas, poorer and smaller communities will both be punished. Federal Small Starts transit capital funds often cover well over 50 percent of the cost for new bus lines or bus rapid transit service in smaller communities, which will be disproportionately impacted by this change.

Secondly, the House bill eliminates the flexibility for a state or metro area to use a portion of the flexible federal funds that they control outright as the local contribution or match for transit projects, taking away more of the flexibility and control from local communities that this committee professes to value. Representatives Lipinski and Nadler spoke up during committee and are working to fix these before the bill is finalized on the House floor.

One piece of good news is that the small grant program to help support smart development around transit to help boost ridership and the bottom line will continue to be funded at $10 million per year for 6 years.

Updated: An amendment from Rep. Nadler and several others to fix this was approved and incorporated into the bill, though it doesn’t quite return things to standard practice of today. Under the House bill as passed, states or metros will be able to shift their CMAQ funds to transit projects and use that as part of their local contribution to a project. This can raise the effective federal contribution to these projects over 50 percent, though the match rate will stay at the new lower 50 percent rate. We’ll have some more information on this soon.

6) A once sizable loan program (TIFIA) slashed by 80 percent; no support for transit-oriented development projects

The TIFIA low-cost financing program — where federal loans are paid back from local revenues often generated from the projects themselves — is cut significantly from $1 billion down to $200 million per year. Congress had just massively increased this program in the current MAP-21 law in order to stretch our limited federal dollars as far as possible and leverage other revenue sources. And with so much more loan money available after that 2012 increase, Congress directed USDOT to award dollars in a first-come, first-serve basis instead of by competition based on the merits of the projects. Now the House proposes to cut the program by 80 percent while still preventing USDOT from judging projects on need, performance or return on investment.

Secondly, Representative Edwards (D-MD) and Barbara Comstock (R-VA) were urged to withdraw their amendment to allow transit-oriented development projects to be eligible for receiving these low-cost TIFIA loans — a common sense proposal that would net more riders and revenue for the operating agencies and cost the federal government zero dollars.

Updated: This amendment was yet another rejected by the Rules Committee, which barred it from receiving a vote or debate on the House floor. This amendment had zero cost and allowed these projects only to apply for funding. TIFIA — one of the points of pride for the architects of MAP-21 — remains slashed by 80 percent (down to $200 million) in the final bill.

7) New performance measure on condition and access for disadvantaged urban areas

Thanks to the efforts of Representative Andre Carson (D-IN), the House bill does include a new performance measure intended to “assess the conditions, accessibility, and reliability of roads in economically distressed urban communities.” While we’d like for this section to include a more holistic measure for access — as in access to jobs or opportunity by any mode of travel as a better and broader indicator than relying on simply road condition — we’re happy to see the amendment’s inclusion. This signals that the House is open to conversations on adding new or improved performance measures to the bill. That’s a positive development.

Updated: No change made to this amendment. However, a similar amendment from Reps. Ellison, Grijalva, Waters and Huffman would have expanded on this idea and “established performance measures for accessibility for low-income and minority populations and people with disabilities; cumulative increase in residents’ connection to jobs; and the variety of transportation choices available to users, such as public transportation, bike and pedestrian pathways, and roads and highways,” per our amendment tracker. This second amendment was rejected by the Rules Committee.

8) Better planning to alleviate income-draining commutes and connect more people to jobs

An amendment from Representatives Albio Sires (D-NJ) and Ryan Costello (R-PA) was included to expand transportation options for commuters — with a focus on low-income communities — by leveraging the resources of employers and the private sector. Larger metropolitan areas would be required to develop regional goals to reduce vehicle miles traveled during peak commuting hours and improve transportation connections between areas with lots of jobs and areas where low-income households are concentrated. They would be required to identify existing public transportation services and employer-based commuter programs that support better access to jobs and identify proposed projects and programs that could reduce congestion and help connect more people to jobs.  This is modeled after the successful Commuter Trip Reduction program in Washington State, which we profiled indirectly in this case study on a vanpooling program there.

Updated: No changes made.

9) The TIGER competitive grant program for smart state and local projects? Where is it?

Following yesterday’s announcement of another successful round of TIGER competitive grant awards and the proud press releases flying out of representatives’ offices from both parties, one might ask why TIGER isn’t included in the House bill. With leaders in the House speaking regularly of the need to get a better return on investment for our limited dollars, leverage other funding sources, and encourage more local innovation, they’d be smart to formally authorize TIGER — a grant program which can help realize those goals. Neither the House or Senate bills do this, and the communities that rely on this program — one of the few ways they can directly receive funding for their projects — will have to wonder each year if Congress’ appropriators will keep the program going.

Updated: TIGER is still M.I.A. in the final House bill. The bill has no increased competitive funds for innovative multimodal projects, save for the slight amount of the new freight program available for multimodal freight projects. The House bill continues the status quo of awarding funds and largely stays away from any shift to awarding funds based on benefits, merits or possible return on investment.

10) Where did the TAP program go?

The Transportation Alternatives Program that states and local communities use to help make walking and biking safer and more convenient was folded into another program (the Surface Transportation Program) and capped at $819 million per year over the life of the bill. This program already makes up just two percent of the total highway budget, and it will be even less if this bill is approved as is. While the policy was not changed in any damaging way, capping these funds (in a bill where all other programs increase in funding with inflation over the life of the bill) more or less guarantees that TAP will be capped in any future House and Senate conference agreement.

Updated: TAP was unchanged, though there were several amendments rejected that would have further reduced its funding or allowed states and metros to flex its funding away to other programs. But in a bill where almost all other programs grew at least slightly, TAP’s size is capped over the life of the bill, which results in an actual decrease in funds due to inflation — “compound dis-interest.” With possibly six years of funding now procured by the House, we could be looking at no net increase in funds for biking and walking for six more years instead of just three.

House Committee passes a multi-year surface transportation bill

On October 23rd, the US House Transportation & Infrastructure Committee passed out of committee a long-term surface authorization. The bill, the Surface Transportation Reauthorization and Reform Act (HR 3763), authorizes the federal surface transportation program for six years, and recommends flat line funding plus inflation over the life of the bill.

Transportation for America (T4A) published a summary of the bill (pre-mark-up) for members, click HERE to download it.

Ultimately, the big-four agreement – a bipartisan agreement determining which amendments would be allowed, accepted or rejected that exists between the Chairmen and Ranking Members of the full- and subcommittees – proved to hold firm during yesterday’s nearly six-hour meeting.

Of the 160 plus amendments offered during the mark-up by members of the committee, the Chairman agreed to only three:

  • adding tourism to state and MPO planning scopes,
  • exempting weight limits for emergency vehicles, and
  • including a performance metric on urban highway state of good repair.

Only two received votes and both failed by large margins. In return for assurances by Chairman Shuster (R-PA) that the Members’ concerns would be taken care of before the bill reaches the House floor, nearly all Members offered and withdrew their amendments.

Of importance, Representatives Davis (R-IL) and Titus (D-NV) offered an amendment to increase the amount of funding directed to metro regions by $9 billion over the life of the bill and improve the transparency and project selection process for regions under 200,000 in population. Download the Davis-Titus summary memo HERE.

Though Rep. Davis (R-IL) had the votes yesterday to pass this amendment, he offered and withdrew the amendment after it gained the largest number of bipartisan statements of support during the markup (those came from Reps. Davis, Titus, Frankel (D-FL), Edwards (D-MD), Rouzer (R-NC)).  Chairman Shuster signaled that he is open to working with the bipartisan group to make improvements to this area of the bill as it moves forward in the process.

There were also a number of non-controversial amendments included in the manager’s amendment prior to the start of the meeting. Notable amendments include:

  • Sires (D-NJ) and Costello (R-PA) – amends the planning section to encourage MPOS to develop congestion management plans that develop strategies and projects that improve transportation access during peak hour travel and would include employers and representatives of low-income households.
  • Curbelo (R-FL) and Titus (D-NV) – amends the safe streets language to encourage reporting on the development and implementation of safe streets at the state level.

Despite a number of statements of support from various organizations, T4A finds that this bill doesn’t meet the forward-looking federal policies needed to strengthen the economic and social prosperity of our nation’s communities. We will continue to work to ensure the House STRR Act and the Senate DRIVE Act move in our direction and I thank you for your support.

Announcing a new academy for local leaders who want to dig in on performance measures for transportation

In partnership with the Federal Highway Administration (FHWA),T4America is announcing a new yearlong training academy for metro regions that are hoping to learn more about the emerging practice of performance measurement, and applications are open now.

Transportation leadership academy performance measures

2012’s transportation law (MAP-21) ushered in a new era, creating a nascent system for states and metropolitan planning organizations (MPOs) to better determine success or failure by measuring the performance of their investments against federally-required measures. Some metro areas have been doing this for years before MAP-21 passed, and others are now scrambling to understand how to incorporate this new system into their process of creating plans, selecting projects, and measuring the effects of those projects and the effectiveness of each transportation dollar that gets spent.

Register for the webinar


This year-long leadership training program will educate local business, civic, elected leaders, and practitioners at the early stages of performance measure development, and will prepare participants to act on opportunities within their communities while plugging them into a dynamic national network of like-minded leaders throughout the country.

We know it sounds like wonky stuff, but with money for transportation harder to come by than anytime in recent history, a more accountable system that sets goals with input from the community, chooses transportation projects accordingly to meet those goals, and then measures the outcomes in a feedback loop will be essential for ensuring we get the best bang for the buck going forward.

This new academy for 2016 builds off the successful experience in 2015 with our partners at TransitCenter in a similar yearlong academy with leaders from three metro regions who have plans to invest in transit as part of their long-term economic development strategies. There are scores of smart, capable people at the local level who are trying to make great things happen in their communities, and we’re hopeful that this Transportation Leadership Academy will provide participants at the metropolitan level with the tools and support they need to set up a system for measuring performance to guide their planning and project selection processes.

Four things to know about applying: Get your application. Common questions are answered in this FAQ. Applications are due on November 13th. We’re hosting an informational webinar on October 21st at 2 p.m. EDT for those who want to learn more. Register for the webinar today.

Who should apply: Individuals who are working on transportation at the metropolitan level in regions that are at the early stages of performance measure development. Participating individuals may include local business, civic, elected leaders, and practitioners. For example, individuals may be elected officials on the board of an MPO or senior staff of chambers of commerce, labor organizations, civic groups, community associations, local or regional foundations, or major employers. Each regional team should have a participating staff member or board member of their local MPO. Both a staff member and Board member are encouraged to participate on a team.

Not sure who your MPO is? Search USDOT’s database of MPOs to find out. 

Update: North Carolina legislature adjourns without addressing political meddling in transportation selection process

The NC legislature adjourned their session without addressing a damaging cap on state funds intended for a Triangle area light rail project. Their actions were widely decried in the state and circumvented a new bipartisan state process for evaluating transportation projects on the merits and awarding state funds to the best projects, intended to be free from political meddling.

As we previously reported this week, some unknown North Carolina legislators used the budget process to interfere with the state’s new Strategic Investments Law intended to evaluate and select transportation projects based on the benefits in an attempt to stop a rail transit project that’s already been selected for state funds. The unknown legislators’ action to insert a provision cutting the state commitment to a Durham-Chapel Hill light rail link from $138 million down to $500,000. drew wide condemnation from the state’s Republican governor, members of both parties and even legislators that also don’t like this particular project.

Early this morning, the North Carolina legislature adjourned their session without approving an amendment to remove that cap, leaving the state funds for the project in limbo for now. The House successfully passed an amendment to remove the cap by a large margin, but the Senate did not vote on it and referred it to committee, ending any chance to deal with it until the legislature reconvenes in April 2016, according to the Raleigh News & Observer.

The project is rolling forward for now with it’s environmental impact statement, and the GoTriangle transit agency is optimistic that the cap can be removed in the next session after such a strong showing in the State House.

All of this damages an improved process that was supposed to remove this kind of political maneuvering from deciding which projects are funded and which are not. From McClatchy via Mass Transit Mag:

[Durham Senator Mike] Woodard mentioned how well the Durham-Orange Light Rail line scored with the strategic transportation investments law (STI). The STI created a formula using “data-driven scoring and local input” to help determine what projects would get funding through the State Transportation Improvement Program (STIP). … “There are certainly Senate members who are not fans of transit,” McKissick said, adding members believe that politics have been put “right in the middle” of the discussion and debate of public transportation. McKissick said funding through STIP was a way to remove politics from the process.

Earlier this week, we included testimony from North Carolina Governor Pat McCrory, who was proudly touting his state’s new process for evaluating transportation projects before the House Transportation and Infrastructure Committee. His later exchange with Rep. Crawford is worth reading in full:

Representative Crawford: Your State took on a pretty big change in your transportation project selection process. What prompted you to do that? Talk about that a little bit.

Governor McCrory. Well, we were making a lot of decisions on our roadbuilding based upon politics. And as you went down, we did not have the interconnectivity that we should have had. You would go down from the East to the West, North to the South, and we would have highways going from two lanes to four lanes back to two lanes back to eight lanes. And it made no rhyme or reason on why the roads were wide in one area and very narrow in others. And we also saw that it was not an efficient use of limited tax dollars. So in a bipartisan agreement, Republicans and Democrats both agreed to change that formula. …We now base our formula on how we spend money on congestion, on economic opportunity, and on safety, the three major criteria of how we decide to spend the money.

Rep. Crawford: Safe to say that it has been pretty well received by the general public on that transparency and the streamlining the process, taking the politics out?

Gov. McCrory: Absolutely. And I think where I keep bringing up Eisenhower, for each of you, too, is I think as we look for more funding, Mr. Chairman, we need to also show the vision of where we plan to have this interconnectivity from a national perspective, from a regional perspective, from a State perspective, and even, yes, to a local perspective. If we show that, where we are planning to spend that money, and show that we do have a plan and a vision for the next generation and the generation after that, I think people are willing to pay for it. But if we do not have their trust and spend the money as we have always spent it, I do not think we are going to get the trust of the people to increase the amount of funding for transportation.

We’ll keep our eye on this issue over the next year, as will the members of the Raleigh delegation to this year’s Transportation Innovation Academy as they continue advancing plans to bring other new transit service to adjacent Wake County.

Politicians meddling with North Carolina’s shift to a merit-based process for choosing transportation projects

Just two years after instituting a new process to choose transportation projects based on merit and award funds in a more transparent process intended to be free of political interference, a handful of North Carolina legislators reinserted politics back into the process in an attempt to stop a light rail project in the Raleigh-Durham metro area.

Durham light rail rendering

UPDATED 5:45 p.m. Thursday 10/1: North Carolina’s legislature adjourned without addressing the cap. Read more about it here.

The surprise provision was inserted into a budget compromise as the state’s legislature was tussling over an annual budget resolution for the coming year. As Streetsblog earlier reported this week:

Lawmakers who still won’t identify themselves inserted language into a state budget bill sabotaging the light rail project. There was no public debate. There was no warning that transit funding was even under discussion. The budget measure placed an arbitrary cap on state funding for [any] light rail project: $500,000. Doing so undermined the process established by the state’s Republican-controlled legislature for awarding transportation funds, which is supposed to be free from political interference.

Back in 2013 the Republican-led North Carolina legislature approved the Strategic Transportation Investments Law, an attempt to get transportation decisions out of the hands of politicians and pick projects governed by objective metrics and projected benefits instead. It was an idea that had — and still has — lots of buy-in from legislators from both parties across the state. It was viewed as an important step toward a process that was more transparent, accountable, and less subject to political interference.

Performance-Measures-Report-Promo-frontWe featured North Carolina’s new process in Measuring What We Value, a free downloadable T4America report on the emerging practice of performance measures: “NCDOT’s focus on strategic selection shifted the department from a short-term portfolio of projects that were not explicitly tied to agency goals to a long-term, formal approach that uses data to assess outcomes.” (Page 17.)

Here’s how Governor Pat McCrory referred to the previous system while testifying before Congress earlier this year:

In my own State of the State address last month, I highlighted that during the past decade or so, as I have driven down the highways of North Carolina, I’ve noticed it goes from two lanes, to four lanes, back to two lanes, to eight lanes to four lanes and then back to two lanes. And everywhere it gets wider it’s named for a politician or a Department of Transportation board member. And where the congestion choke points still exist, the road is nameless.

The flaws of a system where projects are picked based on the political power or connections of the sponsors — regardless of how those projects fit into the state’s goals — was exactly why the process was changed in 2013, with notable consensus in the legislature to do so. Gov. McCrory’s testimony continues:

That’s not the way we do things anymore in North Carolina. We’ve taken the politics out of [transportation] by putting in place a transportation formula that focuses on relieving congestion, improving safety and growing and connecting the economy in all parts of our state. Those changes allow us to be more efficient with taxpayer dollars. In fact, we’ve more than doubled the number of transportation projects that will be built. This new approach will create thousands of new jobs during the next 10 years.

In the Research Triangle metro area — the city triumvirate of Raleigh, Durham and Chapel Hill spans three counties — voters in two counties have already approved separate half-cent ballot measures to raise millions in local funds for a 17-mile light rail project connecting Durham and Chapel Hill. That local commitment was to be paired with $138 million previously committed by the state under the new merit-based process. This new cap essentially kills the Durham-Chapel Hill light rail line by cutting the planned state contribution down to $500,000 — regardless of the projected benefits.

Legislators from both parties have rallied together in support of removing the cap and keeping the new process politics-free. Even legislators that have reservations about this specific rail project believe the new process is a smarter one and have endorsed the cap’s removal, focusing on the consensus forged around the new Strategic Investments process.

Republican Representative Paul Stam told the Raleigh News & Observer that “he is not a fan of the light rail projects, but said the lawmakers ought to ‘stick with the numbers under our strategic transportation initiative.’”

Also in the Raleigh News & Observer

“I’m not a big supporter of light rail,” Rep. Bill Brawley, a Mecklenburg County Republican, said Wednesday. “But what I am a big supporter of is to have a process to assign projects based on the ability of engineers to calculate the benefits – rather than the ability of powerful legislators to get enough votes to spend the money in their district.”

There is good news to report today, however. The House passed an amended budget to remove the $500,000 cap and restore the state’s merit-based project selection process. The Senate is likely to consider the amended budget today or tomorrow, according to local news sources. If the Senate approves the House’s version, the final budget will go to Governor McCrory.

Follow us on twitter @t4america, along with Wake Up Wake County for more info as it becomes available.

How to use performance measures: Performance measures for members, part IV

Beth Osborne

Beth Osborne

Performance measures should be used to prioritize and account for public spending and, through this, demonstrate to the public that their dollars are being used wisely. There are four ways to deploy performance measures: 1) create a dashboard, 2) prioritize projects, 3) optimize investments and 4) check on the performance of past investments. 

This is the fourth post in a series on performance measures by Beth Osborne, T4America Senior Policy Advisor. Catch up on the series with a high-level overview of the concept, find out how and why you should go beyond the federal requirements and learn more about choosing the best measures for addressing your priorities. -Ed.

A dashboard

A visualization of data or metrics known as a “dashboard” can be a useful snapshot of current conditions or the direction an area is moving. Dashboards are useful because they are visual and quickly lay out in one glance the region’s goals and the current status. Two examples are Salt Lake City and the Virginia Department of Transportation.

VDOT dashboard example

Sample dashboard from VDOT

The development of a dashboard can help determine what the public wants to prioritize — the public has an easy-to-digest summary of core statistics about your transportation network to help them choose what’s important. But this tool has a notable limitation: it’s not responsive to those public priorities if it isn’t also connected to decisions about public spending. After all, you could have an elegant dashboard that’s easy for anyone to understand rating the safety of the roadway…while making no investments in roadway safety.

A dashboard doesn’t automatically make it clear that any investment decisions are being made to impact the statistics being measured or displayed.

Prioritizing projects

The State of Virginia recently decided to take steps to ensure that the public’s priorities were better reflected in their process of selecting projects. Their legislature passed a bill in 2014 requiring all new capacity projects to be weighed against each other based on five priority areas: congestion reduction, economic competitiveness, access to opportunity, safety and environmental protection. They created a process — now available to the public —for ranking these outcomes based on significant public input.

Optimize investments

Spurred on in part by funding uncertainty, The State of Tennessee took a step back and analyzed their entire list of planned projects with a critical eye. They looked closely at the expected outcomes of their planned projects and then searched for other less expensive ways to accomplish the same things. The results were quite impressive, with multi-million dollar projects replaced by projects that cost just hundreds of thousands, saving millions and still bringing 80-90 percent of the benefits of the more expensive project. (A presentation on their new process can be found here.)

How have past investments performed?

In the world of transportation planning where everyone is always looking forward, forward, forward, it can be incredibly useful to take a look backwards on a regular basis and see if past choices have met projections and brought the benefits promised — and recalibrate the process if they have not.

Transportation agencies do their best to project the outcomes of each investment, but no one can get it right all the time. The agencies that are making the most of their dollars are the ones that check back on their investments to see if they performed as expected and, if they did not, make changes.

To do this, the goals of each project must be clearly stated and then reviewed at major milestones to see if the expected results materialized. The public notices when we make promises that don’t come true, and being right there with them and explaining what will change with the process is an important way to build credibility. We must check our own work and continually improve our performance, especially if we want the public to continue to invest in our programs.

Using performance measurement to chase the right goal: Performance measures for members, part III.

If states and metro areas merely take up conventional measures without question, they may move in the wrong direction toward the wrong outcomes in the end. Instead, start from your ideal goal and work backwards to choose the appropriate measure to get you there.

This is the third post in a series on performance measures by Beth Osborne, T4America Senior Policy Advisor. Read the rest of the series anddive into high-level overview of the conceptfind out how and why you should go beyond the federal requirements, and learn how to demonstrate to the public that their dollars are being used wisely. -Ed.

What do you mean “conventional” measures? What sort of commonly accepted measures can send us in the wrong direction?

Beth Osborne, T4America

Beth Osborne, T4America

A fantastic, timely example can be seen in the latest release of the oft-cited but flawed Texas Transportation Institute’s (TTI) Urban Mobility Report which purports to rank metro areas by congestion, but is a case study in how a conventional, yet flawed, measure can lead you in the wrong direction.

There are numerous issues with TTI’s measure of congestion and we don’t cover them all here. Read our detailed public critique of the TTI report on the blog. -Ed.

When actual drivers talk about congestion, they tend to mean one of two things: bumper-to-bumper traffic or unpredictability. The latter really makes commuting a hassle — the lack of certainty about just how long today’s commute may take, with no way to adequately plan for it. (“Do I know how much time I need to allow today so I’m not late for work?”) It turns out that commuters understand that traffic will slow during rush hour, just like they know they will wait for a table at a popular restaurant on Saturday night.

TTI’s travel time index identifies congestion as any delay compared to the speed of traffic when the road is essentially empty. In other words, if people travel at 65 miles-per-hour on a particular highway where there is no traffic, any time the speed drops is considered delay, even if a slowdown to 55 mph is simply down to the posted speed limit. Yet, if you knew that you could travel at a reliable 55 mph each day for a rush hour commute (or 45 mph or 35 mph, even), wouldn’t you appreciate that predictability?

Most delay measures also only consider the experience of those driving. When the TTI report speaks of the experience of commuters universally, they’re actually only talking about driving, leaving out millions of others who commute each day by other methods.

Why is that distinction important? Let’s say the roadways are equally congested in two cities. In one city only half of the commuters experience it because they commute by transit, bike, foot or opt out entirely by telecommuting. In the other city, almost every commuter is traveling by car and is stuck in traffic each day. Do these two cities have the same congestion problem? According to the way TTI measures it, yes they do.

This is precisely how the wrong measure can put you on a path to the wrong outcome.

By defining and measuring congestion as only the change in speed at rush hour compared to the middle of the night and ignoring all other commuters, the “solution” becomes as limited as it is expensive: build enough roads and lanes so commuters in cars can drive as fast as they want — even above the speed limit — at all times of day no matter how many vehicles are on the road.

That narrow focus also means the community will be missing ways to encourage shorter trips, commuting by other less costly modes, and opting out of commuting entirely. If the community has economic development goals of attracting the young talent that is increasingly looking to locate in places with a wide range of transportation options, using a measure that focuses solely on driver delay will run at cross-purposes to those (and other) goals.

So how can we make sure we’re measuring congestion in a more beneficial way; in a way that reflects our residents’ concerns?

First, listen to your residents and stakeholders explain what it is about congestion that frustrates them. Understanding the source of their frustration will ensure your community is tracking the real problem.

Second, think about the point of view of all of your residents — roadway congestion may not be a frustration for all commuters. This means getting a more accurate picture of who is actually experiencing congestion day-to-day. After all, one way to address congestion is to remove drivers from the road, through carpooling, telecommuting, alternative work hours, helping people live closer to work or supplying affordable and convenient transportation options. Many of these solutions are cheaper than building more road capacity.

Congestion is not the only area where states and metro areas attempting to measure performance can mess up. One smart way to avoid these mistakes is to think deeply about the preferred, ideal outcome you’re seeking. Is it free flow conditions on every road at all times of day? Is it giving your commuters a predictable commute? Is it giving the highest possible number of people access to jobs within a 45-minute commute? Identify the end goal and find a measure that leads toward that goal.

We have more information about ways to do this in our report, Measuring What We Value. And let us know if we can help you explore these issues more deeply.

Performance Measures Report Cover 350x300

Don’t settle for the limited things Congress could agree on: Performance measures for members, part II

If states and metro areas don’t act now to establish their own priorities for their transportation system, they’ll end up only measuring what Congress deemed important in MAP-21. The time is now to start the conversation of what else also matters to the leaders and citizens in your area.

This is the second post in a series on performance measures by Beth Osborne, T4America Senior Policy Advisor. Read the rest of the series and dive into high-level overview of the concept, learn more about choosing the best measures for addressing your priorities, and learn how to demonstrate to the public that their dollars are being used wisely. -Ed.

With federal performance measures rolling out, what happens next?

Beth Osborne, T4America

Beth Osborne, T4America

The transition to a new system of “performance measurement” represents an attempt by Congress to get a better sense of how our transportation system is performing nationally, to allow states and regions to be compared with against another, and to communicate with the public about what they are getting for their tax dollars.

With USDOT nearing the end of the rulemaking process for establishing new performance measures for our transportation dollars, attention will turn to state DOTs and MPOs which will soon need to establish accompanying goals for their transportation system in these limited priority areas set by Congress, including safety, infrastructure condition, air pollution and congestion.

Each state DOT and MPO will set a target for each of USDOT’s measures. For example, State A may currently have 700 highway fatalities a year and want to bring this down to 650. The state would announce that goal, describe which projects will help them attain it and then report back to USDOT and the public about whether they hit their target.

In the case of the safety and infrastructure conditions measures, if a state or MPO fails to hit their target then they’ll have to spend a minimum amount of funding in that area. In the case of the other measures, there is no specific implication or consequence if targets are missed. But the process should still help improve accountability and transparency for priorities and spending: the public will have the chance to help set those targets, scrutinize whether or not the projects being chosen are likely to help meet the state and/or regional goals and to hold leadership responsible for the results.

Should we do more? Why won’t these federal measures alone be enough for our state or MPO?

If you have other important priorities and big picture goals for your transportation dollars outside of the limited set of measures agreed to by Congress — and many of you do — you need to begin work now to establish your own system. If not, with all the time and attention going into Congress’ limited measures, they could easily overwhelm your other priorities not addressed by them.

If your other priorities are to get the same emphasis, they need to receive the same treatment, including a system for measuring and setting goals for those priorities. Failing to have your other measures in place could easily lead to a system where projects get funded to satisfy federal measures but neglect certain regional priorities or even do damage to them. For example, building a highway expansion to address auto congestion (federal measure) that cuts off local access to jobs in a commercial center (metro priority).

One example of how to ensure your priorities are in the mix

The Salt Lake City region has conducted extensive outreach to the public and stakeholders to identify goals for the region with excellent results. Through a (widely admired and emulated) visioning process called “Envision Utah” that engaged thousands of citizens in its feedback process, the booming Salt Lake City region looked at future challenges and considered different ways to grow, including the infrastructure needs associated with each vision. They developed several approaches and evaluated them against their valued priority outcomes, like protection of open space, household transportation cost, and disaster resilience — all measures that the federal performance measure system will not take into account.

By doing this a decade ago, the region chose a growth pattern that saved $4.5 billion in avoided infrastructure costs over 10 years. And the public involvement led to strong support and excitement for the eventual projects selected based on this process. Citizens see their views reflected in the vision, and feel included in the process — which, incidentally, makes it easier to raise new revenue to invest in transportation, as the state recently did.

Transportation is just a mechanism to reach your shared vision and goals, so focus on the goals first

What is particularly exciting about Utah’s approach is that it isn’t rooted in the notion that transportation is a separate thing; an end unto itself. Their analysis of transportation needs flow from the shared vision for the region overall and aren’t simply reactive to current traffic conditions. The region believes that transportation should be planned to support economic development in the area and that traffic flow alone does not equal economic development.

Remember almost no one travels just to travel. There’s always a destination in mind. The goal is to get to work in order to earn money or to get to school to pick up your kids or to get to the doctor for medical care. The end goal isn’t just to drive the designed speed of the roadway or never spend a minute in congestion, though that is often where traditional engineering standards can take you. On the other hand, it is not the job of the engineers to decide our values or choose the community’s broader goals and outcomes. That is the job of the political and civic leadership.

And performance measures are where that process happens.

Now is the time to start the conversations with stakeholders and the public to ensure all regional priorities are being considered and measures are chosen to address those goal areas. And if you want your regional and local priorities to be reflected in the state DOT’s performance management system, a discussion about how to align those priorities should occur before the federal rules are pushing states to implement the new system.

For more information, feel free to check out our report on performance measures, Measuring What We Value.

Performance Measures Report Cover 350x300

New traffic congestion report raises more questions than it answers

Most people sitting behind the wheel each day won’t be surprised by the findings of the latest edition of the Texas Transportation Institute’s report on urban congestion that shows, once again, that (surprise!) the roads in most major American cities are very congested during rush hour each day. The report’s methodology is flawed, but what really matters most is what policymakers and citizens decide to do about congestion in their communities.

(Updated: 8/27/15 12:15 a.m. with other articles at bottom.) Once again, The Texas Transportation Institute is in the headlines today with the release of their Urban Mobility Report and its Travel Time Index (TTI), which purports to rank metro areas by congestion but is mostly disconnected from what commuters experience on a day-to-day basis.

While TTI is striving to provide easy to understand measures and rankings to the complex issue of traffic congestion, their methodology is once again drawing criticism on a number of fronts.

The report’s touchstone metric is a blunt measure of peak-hour speeds compared to an empty road in the middle of the night. Did you know that trips take longer during rush hour compared to the middle of the night? You did? The comparison of rush-hour to free-flow traffic begs the question about the goal: is it reasonable or even possible to build enough road capacity to keep traffic moving at free-flow speeds from 6-9 a.m. when the bulk of the populace is going to work? (Those free-flow speeds being used as the baseline comparison also exceed the speed limit in many cases, by the way.)

The economist Joe Cortright wrote a comical April Fools post that showed how silly that logic is when applied anywhere else, in this case, at Starbucks, where consumers lose “$4 billion every year in wasted time” because of long lines during busy mornings. Yet:

No one would expect to Starbucks to build enough locations—and hire enough baristas—so that everyone could enjoy the 15 second order times [at 9 a.m.] that you can experience when there’s a lull [at 9 p.m.]. Consumers are smart enough to understand that if you want a coffee the same time as everyone else, you’re probably going to have to queue up for a few minutes.

The report focuses only on drivers — not commuters as a whole. The millions of people using growing modes like transit, walking or biking or skipping the trip entirely by telecommuting at peak aren’t included in the analysis. So when the report says “person” or “commuter,” what they’re really saying is “car commuter.” The nearly 1 million trips taken per day in Washington, DC —#1 on the “list of gridlock-plagued cities — on metro (bus and rail) and therefore not in a car? Not included in this analysis.

Trips not taken can be crucial, yet they’re ignored here. In February 2009, Inrix, the company partnering with Texas A&M on this release, reported that just a 3.7 percent drop in vehicle miles traveled in 2008 resulted in a 30 percent drop in congestion in the 100 most congested metro areas. We don’t need everyone to shift their trip, take transit, move closer to work, or telecommute — among many possible options. But smart investments and incentives that lead to very small reductions in trips taken can have huge benefits in reduced congestion. And they’re often far cheaper than massive projects proposed to shave a few seconds off of average commutes.

Live close to where you work? Oops. Your short commute can come out looking worse than someone else’s much longer commute. TTI completely ignores the actual time and distance of commutes. If you have a 20-minute commute home but move at a lower speed, your commute scores worse than the person driving 80 minutes at a higher speed. Yet who has the better experience each day?

We share a graphic like this almost every time this report comes out, but it’s telling. According to this year’s Travel Time Index, Atlanta (1.24) is actually less congested than Chicago (1.31). Yet…

Chicago Atlanta travel time


In Chicago in 2007, the average peak hour car trip to work was 38% shorter (in time) than the 57.4 minutes it took Atlantans to drive to work in rush hour. Even the average non-peak commute in Atlanta in 2007 was longer than the average congested peak hour commute in Chicago.  A major reason for the better highway performance in Chicago is that drivers do not have to travel as far as drivers in Atlanta – 13.5 miles compared with 21.6 miles. Yet TTI rates Chicago worse.

Ranking congestion is fine, but what should we do about it? How can we manage congestion in the most cost-effective way possible given limited transportation dollars?

Doing more of the same certainly won’t solve the problem. Regions that have been aggressively investing in additional travel options, eliminating trips, reducing trip length, creating more places to live close to jobs or more effectively managing demand have seen their congestion numbers get better, according to this landmark CEOs for Cities report from a few years ago.

That’s why it’s so critically important that the rule for the congestion performance measure being developed by USDOT measure success (or failure) in ways beyond just this limited and flawed TTI measure. We do need a better measure of congestion if we want to avoid making the same decisions that got us into this mess.

How far do most people have to travel for work? How long does it take them? What is most effective at reducing the amount of time it takes to get places? How many people are exposed to the congestion? Congestion may be bad, but people telecommuting, in a vanpool or on a bike might not experience it. Credit should be given to areas that allow people to opt-out of the traffic. Those are the kinds of metrics we need to use in order to find real solutions.

The proposed rule for congestion being drafted right now by USDOT will lay out exactly how states and metro areas will have to begin measuring congestion — and measuring whether or not the projects they want to build will improve it. We’ve got some posts in the works that will discuss how some alternatives would work, so stay tuned on that front.

Updated: The quotes from the report’s author in this WAMU story from Washington, DC essentially acknowledge that their report is a limited measure of congestion, largely because it only focuses on auto commutes and ignores essentially everyone else.

In response to the coalition’s criticism, Lomax conceded the report’s methodology does not take into account non-car commuting modes.

“They have some good points,” Lomax said. “And they are points that we have included not only in our proposed solutions, but also in terms of our methodology.”

“We have backed away from trying to make estimates of what is happening on the transit side because we don’t have very good transit data. We don’t have good data about how people are walking. So we concentrated on where we have the data,” he said.

Here’s a sampling of other articles questioning the measures in the report and suggesting some better ways to measure a more accurate picture of congestion.

Diving into performance measures with T4’s resident expert

Feel a little lost when it comes to the concept of transportation performance measures? In the first post of a short series expressly for T4A members, Our resident expert and USDOT veteran will help bring you up to speed with a high-level overview of the concept and a quick look at the current state of practice.

This is the first post in a series on performance measures by Beth Osborne, T4America Senior Policy Advisor. Read the rest of the series and find out how and why you should go beyond the federal requirements, learn more about choosing the best measures for addressing your priorities, and learn how to demonstrate to the public that their dollars are being used wisely. -Ed.

Beth Osborne, T4America

Beth Osborne, T4America

As Congress debates a new surface transportation reauthorization bill, it is easy to forget that the transition to performance measurement required by MAP-21 has not yet been fully implemented. The language in MAP-21 required that states and metropolitan planning organizations (MPOs) determine the success or failure of their transportation system by measuring the performance of their investments against federally-required measures, but USDOT has been slow to finalize those benchmarks and kickstart this new process for states and MPOs.

While USDOT continues to work their way through this process via three rulemakings, there are two big issues with which everyone will grapple.

First, though MAP-21 requires specific areas to be measured, the areas were limited to those on which Congress could agree — measures including safety, system condition, system performance, mobile source emissions, and freight movement on interstates and congestion, among others. MAP-21 did not address other measures like economic impact, access to opportunity, transportation cost, freight movement (beyond interstates) and other environmental impacts beyond air quality.

T4A members should be concerned about these missing areas. Regions that fail to consider them may end up only building projects that address Congress’ priorities and not the priorities of their constituents. If you or your community want to consider other factors and measures when picking projects and choosing where to invest, it is time to confer with political and civic leaders, stakeholders and the public to identify those priority areas and the measures that go with them.

Nationwide, states and MPOs are discussing this issue now — before the rule is completed by USDOT and everyone is forced to get moving on USDOT’s tight implementation timeline. We will talk more about how this can be done in the next post, with some specific examples.

Second, regions should pay close attention to the development of each performance measure rule by USDOT because those rules will establish exactly what each state and region will measure. There are more ways to measure “National Highway System performance” and even “congestion,” for example, than you may realize, with a wide range of impacts based on how each issue is measured.

Congestion could be a measure, as engineers have traditionally treated it, of moving cars through an area as fast as possible. Or we could focus on moving people instead of cars. Keeping cars moving so that traffic never slows — no matter how many cars are on the road — is an extremely expensive, if not impossible, proposition. If your goal is moving people, the solution will be much more affordable, flexible and tailored to the overall community goals.

We will dig in deeper to the issue of how the wrong measures can send a community in the wrong direction in an upcoming post.

USDOT split their full rule for performance measurement into three parts. Their first part covered safety measures; the second, system condition measures (i.e., road and bridge condition); and the third contains all the other measures mentioned above. The first two parts of the rule have already been released, commented upon and closed. The third (the biggest one) is still pending and will probably be released to the public for comment toward the end of this year.

Stay tuned right here, T4A members! Over the next few weeks, we will unpack the thorny issue of performance measures and provide you with insights into preparing for this new decision-making system and how you can use it to build support for your programs and help make a case for needed funding.

For more information, feel free to check out our report on performance measures, Measuring What We Value.

10 things you need to know about the Senate’s DRIVE Act

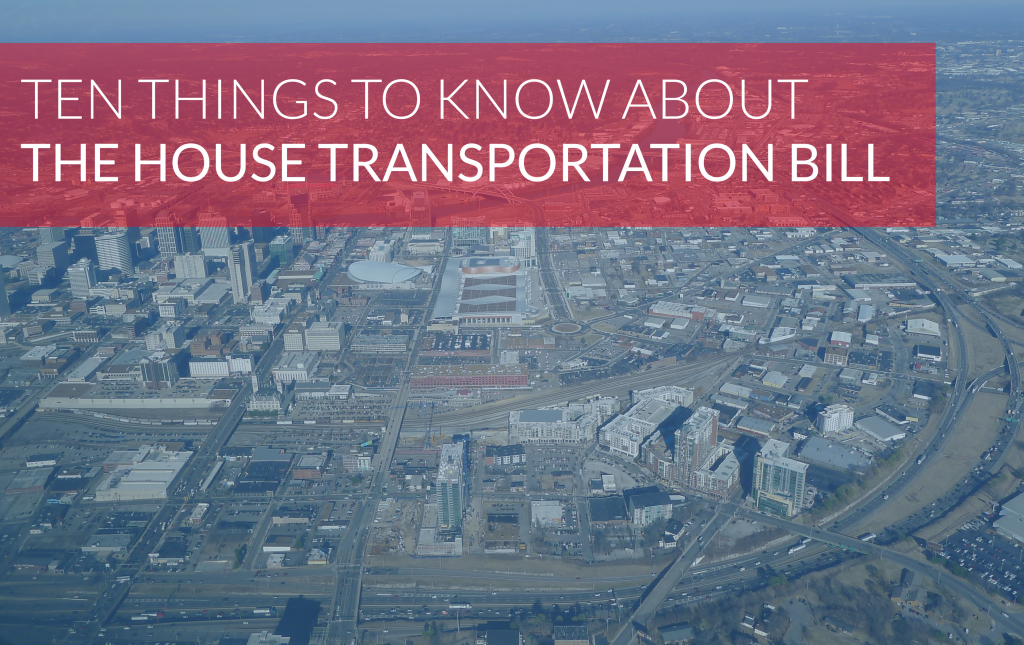
The Senate approved their multi-year transportation authorization bill by a 65-34 vote this week. You can view our full statement on the DRIVE Act here from T4America Chairman John Robert Smith. Meanwhile, here are 10 things that you need to know about what’s in the Senate bill.


1) Funding from deficit spending vs. pay-as-you-go

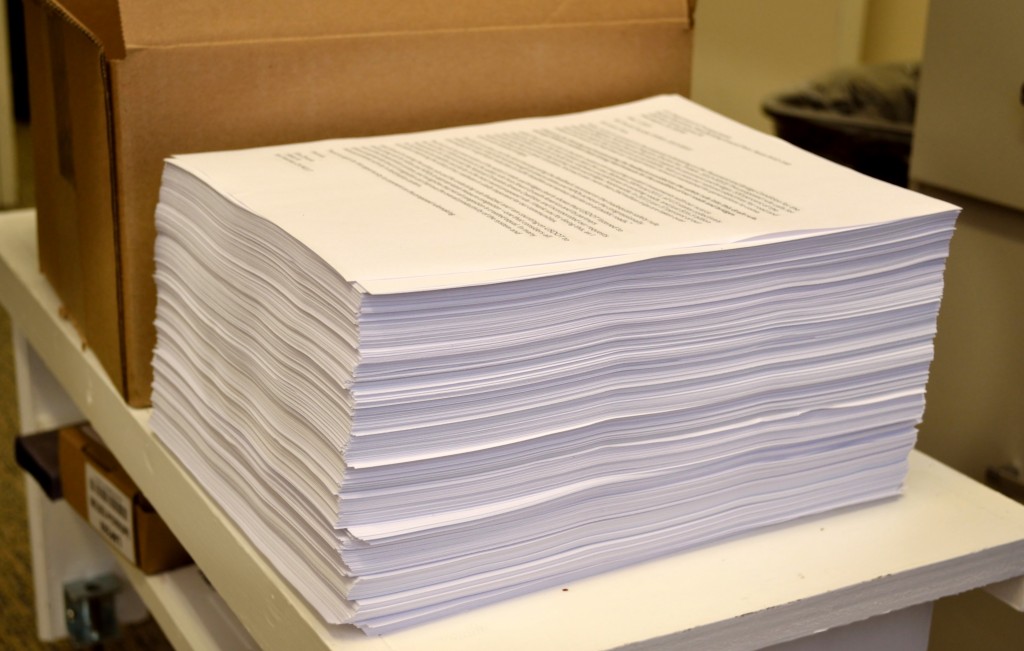
How do you pay for a six-year transportation authorization when the transportation fund is broke and Congress is unwilling to raise the federal gasoline tax? For the DRIVE Act, the Senate bridged the gap between dwindling user fee revenues and total spending by getting creative. In the end, they cobbled together $46 billion in non-transportation-related funds, fees and accounting maneuvers.

Among some of the more controversial “pay-fors” in the Senate bill is a requirement to sell 100 million barrels of the 693 million barrels in the nation’s Strategic Petroleum Reserve (SPR) between 2018 and 2025, estimated to bring in $9 billion if it can be sold at $95 per barrel ($30-40 more per-barrel than today’s price). Add to that the indexing of customs fees (ironic for a Congress unwilling to index gasoline taxes), an extension of airport TSA fees through 2025, closing estate fee loopholes, and reducing the “fixed dividend rate” the Federal Reserve pays to banks.

But while the bill needs 10 years to recognize some of the new revenues or savings that won’t occur until the 2025, it would instantly transfer billions from the general fund to the transportation fund, increasing the deficit. Senator Bob Corker (R-TN) called it “generational theft,” while T4A Chair John Robert Smith asked, “Is it fiscally responsible to place the cost of paying for three years of transportation investments on the backs of our children and grandchildren?”

A final point of clarification on the length of Senate bill: the DRIVE Act authorizes six years of spending, but provides only three years of funding certainty. In 2018, Congress will have to find an additional $51 billion to fully fund the bill for the remaining three years of its authorization. Despite calls from a diverse cross-section of industry and advocacy groups for a “long-term, sustainable funding solution” for transportation, the DRIVE Act is patched together with temporary and speculative “pay-fors,” the type that are only going to get harder to find three years from now.

PolicyTen-year savings
Reduce the fixed dividend rate the Federal Reserve pays larger banks$17.10 billion
Sell 101 million barrels of oil from the Strategic Petroleum Reserve$9.05 billion
Index customs fees for inflation$5.70 billion
Extend current budget treatment of TSA fees from 2023 to 2025$3.50 billion
Use private debt collectors to collect overdue tax payments$2.48 billion
Extend Fannie/Freddie guarantee fees$1.90 billion
Require lenders to report more information on outstanding mortgages$1.80 billion
Close an estate tax loophole about the reporting of property$1.50 billion
Clarify the statute of limitations on reassessing certain tax returns$1.20 billion
Revoke or deny passports for those with seriously delinquent taxes$0.40 billion
Devote civil penalties for motor safety violations to the Highway Trust Fund$0.35 billion
Stop paying interest when companies overpay for mineral leases$0.32 billion
Adjust tax-filing deadlines for businesses$0.30 billion
Allow employers to transfer excess defined-benefit plan assets to retiree medical accounts and group-term life insurance$0.20 billion
TOTAL$45.80 Billion

2) Local communities get the short end of the stick…again

The DRIVE Act bypasses America’s cities and towns, reducing the already small amount of funding they directly control to invest in locally-driven projects by nearly $200 million in the first year alone compared to MAP-21. We were extremely disappointed to see a bipartisan amendment from Senators Roger Wicker (R-MS) and Cory Booker (D-NJ), with support from Sens. Casey (D-PA), Durbin (D-IL), Peters (D-MI) and Stabenow (D-MI) fail to receive a fair hearing on the floor. Their plan would have put a larger share of transportation dollars in the hands of local governments by increasing the amount of flexible federal Surface Transportation Program (STP) dollars directly provided to metropolitan areas of all sizes and allowing direct access to the funding for rural areas through a grant program. By failing to bring more dollars, control and accountability closer to the local level, the bill fails to restore the trust of the American people in how our transportation decisions are being made.

3) Progress on a national freight policy but with funding stuck in 20th century silos

The Senate recognized the economic importance of moving goods efficiently throughout the country by including a new freight program that also includes real funding: almost $1 billion in the first year, and up to $2.5 billion annually towards the end of the authorization.

Unfortunately, 90 percent of the dollars reserved for the freight program are restricted to highway projects. This decision runs counter to the realities of how our freight moves: generally, no one product gets to its destination by one mode of transportation, but rather relies on a interconnected and efficient system of ports, rail lines, highways, urban streets and intermodal yards all working together.

There’s a mixed message here. The bill requires USDOT, states and MPOs to conduct thoughtful national- and state-level freight planning to analyze the condition and performance of the freight transportation system and identify the highest priority needs to create greater efficiency and reliability in freight movement, regardless of mode. After all this planning is done, the Senate bill instructs states and MPOs to focus only on highway projects at the expense of rail lines, ports and a truly intermodal network.

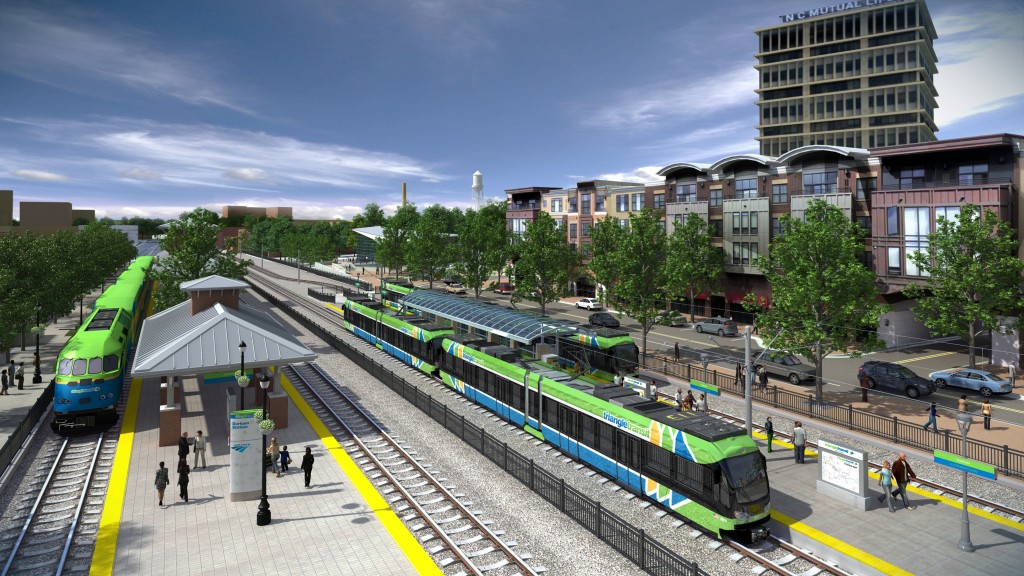
4) For the first time, intercity passenger rail is included in a surface transportation bill

While the popular shorthand for the transportation authorization is “the highway bill,” the nation’s transportation program has included dedicated funding for public transportation and bicycling and walking since 1982 and 1991 respectively. But intercity passenger rail has been consistently left out of the overall surface transportation legislation – until now.

For the first time, the nation’s passenger rail policy is included in the bill, laying the groundwork for further improvements and expansion of the nation’s passenger rail service to match the recent unparalleled growth in ridership. Previously, the passenger rail bill has always passed as a standalone authorization, but the DRIVE Act would enshrine the policy in the nation’s surface transportation bill. While the rail programs would still require annual appropriations for funding, it takes an important step forward in providing Amtrak sustainable funding and helping to expand service to meet booming demand.

5) Popular TIGER program fails to win a permanent seat at the table

The USDOT’s competitive TIGER grants represent one of the few ways local communities can directly access federal funds for their local priority projects. While disaster was averted as the bill was being drafted and TIGER hasn’t been changed in this bill, the Senate missed a major opportunity to authorize the program and make it a permanent part of the nation’s transportation policy. If this bill passed, supportive lawmakers will have to continue to fight each year for TIGER funding through the annual appropriations process, resulting in up and down fluctuations in available funding year to year. That makes it tough for local communities to plan and compete within this popular and oversubscribed program.

Nearly one-third of the Senate endorsed Senator Patty Murray’s (D-WA) amendment to authorize TIGER and provide $500 million per year in contract authority via the transportation fund. Unfortunately, along with the Wicker-Booker amendment, this important provision was not given an open and fair hearing on the floor.

6) TIFIA loans can fund TOD, but under a dramatically scaled back program

One of Senator Barbara Boxer’s (D-CA) signature achievements in MAP-21 was an expansion of the TIFIA loan program from nearly $125 million up to $1 billion in annual financing authority. This move greatly expanded an innovative program of low-cost federal financing that doesn’t have to be repaid immediately, allowing the financial benefits of a project to accrue before payments are due. While two good changes were made in the DRIVE Act — making transit-oriented development (TOD) an eligible expenditure and making it easier for local projects, TOD and ITS to access this program by lowering the total project cost threshold lowered from $50 million to $10 million — the program’s funding was scaled back significantly, from $1 billion to $300 million annually.

7) Transit wins additional funds, but projects with private involvement can ‘skip the line’

Overall, public transportation was spared any cuts and in fact received a larger portion of overall authorized funding. As initially introduced by Majority Leader McConnell (R-KY), the DRIVE Act provided transit with 24 percent of the bill’s funding, but the new money used to fill the gap in the transportation fund was directed almost entirely to the highway program. As a result, the mass transit account was set to end the third year of the bill (FY2018) with a negative balance of $180 million. This was fixed on the Senate floor with help from Sen. Durbin (D-IL) and others, and in the end transit received a nearly 25 increase in funding over the six years of the authorization.

One provision in the transit title of the DRIVE Act generating controversy is the ability for projects with any private sector involvement in design, construction, operation, or maintenance of transit projects to jump to the front of the line for the already oversubscribed transit New Starts Program.

8) Active transportation funding survives intact

While the bill represents a missed opportunity for local communities on the whole, the bill slightly increases funding for the popular Transportation Alternatives Program (TAP) to $850 million, but it caps the growth there over the life of the bill. Unlike other programs, this means TAP will not be able to grow with inflation over the life of the six-year authorization.

On a positive note, communities that use TAP to help make biking or walking safer and more convenient will receive 100 percent of the program’s funds, meaning all $850 million will be available to communities. States formerly controlled half of the program’s funds — but no longer.

9) Limited progress to improve accountability through performance measures

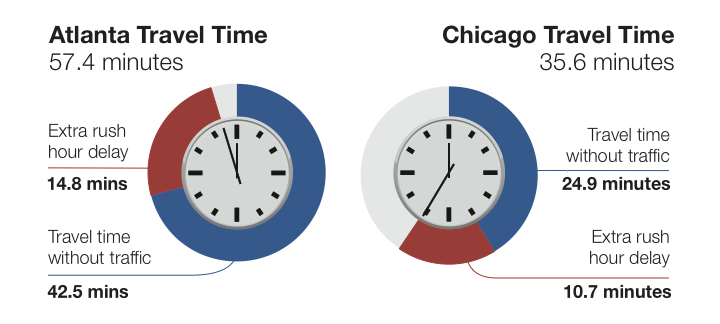
The DRIVE Act takes one small step to build on project selection and performance management, a key reform of MAP-21. The DRIVE Act provides MPOs and states support in developing their performance measure programs by requiring USDOT to develop datasets and data analysis tools. This includes addressing data gaps for trip origin and destination, trip time and travel mode.

While USDOT has yet to complete their assignment to establish rules for the performance measures contained in MAP-21, there were steps available to the Senate such as including measures such as connectivity and access to jobs or improving project selection processes to open up the “black box” and provide greater transparency and understanding for why one project receives funds over another. None of these positive ideas were included in the DRIVE Act that passed the Senate.

10) Positive advances for next-generation transportation research

At a time when transformative changes in technology are beginning to reshape the transportation landscape, providing an outcome-based 21st century transportation research program is needed now more than ever. Fortunately, this is an area that the DRIVE Act did well. First, the bill establishes competitive funding for local governments and MPOs, among others, to deploy and test innovative research. This is important, since MAP-21 provided limited dollars outside of formula funds to test and deploy the next generation of transportation innovations. Second, the bill would require USDOT to study “shared use mobility” (car-sharing, bike-sharing, ride-sharing, etc.) and other innovative concepts, and provide local and regional leaders best practices and better understanding of the shared use transportation sector. This is important since we need to provide our leaders the understanding of this new transportation sector so that they can adequately plan and provide for its growth.


The last thing you need to know is that the work is far from over. While the Senate passed this long-term bill, both chambers also passed short-term extensions to MAP-21, setting up October 29th as the next deadline to agree on a multi-year transportation bill. Will the House pass the Senate’s bill? Will they draft a bill of their own? Will they fail to do anything and move to another short-term extension in October? Stay tuned.

US Senate Transportation Authorization – T4A Update

The US Senate continues to debate the federal surface transportation bill this week, with a series of votes taken last night by the full Senate. Individual senators filed over 200 amendments and T4America continues to track the latest developments on those amendments. We have compiled a brief update on where things stand and provide information on three amendments that we know would spur innovation, access and local control. 

**It is rumored that another manager’s amendment package will be offered in the near future. T4A will update this information as needed.

Transportation Funding Timeline Update: Transportation funding expires this Friday and the House announced this morning that they intend to pass a 3-month extension to match the Senate’s; setting up a new October 29 transportation funding deadline.

Last week, Majority Leader McConnell (R-KY) introduced what is expected to be the first of potentially two or more manager’s amendment packages. Manager’s packages serve as legislative vehicles to modify a piece of legislation in committee or on the floor, wholesale. This first manager’s package makes a number of changes, including maintaining the historic 80/20 highway and transit funding split; increases funding for the FTA High Intensity/Fixed Guideway State of Good Repair Formula program by $100 million (paid for by cutting TIFIA and the Assistance for Major Projects by $50 million each) and requires 50% of the off-system bridge set-aside funding in the STP program to be used on bridges that are not on the federal-aid highway system.

Last Sunday, the Senate dispatched a couple of non-germane amendments, but voted to allow Senators to vote on whether or not to tie the Ex-Im Bank authorization to the highway authorization. Late last night, the Senate voted and approved that plan (64-39).

Under this new modified manager’s package, T4A believes that it is unlikely that few if any of the 200+ plus amendments filed by Senators will be considered or voted on. However, we do anticipate the introduction of a third manager’s amendment which will reflect additional changes. T4A continues to work to increase local control, innovation and access to jobs and opportunity through three primary amendments. They include the following:

  1. Wicker-Booker STP local control amendment (corresponding fact sheet by USCM on changes to metro level funding)
  2. Murray TIGER authorization amendment
  3. Donnelly Job Access planning amendment (search for S. Amdt 2434, 2435 and 2436; this one is messy, our apologies)

Update: 5 Issues to Watch (for more information, please refer to T4A’s Member post on 7/23/15):

Pay-fors – Since the last post on 7/23/15, a number of items have shifted. A few provisions, considered poison pills, were removed, including the $2.3 billion that came from denying those with felony warrants social security benefits and $1.7 billion that came from rescinding unused funds for TARP’s Hardest Hit Fund. These rescissions leave the authorization with $43.7 billion, all of which are generated outside of the traditional transportation-user fee system. The measure would provide enough additional HTF revenues to provide the first three years of highway and transit investment, but Congress would be required to raise additional resources before October 2018 to be able to fund the final three years of the DRIVE Act’s authorized spending.

Transit funding – Changes in the manager’s package increased the levels of transit funding to be 24% of the authorized levels overall and 24% of any new funding generated annually.

Freight –The DRIVE Act creates a robust freight planning process that directs states to examine efficient goods movement and identify projects needed to improve multimodal freight movement. However, despite instituting a multi-modal freight planning process, the new National Highway Freight Program would require 90% of the funding go to highway-only projects rather than to multimodal projects using a performance-based system. What impact will this have?

Take, for example, the non-highway freight needs in the State of California. Ten percent of California’s funding would be only $9.3 million in 2016, growing to $23 million in 2021. Comparitively, one multimodal project at the Port of Long Beach in California to remove a railroad bottleneck and build more on-dock rail capacity cost the Port $84 million. T4A views this policy as a missed opportunity and not consistent with T4A’s freight policy.

Overall, due to removal of the TARP Hardest Hit Fund, the bill’s overall investment levels needed to be reduced. Under the first manager’s package, the freight program was set to receive $1.5 billion in FY2016 growing to $2 billion in FY2018. The program would now receive $991.5 million in FY2016 and increase to 1.9 billion in Fy2018.

Passenger Rail – No changes to note from the last update on 7/23/15.

Assistance for Major Projects (AMP) – Funding decreased by $50 million per year to increase funds for FTA’s High Intensity/Fixed Guideway State of Good Repair Formula program. AMP would now be authorized at $250 million in FY16 and rise to $400 million in FY2021.

*NEW* TIFIA – The initial manager’s package introduced early last week would cut TIFIA funding from $1 billion to $500 million per year. Removing the TARP Hardest Hit Fund and other payfors required additional cuts, which senate authorizers took out of the TIFIA program. Those cuts, plus the increase to the FTA’s High Intensity/Fixed Guideway State of Good Repair program, result in an overall authorized funding level for TIFIA at just $300 million per year over the life of the bill.

Louisiana legislature makes a paradigm shift to better prioritize transportation dollars and restore public confidence

Louisiana passed a bill through the state House and Senate by unanimous votes last week that will make the process for spending transportation dollars more transparent and accountable to the public — a smart first step to increase public support for raising any new transportation funding.

At least 20 states have successfully raised new funding at the state level for transportation since 2012, a trend we’ve been tracking closely here at T4America. But all states are different, and in some states, raising new state funds for transportation can be a tough sell, especially if a skeptical public doesn’t have any faith in the process for spending the money already available.

Louisiana featured bridge construction
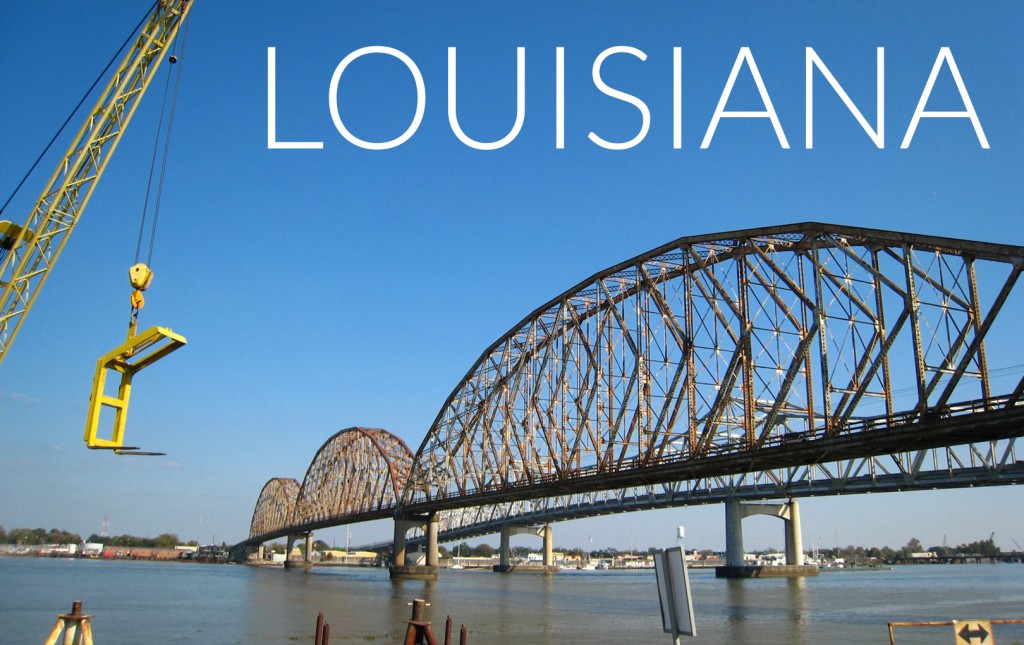
Louisiana is taking some first steps to fix that process while also trying to raise new money. A recent bill to raise the state sales tax by one cent to fund major projects fell short in the House, though a few other bills to raise gas and general sales taxes to fund transportation projects are still active this session. As our Capital Ideas report from earlier this year noted, it can be challenging to develop public support for new transportation funding when voters have no certainty that those funds will be put to the best possible use.

One emerging strategy to restore public trust and confidence in an opaque and mysterious process is adopting the use of performance measures, which can demonstrate to the public what they’re going to get for their tax dollars.

The first step in a shift toward using performance measures is to establish what your goals are. And this just-approved Louisiana bill sponsored by Rep. Walt Leger, HB 742 (bill text), starts by laying out clear, understandable criteria in plain language “to prescribe the process by which the [Louisiana] Department of Transportation and Development (DOTD) shall select and prioritize certain construction projects.”

From the bill text:

The legislature declares it to be in the public interest that a prioritization process for construction be utilized to develop a Highway Priority Program that accomplishes the following:

  1. Brings the state highway system into a good state of repair and optimizes the usage and efficiency of existing transportation facilities.
  2. Improves safety for motorized and nonmotorized highway users and communities.
  3. Supports resiliency in the transportation system, including safe evacuation of populations when necessitated by catastrophic events such as hurricanes and floods.
  4. Increases accessibility for people, goods, and services.
  5. Fosters diverse economic development and job growth, international and domestic commerce, and tourism.
  6. Fosters multimodalism, promotes a variety of transportation and travel options, and encourages intermodal connectivity.
  7. Encourages innovation and the use of technology.
  8. Protects the environment, reduces emissions, and improves public health and quality of life.

That straightforward list goes beyond what’s currently being developed as part of MAP-21 and the typical measures of success used elsewhere.

This legislation is a marked improvement on the current state statutes governing how the Louisiana DOTD chooses transportation projects, which has been described as open-ended, unaccountable and a total mystery to the public. This bill represents one of the more ambitious overhauls of a state’s decision-making processes and an important first step toward improving the transparency and accountability of distributing transportation funds, setting Louisiana on a path of ensuring every transportation dollar provides the greatest benefit.

The bill has cleared both House and Senate is is currently waiting for Gov. Bobby Jindal’s signature. The Louisiana DOTD supported the bill, and starting in 2017, the department is expected to be utilizing the new project selection process.

The next logical step for Louisiana and other states creating goals like these above is to follow it up by creating measurable data points to serve as yardsticks. That way, the public can see this straightforward list of priorities, examine what the tangible, measurable (i.e., quantifiable) goals are, and then evaluate whether or not the state is spending their transportation dollars on the projects that can help them meet those goals.

T4America congratulates State Rep. Walt Leger, the chief sponsor of this bill, for constructing and pushing it through the legislature on unanimous votes. Rep. Leger is a member of T4America’s State Advocacy Network (START), created to support efforts to successfully pass state legislation to raise transportation funding while improving accountability for spending it.

If you’d like to find out more about START, visit this page and get in touch.

START logo t4 feature web

The USDOT listened, and we thanked them for it — 1,100 times

Last Friday, with help from many of you, we delivered almost 1,100 ‘thank you’ letters to the U.S. Department of Transportation for writing strong rules to hold states accountable for the condition of their roads and bridges. 

It was an astonishing thing to see the enormous stack of letters piled up on a desk in our office. Last Thursday, just before the Friday deadline for comments, T4America director James Corless got a midday workout by hauling the box of letters across town to USDOT and ensuring that your voices were heard on the issue.

James USDOT NHPP rulemaking delivery

USDOT is working to establish a new system of performance measures to govern how federal dollars are spent via this process of draft rules and feedback.

Last year, after complaining that the USDOT’s proposed safety performance measures — the first set of measures — were far too lenient, we sent the agency 1,500 letters letting them know that the rule was not good enough. The USDOT listened and drafted much stronger rules for their second set of measures on road and bridge conditions. In the first draft, states were allowed to fail half of their targets and still receive a passing grade. But after receiving those 1,500 comments, USDOT incorporated that feedback into this improved draft rule for road and bridge conditions, requiring progress on all targets — not just 50 percent of them.  

So it was time to say thank you and let USDOT know that requiring progress across the board is just as essential for evaluating the condition of our roads and bridges.

Even third graders know that our voices matter. T4A director James Corless had to stop by his son’s classroom on his way to USDOT, and he had the giant box of letters in tow.

I had been scheduled to talk to my third grade son’s civics class about how Congress and the Administration make decisions about things like the federal budget and how much we spend on transportation. After talking a lot about the different roles of Congress and the President, one of the third graders put up her hand.

“What’s in the box?” she said.

“Those are letters to Secretary Foxx, head of the U.S. Department of Transportation,” I replied.

“Is that a petition?” another child asked.

“In a way, yes, except this time we are thanking them for listening to the public — that’s the great thing about a democracy.”

“Cool!” another third grader said.  “They’re going to have to read all of those letters, right?  Can we send some too?”

Coming up next? Measuring congestion

You (and those third graders) will have an opportunity to engage once again on this issue. Sometime this year USDOT will release their third draft rule that will include an approach for measuring congestion. Congestion is a tricky thing to measure, and most of our current analyses wildly miss the mark. As our Beth Osborne wrote back in January:

For example, is the goal of highway performance to keep traffic moving at the speed limit no matter how many cars are on it? Or is it to know that your trip today will take the amount of time you budgeted for it? If it is the former, we will have to spend a lot of money paving over a lot of places at marginal benefit to ensure a safe and efficient commute or delivery. If it is the latter, we can address the issue with a mix of more affordable operational improvements, emergency response and new capacity. In congestion, are we only interested in the speed of cars or do we give communities credit for letting their residents opt out of congestion entirely by taking transit, walking or biking?

As another example, while you might want an interstate between two cities to flow as freely as possible, some congestion on a city street in a business district might be desired as a sign that it’s a popular destination. Yet most current measures often treat these roadways the same.

We will be exploring some ideas about better ways to measure congestion here in the next few weeks, hopefully before USDOT releases their next rule, so stay tuned.

Hold states accountable for repairing roads and bridges – send a letter to USDOT

The U.S. Department of Transportation is in the process of writing new rules to hold states accountable for the condition of their roads and bridges. USDOT’s strong first draft rule was a step in the right direction, and we want to thank them — and ensure they don’t bow to pressure to soften these requirements.

Can you take just one minute to sign this letter to USDOT? We’ll hand-deliver a copy straight to USDOT for you.

Did you already take action? Share this action with others:

The 2012 transportation law (MAP-21) requires transportation agencies to begin using a new system of performance measures to govern how federal dollars are spent. USDOT is working to establish these new metrics for safety, the state of repair, congestion (coming soon!), air emissions and other aspects of our transportation system through an iterative process of draft rules, feedback, refined drafts and final rules.

Look, we get it: this is a wonky and arcane affair. So why should you take action and provide a comment on this pavement and bridge proposed rule? Because USDOT is truly listening to comments and making changes as a result. 

USDOT’s first rule on roadway safety wasn’t a good one, to put it bluntly, and it failed to ensure that safety would improve. Yet the thousands of comments we delivered played a part in improving it.

In that draft, states were allowed to fail half of the fatality and injury targets and still receive a passing grade. But after receiving more than 1,500 comments, USDOT incorporated that feedback into this improved draft for roads and bridges, requiring progress on all targets — not just 50 percent of them.  

Now USDOT is going to hear from the other side, those that don’t want states to be held to such high standards.  We need to let USDOT know that we support the changes they made and that requiring progress across the board is just as essential for evaluating the condition of our roads and bridges.

Between 2009 and 2011, all U.S. states collectively spent $20.4 billion annually to build new roadways and add lanes to existing roads, and just $16.5 billion annually repairing and preserving existing roads and bridges. But by 2011, after spending more than half of all highway dollars on expansion projects, just 37 percent of our nation’s roadways were in ‘good’ condition. And today, more than 260 million trips are taken each year on the country’s structurally deficient bridges.

That’s not good enough. We need to hold states accountable to meet measurable targets with our tax dollars. USDOT has drafted a better rule to make that happen, and we need your help to ensure it stays that way.

Read and sign this letter today, and we’ll deliver it to USDOT before the May 8 deadline.

New T4A report out today: Measuring What We Value

With pressure mounting to ensure our limited transportation dollars go as far as possible, a new report out today from Transportation for America takes a close look at the growing trend of using performance measures to establish clear priorities and better measure the success of our transportation investments.

First, it’s not too late to join us for the launch webinar this afternoon (Tuesday March 3rd) at 3:30 p.m. EST.

Register for Webinar

Secondly, this short report, featuring an introduction from former US Secretary of Transportation Ray LaHood, is live and available now on our website, so go and download your copy now.

Performance Measures Report Cover

Now available at https://t4america.org/maps-tools/performance-measures-report/

How do we justify transportation expenditures? To many people, the perception is that project decisions are made in a murky, mysterious process, or, even worse, through a political process where only the projects with the most connections get funded. Further, it is not clear to the average person what all the spending gets them. With public confidence in government at low levels, it’s more important than ever to quantify the public benefits of transportation investment and let voters know what their money is going to buy — especially when attempts are being made to raise new money for transportation to fill the gap.

Transitioning to a more performance-based system of transportation investment was one of the key reforms of MAP-21 and could represent a sea change in how funding decisions are made and our transportation system performs.

This report and recommended framework looks at the innovative DOTs and MPOs experiencing early successes in measuring the performance of their transportation system and making investments based on getting the best bang for the buck, and also lays out smart recommended goals and measures from T4America for making this transition.

Download your copy today.


Share this report with others:

email65px