


Is your state missing the bus? Evaluating state transit access and ridership
The state you live in plays a major role in the quality of transit near you. Back in February, we took a look at state financial support for transit. This post focuses on the results of those investments.
We partnered with the National Campaign for Transit Justice and the Labor Network for Sustainability to assess the quality and support of transit systems across all 50 states, the District of Columbia, and Puerto Rico.
In our first post of this series, we focused on state transit funding. But the level of funding transit has received doesn’t necessarily line up with how easily residents are able to use transit on a regular basis. To understand that piece of the puzzle, we focused on two metrics: quality of transit access and how often residents choose driving over transit.
Measuring transit access
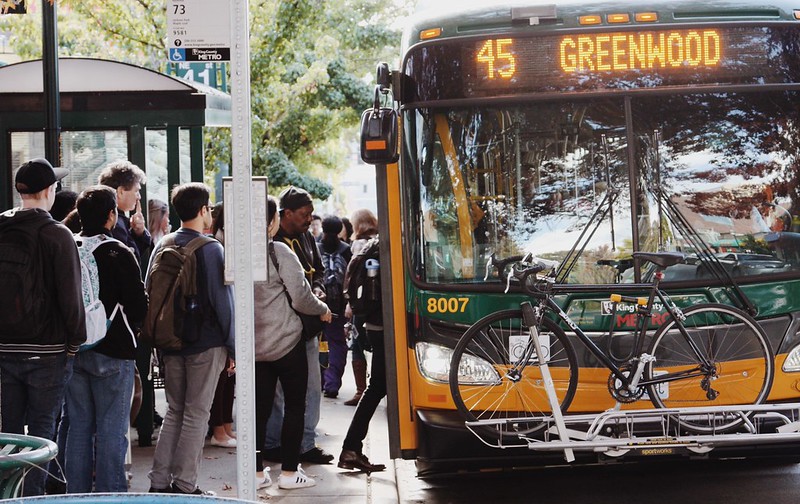
Public transit becomes a viable option only when people are able to rely on it for quick, convenient travel to their essential destinations. But, as we wrote back in 2021, while about 80 percent of people in the US live within areas classified as “urban” (which includes the suburbs of urban centers), less than 10 percent of Americans live within walking distance of reliable, high quality transit that comes every 15 minutes. And 45 percent of Americans have no access to transit at all.
To get a better understanding of transit access in each state, we took a look at data from the Environmental Protection Agency’s Smart Location Database to get a sense of how well transit was connecting people to their essential destinations. The EPA collects the number of jobs within a 45-minute drive and the number of jobs within a 45-minute transit ride. From that information, we were able to compare the number of jobs accessible by driving and the number of jobs accessible by transit.
But we couldn’t stop here. We found that some states, like New York, have dense, transit-rich cities with more jobs accessible within a 45-minute transit ride than within a 45-minute drive. This didn’t mean transit access was well-distributed across the state.
To better understand transit access for all state residents, we looked at regional parity, meaning the average person’s access to jobs by transit compared to the most transit-rich areas around them. We found that New York and Hawaii, which initially scored near the top for transit access, did not have consistently strong transit networks throughout the state.
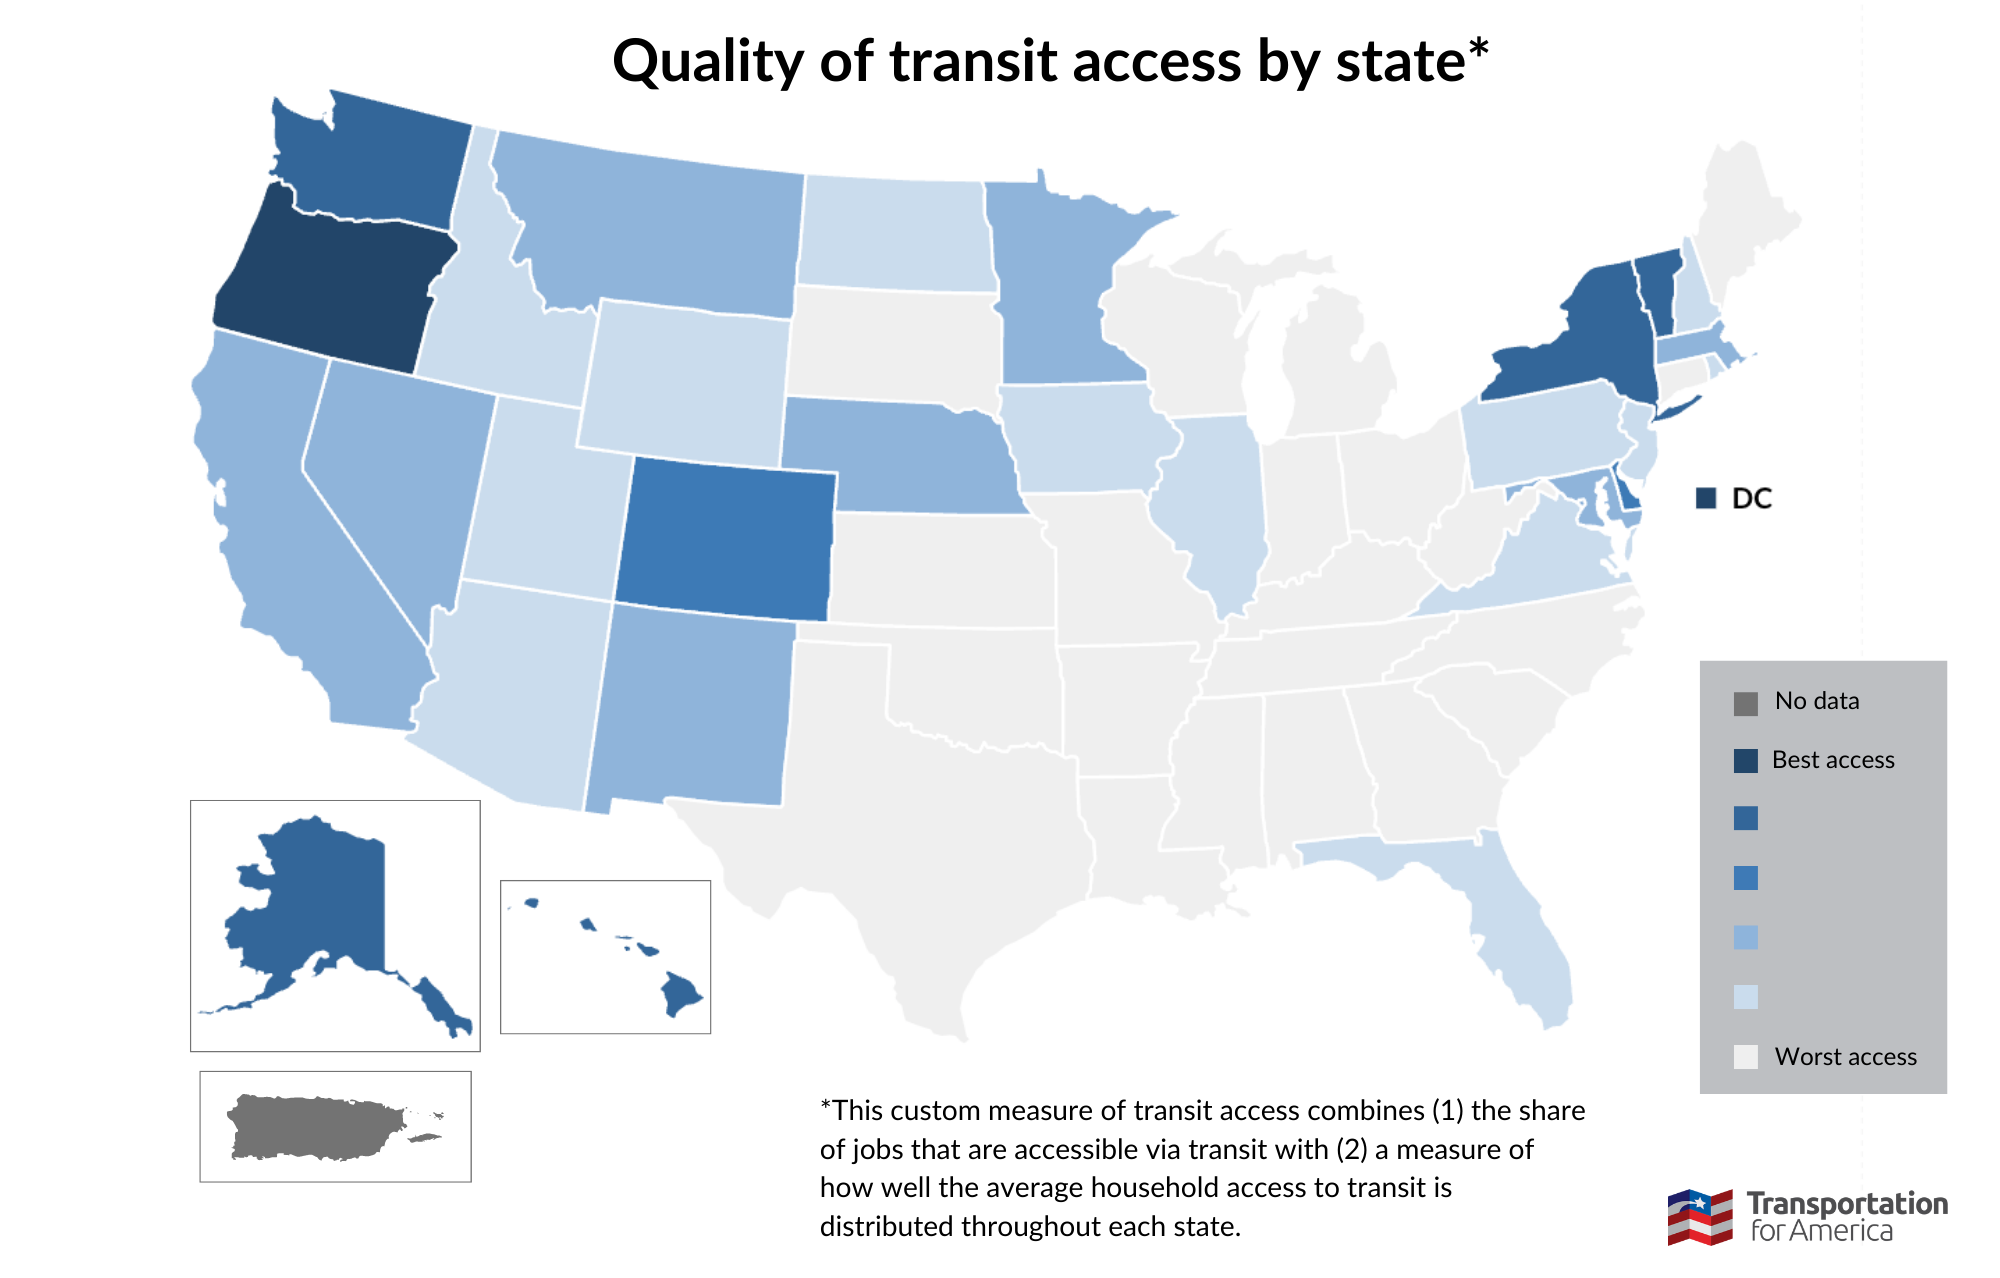
We took the average of these combined factors to determine the quality of transit access in each state, shown on the map above. Oregon and DC had the highest transit access, while 20 states (Alabama, Arkansas, Connecticut, Georgia, Indiana, Kansas, Kentucky, Louisiana, Maine, Michigan, Mississippi, Missouri, North Carolina, Ohio, Oklahoma, South Carolina, South Dakota, Tennessee, Texas, West Virginia, and Wisconsin) had the lowest access scores.
These scores don’t include Puerto Rico because the EPA’s Smart Location Database doesn’t include data on access to jobs via car or transit for Puerto Rico. The EPA, and the federal government as a whole, should work to capture this information for all U.S. territories in order to provide a stronger picture of the return on federal investments.
Transit ridership (or lack thereof)
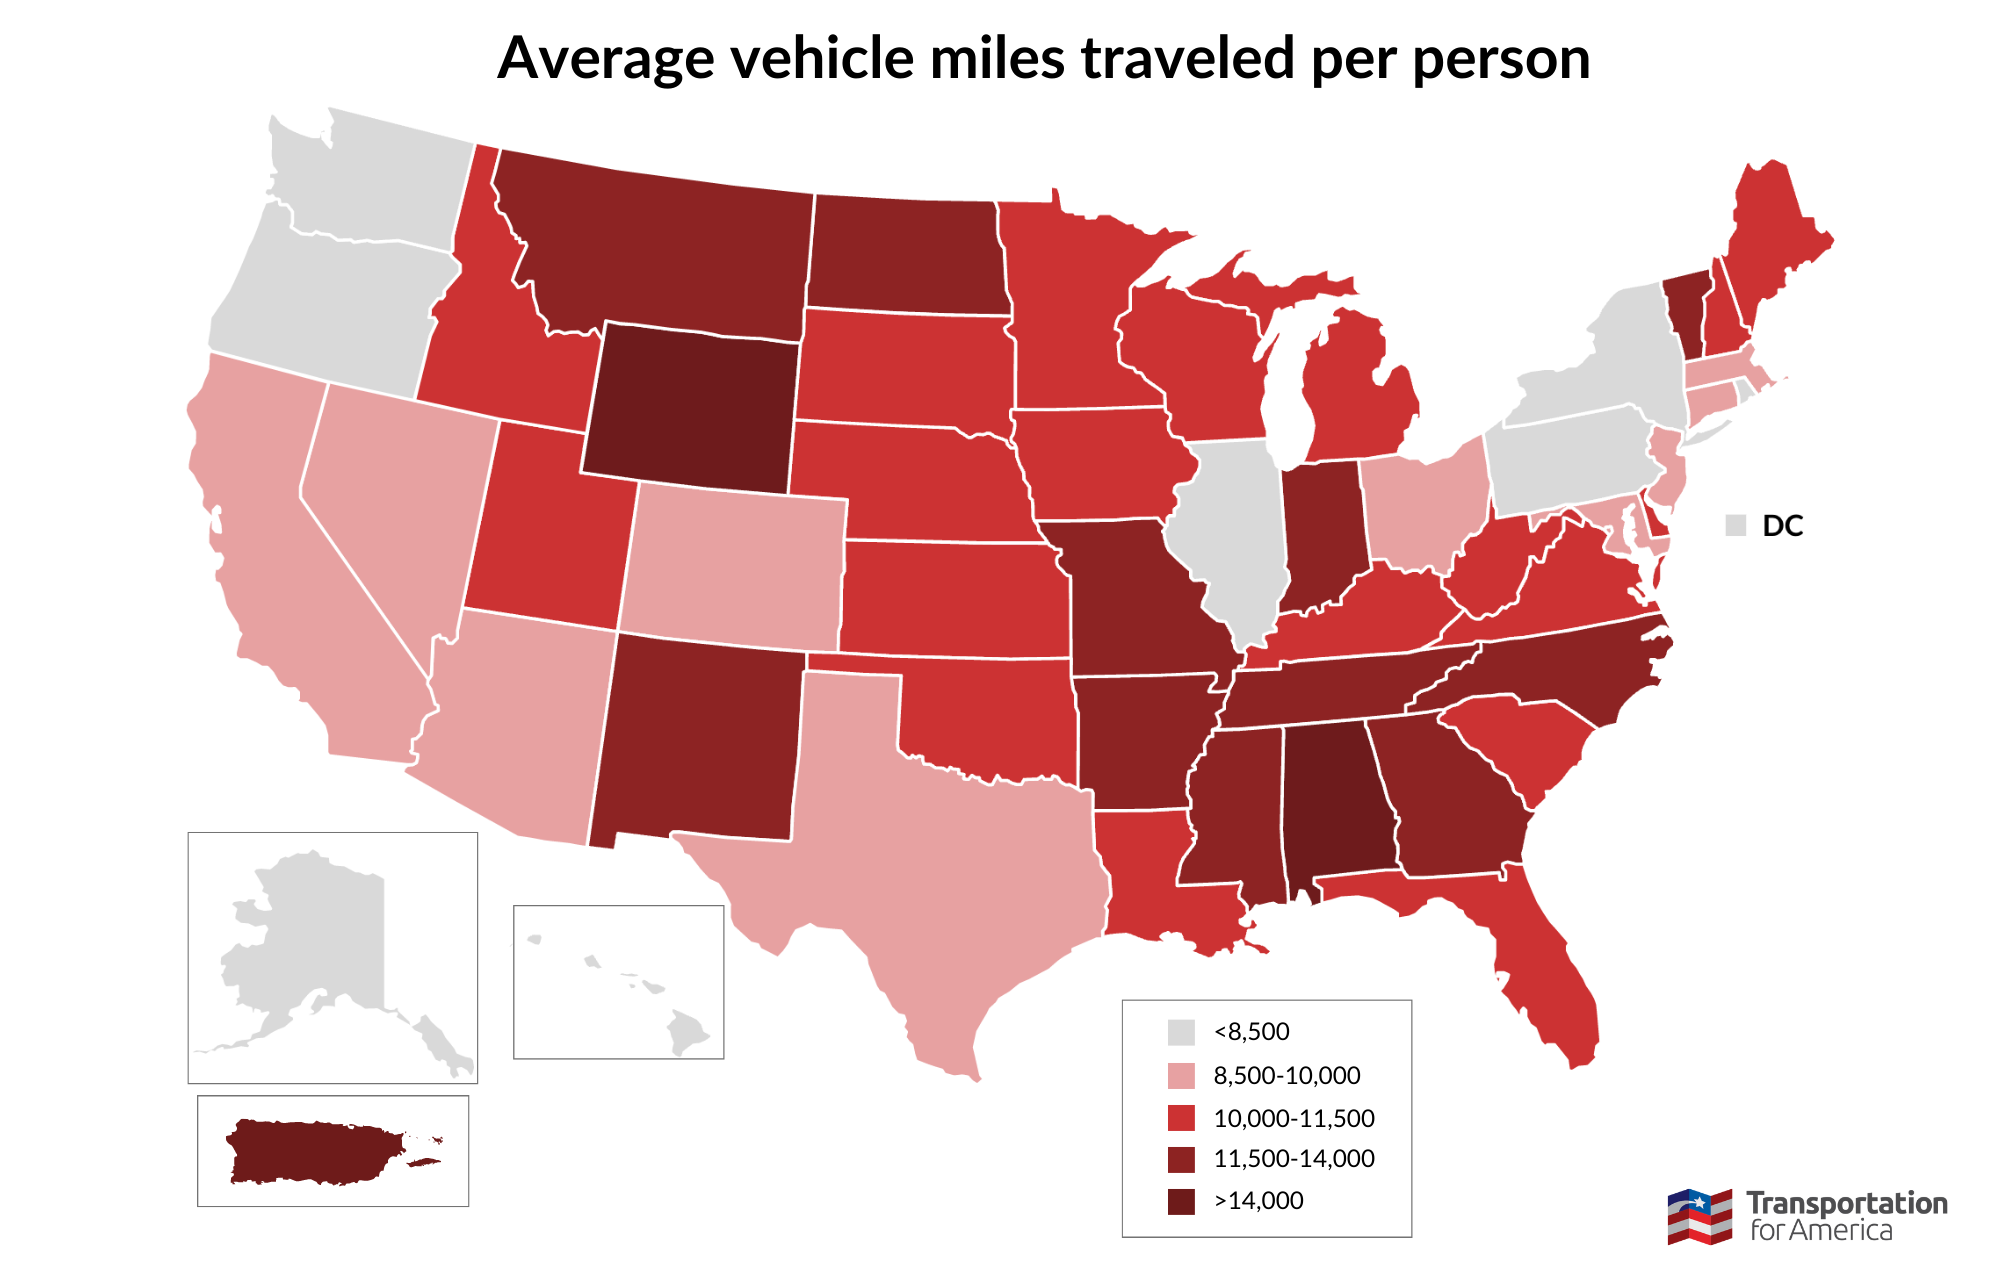
Vehicle miles traveled (VMT) is the measure of the total miles driven by all vehicles on a given state’s roadway in a given year. VMT is usually used as a measure of roadway usage, but here, it functions as a proxy measure for transit usage by measuring its inverse: car usage. We assume states with more driving on average also have less transit ridership on average.
During the COVID-19 pandemic, more people drove less often and transit ridership also dipped dramatically. To provide a more a relevant picture of travel habits, we looked at travel data from 2019.
Eight states and territories had less than 8,500 VMT in 2019, and so transit ridership in these states is likely high. They include: Oregon, Illinois, Washington, Alaska, Pennsylvania, Hawaii, Rhode Island, New York, and DC. The areas with the highest VMT (and therefore lowest transit ridership) were Puerto Rico, Wyoming, and Alabama.
What’s next?
In the final part of this series, we’ll share the combined scores for each state so you can see how your state ranks overall in transit support and availability, including the specific data we used for our analysis. Stay tuned!
Our three principles

It’s past time to elevate the national conversation about infrastructure.
Learn more about our platformLatest From The Blog

Five for ’25: What to expect on transportation…
Dec 11th, 2024

Meeting the moment after the 2024 elections
Nov 27th, 2024


A pause for TransportationCamp DC
Nov 19th, 2024

I cannot find the zoom link, I registered…
Jan 6th, 2024

A rare look behind the curtain of Transportation…
Jul 28th, 2023

In what Harrison Ford said was his most…
Jul 25th, 2023

Good example, walking to the local taco place…
Jul 24th, 2023

4 Comments