
We can’t afford to keep avoiding repair

A pothole filled with caution signs

When decision-makers fail to prioritize basic maintenance and repair, everyday Americans pay the price—in increased costs, increased time on the road, and suffering local economies. We can’t keep wasting taxpayer dollars without a clear plan to maintain what we’ve already built.

A pothole filled with caution signs
(Charlie Vinz, Flickr)

We’ve written a lot about how decision-makers justify spending money on expansions instead of repair, even when we have a $830 billion maintenance backlog on existing highways alone. The idea is that when they add a new lane, they are saving travelers time, primarily by allowing drivers to drive faster. If you’ve been following us for a while, you already know that this logic is fundamentally flawed, but let’s set that aside for a moment.

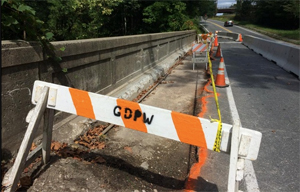
When we expand roadways at the expense of every other way to travel, we create a transportation system that all but requires owning and driving a personal vehicle for essential trips like going to work, school, or the grocery store. When we then fail to maintain those same roads and bridges, we see travel delays in the form of detours and slowed traffic—delays people must suffer through, because they have no other option.

Because the full transportation system is connected, when one intersection is rendered impassable due to poor maintenance, anyone traveling on the roadways around it can experience disruptions, even if those roads are in perfect condition. If time is money (as transportation officials like to believe), this is reason in itself to invest in more transportation options and maintain our existing infrastructure.

It gets worse

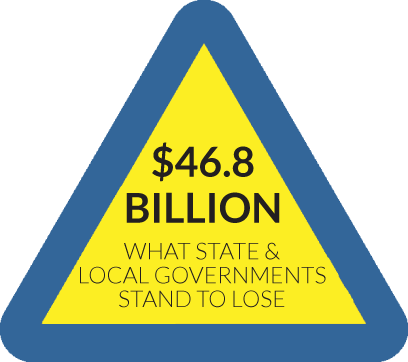
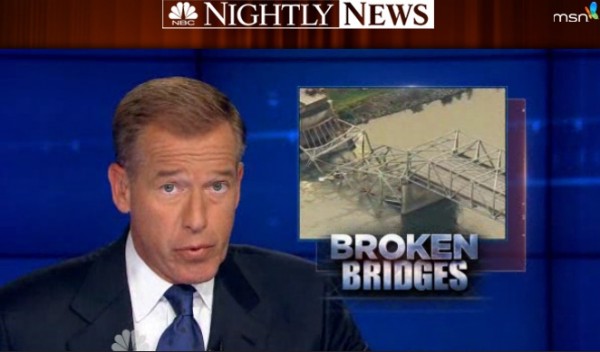
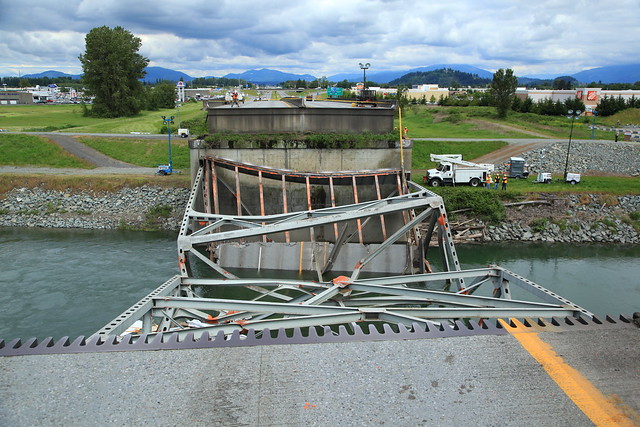
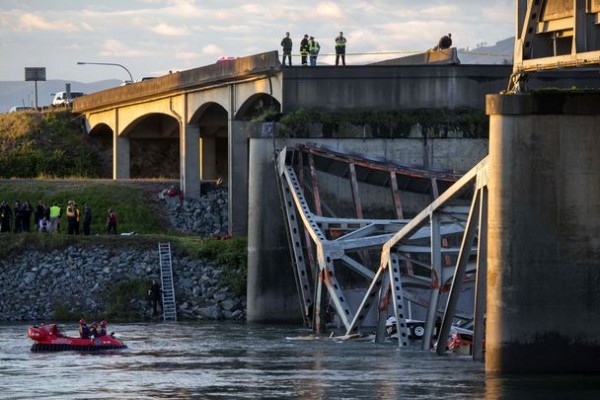
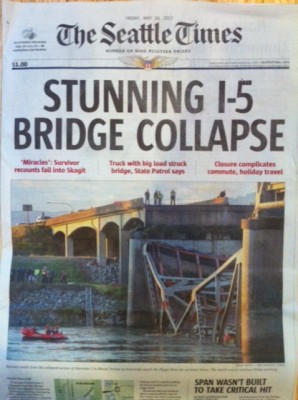
Infrastructure failures also have economic ripple effects. When bridges are closed due to maintenance concerns, changed routes can impact local businesses. Bridge collapses can cost local economies millions and disrupt national supply chains.

This doesn’t even factor in that every dollar we spend on expansion adds to our overall maintenance deficit, as new lanes and bridges have maintenance needs as well. And thanks to induced demand, new lanes often lead to more driving, which leads to even more wear and tear on our roads. These costs, too, will eventually be shouldered by taxpayers.

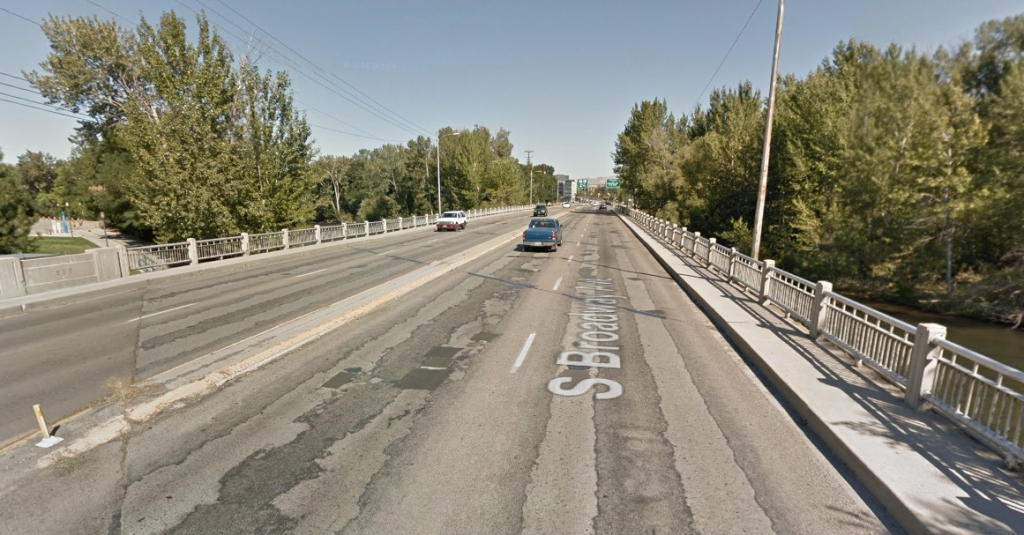
There are also real, physical costs to poorly maintained roads and bridges. When you don’t maintain the roof of your house, you end up with even more costs as water damages the interior. It’s the same with roads and bridges. Water percolates through cracked and potholed surface pavement leading to worse damage, leading to expensive rebuilds that could have been averted with proper resurfacing and minor repairs. Bridges that aren’t regularly cleaned, sealed and repainted have shorter lifespans leading to more frequent bridge replacements that are very expensive.

Costs accumulate for travelers as well. Driving over potholes risks damage to personal vehicles, which the city and state likely won’t pay. If pavement is in poor condition, risk of crashes can increase. And then there is the physical risk of driving over a poorly maintained bridge, hoping that it won’t collapse. When the Fern Hollow Bridge collapsed in Pittsburgh in 2022 due to lack of maintenance, a bus and six passenger vehicles fell with it, leading to multiple injuries. When a structurally deficient I-35 bridge collapsed in Minneapolis in 2007, 13 people died and 145 more were injured.

You could put it this way: The maintenance costs state and local decision-makers fail to address are all eventually passed on to everyday Americans—to travelers, local business owners, and workers. The costs accumulate in the form of lost time, lost income, damage to personal vehicles, and increased risk of injury. They turn into even more maintenance expenses and higher taxes down the line.

When taxpayer dollars aren’t spent responsibly, we all pay for it, over and over again.

We don’t have the money for this

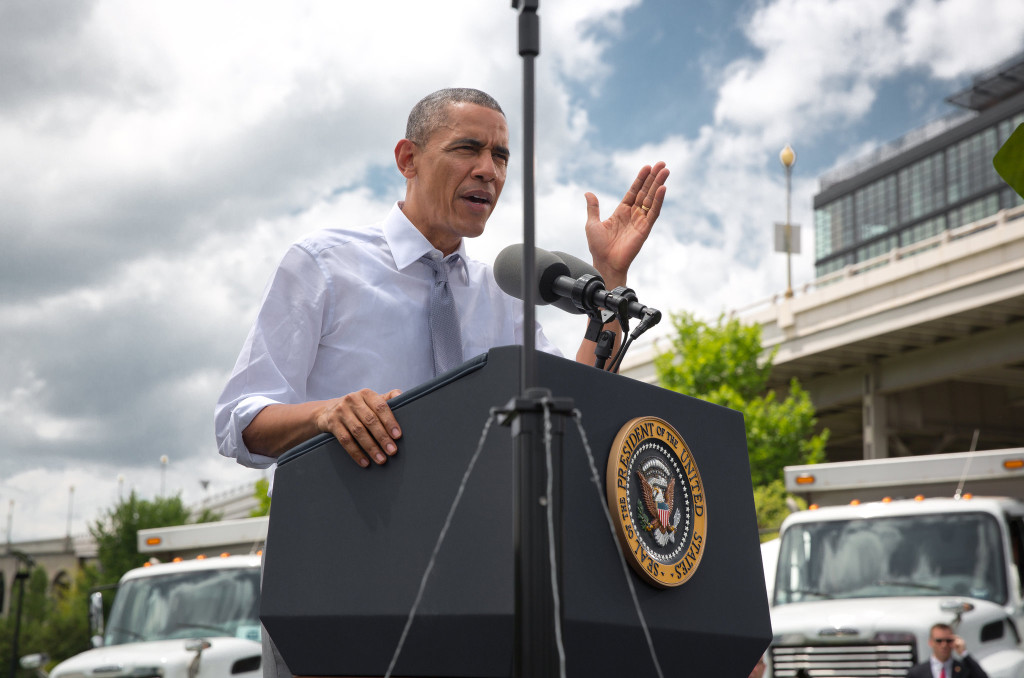
The Infrastructure Investment and Jobs Act was a historic investment in our nation’s infrastructure, but without a requirement to fix it first, a substantial portion of those funds went to more roadway expansions without any plan to maintain the roads we’ve already built. The environmental impact alone of these expansions will likely lead to even more maintenance needs in the future.

It’s unlikely we’ll see an investment like that again any time soon, which makes our maintenance needs even more concerning. In the next federal infrastructure investment, congressional leaders need to make sure that taxpayer money gets spent wisely. We simply can’t afford to keep this up.

It’s Fix It First Week

Click below to access more content related to our second principle for infrastructure investment, Fix it first. Find all three of our principles here.

  • Fix it first in practice

    One of our recently launched principles, fix it first, targets maintenance over expansion, advocating for federal highway dollars to be spent repairing old roads and bridges before expanding or building new ones. So, what would it look like in practice to implement this principle into the federal transportation program, to shift our states’ priorities away…

  • We can’t afford to keep avoiding repair

    When decision-makers fail to prioritize basic maintenance and repair, everyday Americans pay the price—in increased costs, increased time on the road, and suffering local economies. We can’t keep wasting taxpayer dollars without a clear plan to maintain what we’ve already built.

  • It’s time to stop expanding and start maintaining

    To reshape our transportation system and address staggering maintenance needs, we must prioritize repairing existing infrastructure before expanding our roadways any further.

The USDOT listened, and we thanked them for it — 1,100 times

Last Friday, with help from many of you, we delivered almost 1,100 ‘thank you’ letters to the U.S. Department of Transportation for writing strong rules to hold states accountable for the condition of their roads and bridges. 

It was an astonishing thing to see the enormous stack of letters piled up on a desk in our office. Last Thursday, just before the Friday deadline for comments, T4America director James Corless got a midday workout by hauling the box of letters across town to USDOT and ensuring that your voices were heard on the issue.

James USDOT NHPP rulemaking delivery

USDOT is working to establish a new system of performance measures to govern how federal dollars are spent via this process of draft rules and feedback.

Last year, after complaining that the USDOT’s proposed safety performance measures — the first set of measures — were far too lenient, we sent the agency 1,500 letters letting them know that the rule was not good enough. The USDOT listened and drafted much stronger rules for their second set of measures on road and bridge conditions. In the first draft, states were allowed to fail half of their targets and still receive a passing grade. But after receiving those 1,500 comments, USDOT incorporated that feedback into this improved draft rule for road and bridge conditions, requiring progress on all targets — not just 50 percent of them.  

So it was time to say thank you and let USDOT know that requiring progress across the board is just as essential for evaluating the condition of our roads and bridges.

Even third graders know that our voices matter. T4A director James Corless had to stop by his son’s classroom on his way to USDOT, and he had the giant box of letters in tow.

I had been scheduled to talk to my third grade son’s civics class about how Congress and the Administration make decisions about things like the federal budget and how much we spend on transportation. After talking a lot about the different roles of Congress and the President, one of the third graders put up her hand.

“What’s in the box?” she said.

“Those are letters to Secretary Foxx, head of the U.S. Department of Transportation,” I replied.

“Is that a petition?” another child asked.

“In a way, yes, except this time we are thanking them for listening to the public — that’s the great thing about a democracy.”

“Cool!” another third grader said.  “They’re going to have to read all of those letters, right?  Can we send some too?”

Coming up next? Measuring congestion

You (and those third graders) will have an opportunity to engage once again on this issue. Sometime this year USDOT will release their third draft rule that will include an approach for measuring congestion. Congestion is a tricky thing to measure, and most of our current analyses wildly miss the mark. As our Beth Osborne wrote back in January:

For example, is the goal of highway performance to keep traffic moving at the speed limit no matter how many cars are on it? Or is it to know that your trip today will take the amount of time you budgeted for it? If it is the former, we will have to spend a lot of money paving over a lot of places at marginal benefit to ensure a safe and efficient commute or delivery. If it is the latter, we can address the issue with a mix of more affordable operational improvements, emergency response and new capacity. In congestion, are we only interested in the speed of cars or do we give communities credit for letting their residents opt out of congestion entirely by taking transit, walking or biking?

As another example, while you might want an interstate between two cities to flow as freely as possible, some congestion on a city street in a business district might be desired as a sign that it’s a popular destination. Yet most current measures often treat these roadways the same.

We will be exploring some ideas about better ways to measure congestion here in the next few weeks, hopefully before USDOT releases their next rule, so stay tuned.

New T4America report chronicles the prevalence of Minnesota’s structurally deficient bridges

As the Minnesota legislature debates legislation to increase transportation funding, T4America released a new report looking at the prevalence of structurally deficient bridges in the state. This report is a state-level version of “The Fix We’re In For,” a report we’ve issued several times since 2011, with updated 2015 statistics for Minnesota.

Minnesota today has 830 structurally deficient bridges — bridges in urgent need of repair or replacement — representing 6.4 percent of the state’s 12,961 bridges. The average age of these sub-par bridges is 66 years — well over the typical design life of 50 years and nearly double the average age of all Minnesota bridges (35 years old). More than one in ten Minnesota bridges were built before 1948 — which means more than 1,300 bridges are older than the Korean War and creation of Medicare. Minnesota drivers collectively took close to 628 million trips over deficient bridges in 2014. That’s more than 1.7 million trips per day or almost 1,200 trips every minute taken over deficient Minnesota bridges in 2014.

With the Minnesota legislature currently debating bills right now to increase state transportation funding, something that 19 states have successfully undertaken since 2012, it’s a good time to look at the problem and what can be done to address it — especially in light of the uncertainty surrounding federal transportation funding as Congress has repeatedly failed to find stable, long-term funding for the nearly insolvent Highway Trust Fund.

Download the report to see the full summary statistics, data broken up by county, and T4America’s recommendations for Minnesota and states around the country hoping to address their backlog of structurally deficient bridges.

Hold states accountable for repairing roads and bridges – send a letter to USDOT

The U.S. Department of Transportation is in the process of writing new rules to hold states accountable for the condition of their roads and bridges. USDOT’s strong first draft rule was a step in the right direction, and we want to thank them — and ensure they don’t bow to pressure to soften these requirements.

Can you take just one minute to sign this letter to USDOT? We’ll hand-deliver a copy straight to USDOT for you.

Did you already take action? Share this action with others:

The 2012 transportation law (MAP-21) requires transportation agencies to begin using a new system of performance measures to govern how federal dollars are spent. USDOT is working to establish these new metrics for safety, the state of repair, congestion (coming soon!), air emissions and other aspects of our transportation system through an iterative process of draft rules, feedback, refined drafts and final rules.

Look, we get it: this is a wonky and arcane affair. So why should you take action and provide a comment on this pavement and bridge proposed rule? Because USDOT is truly listening to comments and making changes as a result. 

USDOT’s first rule on roadway safety wasn’t a good one, to put it bluntly, and it failed to ensure that safety would improve. Yet the thousands of comments we delivered played a part in improving it.

In that draft, states were allowed to fail half of the fatality and injury targets and still receive a passing grade. But after receiving more than 1,500 comments, USDOT incorporated that feedback into this improved draft for roads and bridges, requiring progress on all targets — not just 50 percent of them.  

Now USDOT is going to hear from the other side, those that don’t want states to be held to such high standards.  We need to let USDOT know that we support the changes they made and that requiring progress across the board is just as essential for evaluating the condition of our roads and bridges.

Between 2009 and 2011, all U.S. states collectively spent $20.4 billion annually to build new roadways and add lanes to existing roads, and just $16.5 billion annually repairing and preserving existing roads and bridges. But by 2011, after spending more than half of all highway dollars on expansion projects, just 37 percent of our nation’s roadways were in ‘good’ condition. And today, more than 260 million trips are taken each year on the country’s structurally deficient bridges.

That’s not good enough. We need to hold states accountable to meet measurable targets with our tax dollars. USDOT has drafted a better rule to make that happen, and we need your help to ensure it stays that way.

Read and sign this letter today, and we’ll deliver it to USDOT before the May 8 deadline.

Credit where it’s due: With repair rule, the feds listened to public comment

In developing new standards for ensuring our roads and bridges are kept in good condition, officials at the U.S. DOT did something skeptics would find surprising: They really listened to public comment, and reflected it in the newly released rule.

T4America's Beth Osborne

T4America’s Beth Osborne

As we have noted here often, the 2012 transportation law (MAP-21) requires transportation agencies to begin using performance measures to govern how federal dollars are spent. The U.S. DOT is working to establish those metrics for safety, the state of repair, congestion, air emissions and other aspects of our transportation system.

State DOTs and metropolitan planning organizations (MPOs) will then set their own targets for areas. They then must show how their investment plans will help them reach the targets and report on the results. If they fail to make enough progress on say, road and bridge conditions, they would be expected to spend more in those areas.

Creating this brand new system from scratch is a challenge. DOT officials have to figure out which sets of data are truly valid measures and where the data come from; how much time and wiggle room to give states and MPOs in setting and meeting targets; and what happens when they don’t.

We at T4America and many of our allies howled last year when USDOT’s first proposed performance measure, on safety, allowed states and MPOs to fail outright on half of the measures, making the targets for states virtually meaningless. T4A and the Complete Streets Coalition responded with 1500 public comments saying that this was not good enough.

We are still waiting for the full rule on safety, but with the release of this second proposed rule on system conditions (i.e. bridge and pavement maintenance) USDOT has shown that they heard us on the question of how agencies will be held to account. The new rule proposes that MPOs and states must hit all of the required targets — 50 percent success is no longer a passing grade. And states must either beat the trends or, if their target is not as good as the trend line, they must hit their target. This is a substantial improvement. Considering the current condition of the country’s infrastructure, holding states’ and metros’ feet to the fire on state of repair is critically important. As Smart Growth America’s 2014 Repair Priorities report made clear, most states are still spending billions on new roads or expanding existing ones — while neglecting their growing repair backlogs.

Between 2009 and 2011, the latest year with available data, states collectively spent $20.4 billion annually to build new roadways and add lanes to existing roads. America’s state-owned road network grew by 8,822 lane-miles of road during that time, accounting for less than 1 percent of the total in 2011.

During that same time, states spent just $16.5 billion annually repairing and preserving the other 99 percent of the system. … [In 2011], just 37 percent of roads were in good condition that year—down from 41 percent in 2008.

Under the new rule, that kind of investment decisions and resulting diminishing performance should fail to pass muster in the future.

As someone who has worked for USDOT and is accustomed to the dense documents we sometimes produced, I was struck by the clarity and tone of this (still long and technical) rule. The impact of the public comments — including those provided by T4America and our partners — was clear. USDOT explains each issue they had to grapple with, what they heard from stakeholders on each issue, the principles they used to evaluate options, how each option performed in that evaluation and then their final choice. Reading the rule felt like having a frank conversation with the experts at FHWA writing the rule.

This is especially encouraging because the third rule on congestion (and other measures) undoubtedly will be the hardest and, in many ways, the most impactful. It includes measures that are newer to the federal program and can be defined many different ways. For example, is the goal of highway performance to keep traffic moving at the speed limit no matter how many cars are on it? Or is it to know that your trip today will take the amount of time you budgeted for it? If it is the former, we will have to spend a lot of money paving over a lot of places at marginal benefit to ensure a safe and efficient commute or delivery. If it is the latter, we can address the issue with a mix of more affordable operational improvements, emergency response and new capacity. In congestion, are we only interested in the speed of cars or do we give communities credit for letting their residents opt out of congestion entirely by taking transit, walking or biking?

One thing we now know for sure: USDOT is listening to the public, so we need to engage. We thank USDOT for the improvements and for listening. It is a heavy responsibility, and one the folks at the U.S. Department of Transportation executed very nicely.

There are a couple more ways they can improve the rule further, like making more of the process available to the public. I encourage everyone to comment on the current draft.

Second proposed performance measure from USDOT makes some important improvements

You may have missed it amidst the flurry of holidays and the beginning of a new year, but after a long wait, the U.S. Department of Transportation finally released the second of three proposed rules to measure the performance of our nation’s transportation investments. Unlike the first proposed rule for safety, the news is much better this time around.

USDOT listened to the feedback offered by the public during the comment period following the first proposed rule — including more than 1,500 T4America and Complete Streets Coalition supporters — and made some important changes to this second proposed rule for measuring road and bridge conditions to increase accountability and transparency of our limited transportation dollars. (This follows on the heels of the small but incredibly meaningful change for non-motorized transportation users included in the omnibus budget passed just a few weeks ago.)

The first proposed performance measure for safety was “too weak to be effective,” allowing states to avoid taking any action to improve safety by giving them a passing grade even when they failed to meet half of the targets required in law — contrary to congressional intent in MAP-21. The American taxpayer wouldn’t accept failing grades for our schools, nor should they accept them for our transportation system.

At that point Transportation for America was worried that one of the few key reforms made by MAP-21 – performance measures and national goals – was going to become another paper-stapling exercise that would do little to actually improve how our dollars get spent.

But USDOT took the public’s advice and agreed that state DOTs and MPOs should be held accountable for meeting performance targets. Even better, USDOT makes it clear in the rule that they intend to share all performance reports submitted by state DOTs with the public — an important step toward improving the public’s trust and accountability in the nation’s transportation system.

We thank USDOT for their inclusiveness and willingness to engage the public. Along with our partners across the country, we want to build on this and ensure the public’s trust and accountability is guaranteed with the final rule.

We’ll have more details on this proposed rule and a full summary in the next few days.

A broke Highway Trust Fund means job losses equal to Denver’s population, President Obama warns

OBAMA

Speaking today at the Key Bridge in Washington, DC, President Obama called on Congress to save the Highway Trust Fund from its pending insolvency, and to adopt a long-term transportation bill on the scale of his proposed four-year, $302 billion program. [Full text here.]

In doing so, he retraced the bipartisan history of transportation funding in the U.S.:

Soon, construction workers will be on the job making the Key Bridge safer for commuters and for families, and even for members of Congress to cross. (Laughter.) This is made possible by something called the Highway Trust Fund, which Congress established back in the 1950s, and which helps states repair and rebuild our infrastructure all across the country. It’s an example of what can happen when Washington just functions the way it was supposed to.

Back then, you had Eisenhower, a Republican President; over time you would have Democratic Presidents, Democratic and Republican members of Congress all recognizing building bridges and roads and levees and ports and airports — that none of that is a partisan issue. That’s making sure that America continues to progress.

Now, here is the problem. Here is the reason we’re here in the heat. If this Congress does not act by the end of the summer, the Highway Trust Fund will run out. There won’t be any money there. All told, nearly 700,000 jobs could be at risk next year. That would be like Congress threatening to lay off the entire population of Denver, or Seattle, or Boston.

That’s a lot of people. It would be a bad idea. Right now, there are more than 100,000 active projects across the country where workers are paving roads, and rebuilding bridges, and modernizing our transit systems. And soon, states may have to choose which projects to continue and which ones to put the brakes on because they’re running out of money. Some have already done just that, just because they’re worried that Congress will not get its act together in time.

We spend significantly less as a portion of our economy than China does, than Germany does, than just about every other advanced country. They know something that I guess we don’t, which is that’s the path to growth, that’s the path to competitiveness.

We share the President’s frustration at the lack of progress, but we are encouraged by recent glimmers of bipartisan interest in a solution. Just last week we saw a bipartisan proposal for a long-term solution in the form of a 12-cent gas tax increase over two years. To us, that is far preferable to a last-minute accounting trick to get us through the election, which seems to be the betting of conventional wisdom at the moment. And it strikes us more sustainable than the one-time infusion from a tax holiday for offshore profits the Administration has proposed.

Still, we are glad to see the President use his bully pulpit to call attention to an issue that remains something of a sleeper for a public largely unaware that the trust fund that their safety, convenience and economy depend on is seriously threatened.

States already scaling back planned work for next year in anticipation of funding crisis

Congressional inaction on saving the nation’s transportation fund would have tangible impacts on projects planned for next year and beyond, forcing many long-awaited projects to halt indefinitely as soon as this summer. Numerous states are already beginning to make plans for a year where no federal money is available for new projects by scaling back plans and tentatively canceling projects.

The report we released yesterday makes it clear: Starting this fall, every dollar of gas tax revenues collected will be needed to cover the federal share of projects already promised to states, regions, and transit agencies. That means no new projects with a significant federal share will be able to get underway in the new fiscal year which begins this October.

Some states are doing their due diligence and preparing plans and budgets for next year in light of the possible reality of no new money to invest in transportation projects that require a federal share or matching funds.

Tennessee stops work on new projects 

Because of uncertainty about future federal funding, the Tennessee Department of Transportation has already halted engineering on new projects for next year (and beyond).

TDOT Commissioner John Schroer reports that with a loss of federal dollars, the department would need to pare back its plan to work “exclusively on the maintenance of our existing pavement and bridges rather than new projects.” Limited funding could jeopardize projects that many regional leaders have planned to limit congestion and maintain quality of life as population booms.

Arkansas bears up under bad bridges, needed maintenance

Ten bridge replacement, road repair and highway expansion projects set to go forward this summer have already been pulled by the Arkansas State Highway & Transportation Department because of uncertainty about federal reimbursement. Arkansas has nearly 900 structurally deficient bridges that carry a total of more than 1.5 million vehicles a day.


Those are just two of many stories we’ve heard about the real impact in states and local communities if Congress fails to rescue the nation’s transportation fund. But they need to do more than just save the transportation fund. The local leaders we’ve been speaking with have made it clear that if Congress wants support for raising more revenue for transportation, they need to give these folks at the local level more reasons to believe that it will be to their benefit.

Last week we released a policy road map showing how we can resuscitate and reinvigorate the program in exciting ways, so that it better suits the needs of people in the communities where they live. That’s a great place to start.


We’ve had terrific response already to this new report, but help us spread the word! Links to share are below, and be sure to view the report if you haven’t already.

Fiscal Cliff Promo Graphic

Download the Report

Visit the Report Home

Highlights from the great coverage of our bridge report

It’s easy to be cynical about our often frivolous media environment these days, but it is heartening to see the seriousness with which outlets of all sizes are treating reports about the need to maintain our aging bridges and other infrastructure. In addition to dozens of newspaper and web reports, more than 500 broadcast outlets have picked up yesterday’s release of the “The Fix We’re in For“, the 2013 edition of our report on bridge conditions nationwide.

Among the highest-profile, and best, TV stories was certainly this from NBC Nightly News yesterday evening that we embedded in the previous blog post. (Click to watch.)

NBC News June19

In the Washington Post, Ashley Halsey looked at the impact that deteriorating bridges can have short of actually falling down:

When big bridges collapse they make news, but it generally escapes notice when decrepit bridges just cause prices to go up on almost anything that gets to the store by truck. …

The group put out a report Wednesday that uses state and federal statistics to put a fresh face on an existing issue, and to raise a question rarely heard above a whisper in Washington because Capitol Hill hasn’t come up with a good answer to it: Where will the $76 billion come from that the Federal Highway Administration says is needed to repair deficient bridges that carry 260 million vehicles each day?

Larry Copeland, writing for USA Today, noted that Congress made changes last year in the federal transportation program, known as MAP-21, that could have a negative impact on the ability of states and localities to return the most threatened bridges to a state of good repair:

In the two-year federal transportation funding bill it passed last year, Congress eliminated a dedicated fund for bridge repair. “The upshot is that bridge repair now must compete with other transportation needs,” the report says. Money previously targeted for bridge repair was rolled into a new National Highway Performance Program, which can be spent only on highways that are part of the National Highway System, which includes interstates and major state highways. Nearly 90% of structurally deficient bridges are not part of the National Highway System.

The backlog of our country’s deficient bridges is indeed shrinking, but barely

We hope you had a chance to check out our new report released yesterday on the state of our nation’s bridges? 1 in 9 US bridges — about 66,500 in total — are rated structurally deficient and in urgent need of repairs, maintenance or even replacement.

The Fix We’re In For: The State of Our Nation’s Bridges 2013 is an updated version of the data we released two years ago, and the findings are much the same: Everyday, Americans of all different stripes drive across these deficient bridges, with more than 260 million trips taken on them each day. To put that crazy number in perspective, McDonalds’ restaurants will serve only about 64 million worldwide today. And though we’ve gotten about 0.5 percent better nationally in the last two years, from 11.5 to 11 percent deficient, that’s only a difference of about 2,400 deficient bridges.

Check out this piece from NBC Nightly News last night.

As those comments at the very end of the segment point out, we’re better off today than we were a few years ago, so that’s good, right? Well, sure, if you’re content with a rate of improvement that’s slowed to a trickle.

We once made huge progress on repairing our deficient bridges, but today, that progress has almost flatlined. Check out this chart from our report showing the reduction in the number of structurally deficient bridges per four-year period starting back in 1992.

5 - Slowing Progress repairing bridges

Starting in 1993, shortly after Congress gave bridge repair a greater focus in 1991’s transportation bill (ISTEA), we repaired about 17,000 deficient bridges over the following four years. But in the four-year period from 2009-2012, our log of deficient bridges shrank by only about 5,000 in total. That’s a rate of repair that’s almost three times slower than it was 20 years ago.

If you take a closer look at that improvement over 2011 (about 2,400 fewer deficient bridges), you’ll see that the big improvements made in just two states that heavily prioritized repair, Pennsylvania (-500) and Missouri (-640), account for almost half of that total national reduction of 2,400.

Also keep in mind that the last two years included a heavy load of stimulus spending on repair, and still progress has almost flatlined. Should we be content with hovering around 11 percent of our bridges structurally deficient? Should that be good enough? Can’t we do better?

Considering the dire budgetary straits that many states are in combined with Congress eliminating the dedicated bridge repair program last summer and forcing 90 percent of our deficient bridges to compete with all other pressing local needs for funding, could we finally see a year ahead where the backlog either doesn’t shrink much at all, or even grows somewhat? Certainly.

It’s time to #FixOurBridges, folks.

Tweet about the report, share our infographic (the chart above is included), share the photos on Facebook, and help spread the word far and wide. And don’t forget about our interactive map that lets you map all the bridges near you and locate the deficient bridges.

And Let Congress know it’s time to win the confidence back of the people and be good stewards of our existing infrastructure, before we build new things that we’ll also have to pay to maintain for decades.


Release: New report highlights mounting challenge of aging bridges, ranks states

One in 9 bridges are “structurally deficient” as the average age nears 50 years. And more troubled bridges in our big cities than McDonald’s restaurants nationwide

WASHINGTON, D.C. – One in nine of the bridges and overpasses American drivers cross each day is rated in poor enough condition that some could become dangerous or be closed without near-term repair, according to an updated analysis of federal data released today by Transportation for America.

Nearly 67,000 of the nation’s 605,000 bridges are rated “structurally deficient” and are in need of substantial repair or replacement, according to bridge inspections analyzed in The Fix We’re In For: The State of the Nation’s Bridges 2013. Nearly 8,000 are both structurally deficient and “fracture critical”, meaning they are designed with no redundancy in their key structural components, so that if one fails the bridge could collapse. The Federal Highway Administration estimates that the backlog of troubled bridges would cost $76 billion to eliminate.

The report ranks states and the District of Columbia in terms of the overall condition of the their bridges, with one having the largest share of deficient bridges, 51 the lowest. Twenty-one states have a higher percentage of deficient bridges than the national average of 11 percent. The five states with the worst bridge conditions have a share over 20 percent: Pennsylvania has the largest share of deteriorating bridges (24.5%), followed by Oklahoma (22.0%), Iowa (21.7%), Rhode Island (21.6%), and South Dakota (20.3%).

At the other end of the spectrum, five states have less than 5 percent of their bridges rated structurally deficient: Nevada and Florida lead the rankings with 2.2%, followed by Texas (2.6%), Arizona (3.2%), and Utah (4.3%).

View the report, full data, interactive map and infographic here.

“With the collapse of the I-5 bridge in Washington state last month, coming just six years after an interstate collapse in Minnesota, Americans are acutely aware of the critical need to invest in our bridges as our system shows its age,” said James Corless, director of Transportation for America. “Today, though, there more deficient bridges in our 100 largest metropolitan areas than there are McDonald’s locations nationwide.” Put another way, laid end to end, all the deficient bridges would span from Washington, DC to Denver, Colorado or from Tijuana, Mexico to Seattle — more than 1500 miles.

The need is growing rapidly, the report notes: While most bridges are designed to last 50 years before major overhaul or replacement, American bridges average 43 years old. Age is a major factor in bridge conditions. Roughly half of the structurally deficient bridges are 65 or older. Today there are nearly 107,000 bridges 65 or older, and in just 10 years, one in four will be over 65.

Congress has repeatedly declared the condition and safety of our bridges to be of national significance. However, the money to fix them is getting harder to come by with declining gas tax revenues and a fiscal squeeze at all levels of government. At the same time, Congress made the prospects for bridges even more uncertain last year by eliminating a dedicated fund for them in its update of the federal transportation program. The new law also reduces access to funds for 90 percent of structurally deficient bridges, most of which are owned by cash-strapped local governments.

“Unfortunately, the changes Congress made last year left the health and safety of our bridges to compete with every other priority,” Corless said. “When it updates the law again next year, Congress should ensure that we have both adequate funding and accountability for fixing all our bridges, regardless of which level of government owns them.”

Some in Congress have recognized the issues and are moving to address them, among them U.S. Rep. Nick J. Rahall (D-WV), the ranking member of the House Transportation and Infrastructure Committee. “Congress simply cannot keep hitting the snooze button when it comes to needed investment in our Nation’s bridges or think that these aging structures can be rehabilitated with rhetoric,” Rahall said. “That is why I am introducing legislation that provides needed federal funding to start to address the startling backlog of structural deficient and functional obsolete bridges.”

The funding uncertainty comes as the rate of bridge repair has slowed dramatically in recent years.

Investments from the stimulus and ongoing transportation programs helped reduce the share of deficient bridges from 11.5 percent to 11 percent since our last report. But the overall repair rate has dropped significantly over the last 20 years. From 1992-1996 the number of deficient bridges declined by 17,000. However, from 2008-2012 the number dropped by only 4,966 – more than three times slower.

The authors suggest several recommendations to ensure that there is both funding for safe and well-maintained bridges and accountability for getting the job done, including:

  • Increase investment: Current spending levels are precarious and inadequate. In order to bring our rapidly aging infrastructure up to a state of good repair, Congress should raise new, dedicated revenues for surface transportation programs, including bridge repair.
  • Restore funding for the 180,000-plus bridges that lost eligibility under the new federal transportation program: Under MAP-21, all of the money previously set aside for bridge repair was rolled into the new National Highway Performance Program, and only 10 percent of deficient bridges – and 23 percent of all bridges – are eligible. Congress must restore funding access for all previously eligible bridges.
  • Prioritize Repair: Congress should require states to set aside a share of their NHPP funds for bridge repair unless the state’s bridges are certified as being in a state of good repair.

View the report, full data, interactive map and infographic here.

One in 9 bridges still “structurally deficient” as average age nears 50 years

One in nine of the bridges and overpasses American drivers cross each day is rated in poor enough condition that some could become dangerous or be closed without near-term repair, according to an updated analysis of federal data released today by Transportation for America.

McDonalds vs trips on deficient bridges

New data and report: https://t4america.org/resources/bridges

Nearly 67,000 of the nation’s 605,000 bridges are rated “structurally deficient” and are in need of substantial repair or replacement, according to bridge inspections analyzed in The Fix We’re In For: The State of the Nation’s Bridges 2013. Nearly 8,000 are both structurally deficient and “fracture critical”, meaning they are designed with no redundancy in their key structural components, so that if one fails the bridge could collapse. The Federal Highway Administration estimates that the backlog of troubled bridges would cost $76 billion to eliminate.

The report ranks states and the District of Columbia in terms of the overall condition of the their bridges, with one having the largest share of deficient bridges, 51 the lowest. Twenty-one states have a higher percentage of deficient bridges than the national average of 11 percent. The five states with the worst bridge conditions have a share over 20 percent: Pennsylvania has the largest share of deteriorating bridges (24.5%), followed by Oklahoma (22.0%), Iowa (21.7%), Rhode Island (21.6%), and South Dakota (20.3%).

At the other end of the spectrum, five states have less than 5 percent of their bridges rated structurally deficient: Nevada and Florida lead the rankings with 2.2%, followed by Texas (2.6%), Arizona (3.2%), and Utah (4.3%).

“With the collapse of the I-5 bridge in Washington state last month, coming just six years after an interstate collapse in Minnesota, Americans are acutely aware of the critical need to invest in our bridges as our system shows its age,” said James Corless, director of Transportation for America. “Today, though, there more deficient bridges in our 100 largest metropolitan areas than there are McDonald’s locations nationwide.” Put another way, laid end to end, all the deficient bridges would span from Washington, DC to Denver, Colorado or from Tijuana, Mexico to Seattle — more than 1500 miles.

The need is growing rapidly, the report notes: While most bridges are designed to last 50 years before major overhaul or replacement, American bridges average 43 years old. Age is a major factor in bridge conditions. Roughly half of the structurally deficient bridges are 65 or older. Today there are nearly 107,000 bridges 65 or older, and in just 10 years, one in four will be over 65.

Congress has repeatedly declared the condition and safety of our bridges to be of national significance. However, the money to fix them is getting harder to come by with declining gas tax revenues and a fiscal squeeze at all levels of government. At the same time, Congress made the prospects for bridges even more uncertain last year by eliminating a dedicated fund for them in its update of the federal transportation program. The new law also reduces access to funds for 90 percent of structurally deficient bridges, most of which are owned by cash-strapped local governments.

We’ll have much more later today, but don’t miss the new data, new report, new interactive map and infographic over at the home for the bridge report.


About those 66,000+ deficient bridges: What did last summer’s transportation law change?

With the second collapse of an Interstate bridge in six years, Americans might expect Congress to leap into action to ensure adequate funding for bridge rehab and replacement. But as we have reminded numerous reporters since an I-5 bridge dropped into Washington’s Skagit River, federal lawmakers took a gamble and eliminated the nation’s dedicated bridge fund last summer. 

Photos of the I-5 Skagit River Bridge
I-5 photo by the Washington DOT on Flickr.

The bridge fund came into being in 1991, and especially in the first decade afterward, the country made enormous progress repairing deficient bridges. But that progress had slowed to a trickle when Congress took up the transportation funding bill, MAP-21, last summer.

With the I-35W collapse fresh in our minds and progress on repairing deficient bridges slowing, many assumed Congress would think about ways to make bridge repair more of a priority.

Not quite.

Instead, they took a gamble, eliminating the dedicated repair fund so that states could “set their own priorities,” as long as they promised to set targets for the repair of bridges on the National Highway System. That sounds great in principle, until you remember that competition for funds is growing rapidly, with no corresponding drop in the political pressure to build pet projects.

Though they won’t say it out loud, many DOT chiefs like a dedicated maintenance fund because it allows them to say “no” to projects they can’t afford, while helping to ensure existing facilities stay safe and functional. The changes in MAP-21 also don’t give similar attention to bridges not on the National Highway System – 90 percent of all bridges in need of repair – more on this below.

T4America has been a strong advocate of measuring performance against clear targets and goals. But for something as critical as bridge maintenance, there needed to be a well-considered transition period to understand how the new performance management system works, and establish clear targets and guaranteed enforcement mechanisms.

Instead, Congress scrapped the existing bridge repair program and directed USDOT to work with states to cooperate on setting measurable targets for things like bridge condition — but without significant penalties for failure. And considering that MAP-21 is only a two-year bill, states won’t be reporting on these measures until after this bill has already expired.

The second big change made last summer will force state and local communities into painful choices about priorities.

Before MAP-21, all 600,000+ highway bridges were eligible to receive funding for repair under that dedicated bridge repair program.

From the biggest interstate bridge down to that crucial bridge that connects your town across the river to another nearby town, all 66,500-plus deficient bridges could get the dollars dedicated for bridge repair.

Under MAP-21, Congress decided to focus the former bridge repair dollars almost exclusively on a narrow set of roadways known as the National Highway System (NHS). Think of the NHS as the interstates, state highways and most major four-lane and larger highways. The bridges on these roads are our most heavily traveled, no doubt, but they represent only about 10 percent of all structurally deficient bridges.

The other 90 percent will now have to compete with all of the other transportation needs in your community for the flexible funding that can be used on almost anything. And all of those needs will compete for less funding too, reduced from about 60 percent of all funding to 40 percent.

Bridge repair is added into the mix of choices along with regional transit investments, safe streets for all users, congestion relief, other transportation options, and other road repair — leaving communities with tough choices to make.

Bridges STP NHPP

—-

All this comes as our transportation network begins to show its age. At an average age of 43 years, the typical bridge is nearing the end of its 50-year design life, and many thousands are far older than that. Structurally deficient bridges are more than 20 years older on average.

The federal government should be all about making sure that bridges are being systematically upgraded, repaired or replaced. And in the wake of a calamity like the closure of a key commercial corridor, we Americans ought to be all about letting Congress know we’re willing to pay for a safe and secure transportation network, and making lawmakers pay at the ballot box if they won’t deliver it.

Bridge collapse in Washington captures national attention

Unsurprisingly, the sudden collapse of the 58-year-old Interstate 5 bridge over the Skagit River in Washington state last Thursday night captured the attention of the country and virtually all major national news outlets. Just like in the days after the Minnesapolis I-35W bridge collapse — though mercifully no one died in this incident — reporters scrambled to understand the issue of bridge condition and asked the same question: “how could this happen, and could it happen again somewhere else tomorrow?”

T4 communications director David Goldberg was on site in Washington and did several interviews on television from the bank of the Skagit River to talk about America’s aging bridges and the 66,000-plus that are structurally deficient across the country.

CNN’s Jake Tapper took up the issue head-on with a live interview on The Lead Friday evening (ignore the Arrested Development video thumbnail…):

TAPPER: The American Society of Civil Engineers gave a C-plus to the 600,000 bridges in the U.S.; 11 percent of them are considered structurally deficient. How worried should Americans be when they drive across bridges?

GOLDBERG: Well, the worry is not so much that they will collapse like this with a lot of frequency, but the problem is that the system is aging and it’s aging pretty rapidly. The typical bridge out there was designed to last 50 years and the average age is 44.

And if you look at the bridges that are structurally deficient, the one in 10 bridges that are rated as structurally deficient, something like the typical age of those is 65 years. And that’s going to be — we’re going to have 65-year-old bridges coming every year from now — now on, because we have been building them like mad since the 1950s. And we frankly haven’t been keeping up with them like we should.

TAPPER: And, David, what should the government be doing that in your view they are not doing enough?

GOLDBERG: Well, there’s a couple things that have happened in recent years that Congress in particular needs to pay attention to, because it’s federal money that pays for the big bridges like this across the country.

And they are the ones that stand to hurt us the most if they fall or if we have to close them. And one thing is that we have to recognize the gas tax receipts are going down. We’re getting more fuel- efficient cars and people are driving less, so we have to figure out a way to replace a lot of that money.

And the other thing that has happened in the last year or so is that Congress actually eliminated the fund that was dedicated to bridge repair and sort of said to states, well, you know, you just decide whether they should be fixed or not. But the problem is we have got political pressure to build a lot of the new projects, which competes with that repair money.

So you get situations like this where bridges should have been replaced. They’re not going to be unless we have a dedicated fund.

TAPPER: So, it sounds like you’re saying that the people who make these decisions need to be a little bit more focused on rebuilding and restrengthening things that already exist, as opposed to pursuing new projects?

GOLDBERG: Well, we certainly need to fix things before we build the new stuff that we can’t afford to maintain. So, we have got to get the money together to fix the things and we have got to make it a priority to fix them, because this can’t happen in America.

And NBC Nightly News also led off their Friday evening coverage with the bridge collapse story.

Have you seen another interesting story on the bridge collapse and what it means for transportation policy in your state or nationally? Send it our way via email or in the comments below.

And in case you still haven’t seen it yet, don’t miss our interactive map (and 2011 report) that allows you to search by address and see the status of all bridges around any U.S. address, with inspection data and sufficiency ratings. We’re hoping to update the map and the report in the coming weeks, so stay tuned.

Tragic bridge collapse in Washington highlights urgent problem of aging and deficient US bridges

For Immediate Release
Contact: Stephen Davis
202-955-5543 x242
202-569-8218
steve.davis@t4america.org

or David Goldberg
202-412-7930

Transportation for America issued the following statement following last night’s collapse of the Interstate 5 bridge over the Skagit River near Mount Vernon, Washington.

“The shocking collapse of a busy Interstate 5 bridge over the Skagit River in Washington State highlights the issue of our country’s aging bridges and what we’re doing to address them. Thankfully, no one was killed or even seriously injured in this collapse, which could not be said about the last high profile bridge collapse in Minnesota.

Nationwide, more than one in ten bridges is rated structurally deficient, in need of close monitoring, urgent repairs, rehabilitation or replacement. We take more than 260 million trips over deficient bridges each day. In just our 102 largest metro areas alone, there are more deficient bridges than there are McDonald’s restaurants in the entire country, 18,000 versus 14,000.

While this particular bridge was not considered structurally deficient at the time of its collapse, it is one of thousands that are well past their intended lifespan and carrying far more traffic than intended at the time they were built. The typical bridge is 43 years old with a design life of 50 years.

Considering that progress on repairing deficient bridges has slowed in the last ten years, Congress took a major gamble in last summer’s new transportation law (MAP-21) by eliminating dedicated funding for repairing highway bridges. Now bridge repair is forced to compete with other transportation needs for funding.

At the same time, our chief source of repair dollars – the federal gas tax – is declining as Americans drive more fuel-efficient cars and fewer miles. Congress urgently needs to address both our funding priorities and how we will pay for them in the face of an aging system and growing population, before the next preventable bridge collapse strands commuters, cripples a local economy and claims lives.”

58-year-old bridge collapses in Washington State on west coast’s most major interstate

Shortly after the evening commute last night (around 7 p.m. local time) an entire section of the Interstate 5 bridge  — both north and southbound lanes — over the Skagit River an hour north of Seattle, Washington collapsed and fell into the river, sending two cars tumbling down into the river, injuring three yet miraculously killing no one. One of those who plunged into the river along with his wife called it a “miracle” that no one was killed or more severely injured.

From the Seattle Times:

Rescuers pulled three people with minor injuries from the water after the collapse, which authorities say began when a semitruck with an oversized load struck a steel beam at around 7 p.m.

That caused a massive piece of the northern side of the bridge to wobble, and then fall into the water, taking with it a gold pickup, its travel trailer and an orange SUV.

Rescuers did not believe there was anybody else in the water but were planning a morning search to be sure.

Seattle Times Bridge Collapse
Seattle Times photo by Dean Rutz. Link to gallery of images here.

Perhaps the most amazing part of this story is that on a bridge that carries more than 70,000 cars daily and at a time of day when traffic could be expected to be moderate at the least, only two vehicles fell into the yawning gap and into the water. Along with everyone else, we at T4 America are relieved that no one died in this tragic bridge collapse.

Just like several years ago in Minnesota, attention quickly turned to the bridge itself. So what do we know about it today?

The Interstate 5 bridge over the Skagit River actually predates the creation of Interstate 5. It was built to carry old US 99 over the river in 1955. When Interstate 5 was built in 1957, it largely followed the US 99 corridor and just like many other bridges, this bridge was folded into the interstate system, though it certainly wasn’t built to today’s interstate standards.

Because of that (and likely other design considerations), the bridge was considered “functionally obsolete” by state and federal inspectors, which is a designation that could mean any number of things, none of which have anything to do with structural safety. The lanes could be narrower than today’s standards, the weights allowed could be less than an interstate bridge built today, or built using materials that would be considered obsolete today.

However, the bridge was not considered “structurally deficient” at the time of collapse, which means that a bridge requires repair, rehabilitation or replacement, along with much more regular inspections. To be considered structurally deficient, one of the three major components of a bridge (deck, superstructure, substructure) has to score a 4 or below on a scale of 1-10.

The data in our interactive map is not the most recent release of federal data, but the ratings for this specific bridge have not changed in the federal National Bridge Inventory that was reported in early to mid 2012 by Washington State. WSDOT likely inspected the bridge again sometime in 2012 after they reported annual bridge data to the federal government, and WSDOT is saying publicly today that the bridge was not structurally deficient and was still only considered functionally obsolete.

Here’s the snapshot from our interactive map of U.S. bridges, which you can use to look up the condition of the bridges near any U.S. address.

Skagit bridge collapse interactive map screenshot

(Amazingly, you can see that Google Maps has already updated their map to show that Interstate 5 no longer crosses the Skagit River.)

On a list of structurally deficient bridges in Washington compiled by WSDOT in September 2011, this bridge is not included, though there is at least one other nearby Interstate 5 bridge in Snohomish County that is included, built in 1933. (It’s scheduled for repair, per WSDOT.)

It’s hard to accurately describe how crucial this interstate connection is. I-5 runs from Canada to Mexico within the U.S. and touches almost every single major city on the west coast. It’s a vital corridor not only commuters but also for freight traffic — 12 percent of the daily traffic on this bridge was truck traffic. And this is the main route from Seattle up to Vancouver, certainly a direction that many Seattle region residents might have been planning to travel for the long holiday weekend starting this afternoon.

Those plans are surely on hold, and the ripple effect for freight and other travel up and down the west coast will be felt for some time to come as Washington authorities decide how to handle this painful gap in their transportation network.

We will be back later this morning with a short statement, and follow us along on twitter at @t4america for other news and developments.

PS, here’s the cover of the Seattle Times this morning.

Seattle Times bridge collapse cover

Update: this post incorrectly said the bridge 63 years old at first publication. That has been corrected.

AP says attacks on transportation enhancements are “exaggerated and misrepresented”

On Friday, we highlighted the disingenuous attempt from some in Congress to tie the need to repair our bridges to the elimination of a tiny program to make it safer to walk or bike on our streets and roads.

Senators Rand Paul of Kentucky, Tom Coburn of Oklahoma and John McCain of Arizona have been targeting the transportation enhancements program, a mere 2 percent of the federal transportation budget. They say eliminating the set-aside would make it easier for states to repair bridges, even though many states have failed to prioritize maintenance when they can spend the bulk of their transportation funds however they want.

The Senators and their supporters seem to have gotten a good chuckle out of some particular projects. They point to, among others, roadside snack stand in Pennsylvania shaped like a giant coffee pot and a lighthouse renovation in Toledo, Ohio.

“We picked some of the more interesting and exciting ones to get our colleagues’ attention,” McCain reportedly admitted.

But exciting as they might be, the claims about the projects are “exaggerated and misrepresented,” according to a fact check feature in the Associated Press this past weekend.

That roadside coffee pot? AP’s Joan Lowy reports:

No transportation aid was spent on the coffee pot’s $100,000 restoration, said Olga Herbert, executive director of the Lincoln Highway Heritage Corridor. The money was raised entirely from preservation and civic organizations and local supporters”

“We did not use any of this $300,000 award for anything to do with the coffee pot,” she said. “It’s interesting that nobody from Senator Coburn’s office called me about this.”

As for the lighthouse in Toledo:

Actually, no transportation dollars have been authorized or awarded. The lighthouse renovation is among projects community officials tentatively hope to get around to in 2019.

Senator Paul has also repeatedly cited a supposed “turtle tunnel” project. But the project he referenced on U.S. 27 in Florida was a significant safety issue for motorists, many of whom were forced to swerve when alligators, turtles and other creatures crossed the highway from adjacent Lake Jackson. While Coburn claimed the project would require $6 million or more to finish on an undefined timeline, in fact, USDOT told Lowy the project was completed in September 2010 at $3 million, under budget and $3 million less than Senator Coburn claimed.

Streetsblog Capitol Hill has more.

The takeaway? At the least, members of Conrgess should do a better job fact-checking. While they’re checking the numbers, they might look to see how long it would take to repair bridges relying solely on this relatively tiny share of funds. It would take Paul’s home state of Kentucky 66 years of bike and pedestrian funding to achieve a state of good repair for their bridges. Pennsylvania wouldn’t catch up until sometime during the 24th century.

Safe to say, this isn’t the serious proposal for bridge repair that we urgently need. If Paul, Coburn and McCain are serious about fixing bridges and not just scoring political points, they’ll come back with something better.

Photo courtesy of the Associated Press.

Late update: Senator Rand Paul’s amendment to cut money for walking and biking and direct it to bridge repair failed in the Senate today, by a 60-38 count.

A real plan to fix bridges, or a reprise of attacks on pedestrian safety?

Our reports calling attention to our nation’s deficient bridges have gained enormous traction in recent weeks, to the point that members of Congress and the White House are citing our data in demonstrating the need for infrastructure investment. Unfortunately, some are using them to make disingenuous attempts to eliminate a small program they’ve been trying to put on the chopping block for years.

A New Trail Originally uploaded by M.V. Jantzen to Flickr.
Safe travels for people on foot, on bike and in cars on the new Wilson Bridge in Washington, D.C. Should we really have to choose?

The small Transportation Enhancements program represents less than 2 percent of all transportation funding, and more than half of that 2 percent is used to help make walking and biking safer — a worthy expenditure considering 10 percent of trips are taken on foot and 47,700 people on foot were killed from 2000-2009.

Senator Rand Paul is expected to offer an amendment next week to take all of the TE money and put it toward bridge repair. And a handful of others in Congress have been trying to kill this program for years, well before the current talk of austerity.

Sen. Paul’s proposal doesn’t represent a sincere plan to repair our bridges, but unfortunately, a handful in the media are still taking the bait.

The question is this: With the nation facing a transportation crisis that has gotten little attention outside of policy wonks and Washington, should the federal government continue to mandate that states spend federal dollars on pedestrian safety, bicycling trails, landscaping and historic preservation?

When you ask the wrong question, you often get the wrong answer. And this question in particular has been manufactured by those who would capitalize on the sense of urgency about our bridges to eliminate a program they’ve been after for years.

We’ve covered before how the money spent on walking and biking safety won’t actually do anything to address the bridge backlog. It would take Kentucky 66 years of bike/ped money to fix all of the bridges that are deficient today. And as we wrote in National Journal, “So what if we decided to ignore the significant safety issues faced daily by pedestrians and cyclists, and spent that money instead on bridge repair as some have suggested? We could indeed fix all the currently deficient bridges in the state of Missouri, for example. We’d just need to be patient because it would take 82 years. The State of Washington could get to its backlog in 164 years. And Pennsylvania could finish up with its deficient bridge list at the start of the 24th century.”

Raiding these safety funds to fix our bridges is like trying to stop a freight train with a BB gun. Beyond that, it’s false — and cruel — to suggest that we have to even decide between safety on our bridges and safety on our streets.

We have often pointed out the fact that states have the flexibility to spend up to half of their bridge repair money elsewhere, regardless of the condition of their bridges. But they also have the flexibility to spend most of their Surface Transportation Program dollars, usually the biggest pot of transportation funding, on almost anything they want. They could fix bridges, build transit, highways, bridges, sidewalks; it’s all eligible, and totally up to the states for how they spend it. No mandates from Washington.

Despite false assertions that we require states to build museums or turtle tunnels instead of repairing their bridges, there’s nothing stopping states from getting on top of their deficient bridges. Just like nothing has stopped Florida from spending their TE money each year while also setting up a bridge repair program to target funds first and foremost to bridges that need attention, resulting in some of the best bridges in the country. Meanwhile, Senator Paul’s state of Kentucky, with more than 2,700 deficient bridges, spends $6.50 on new highway capacity for every dollar they spend on bridge repair.

We don’t have to choose between being safe when we walk or being safe when we drive over a bridge. Anyone who tells you otherwise has their own agenda; an agenda that has very little to do with actually repairing our bridges.

It’s time for serious proposals from Congress to fix our crumbling bridges and infrastructure, rather than making a large percentage of people less safe in the name of grabbing a few extra bucks for our bridges.

Along these lines, a good step would be Senator Cardin’s “Preservation and Renewal of Federal-Aid Highways Act.” Tell your Senators to support this important piece of legislation.

Events across the country last week bring sense of urgency to bridge repair

Many communities are taking a close look at Transportation for America’s deficient bridge rankings by metro areas released last week. People are telling their representatives to invest in our infrastructure — and Washington is listening, with President Obama and rank-and-file members of Congress expressing urgency about repairing our crumbling assets.

At an event held at the Route 16’s Mabscott Overhead Bridge in Beckley, West Virginia, (pictured right) Representative Nick Rahall made a strong case for repair while surrounded by labor partners carrying “America wants to work” signs. The local NBC, ABC and CBS affiliates were on hand, alongside the Associated Press and Beckley Register-Herald, the region’s largest daily newspaper.

“It should not take a major catastrophe to bring this home to America. This horrific and tragic example shows how America’s decaying infrastructure is a disaster waiting to happen,” Rep. Rahall said, citing past tragedies that could have been prevented with greater foresight and investment

Rahall added that putting Americans to work was also a “deficit reduction issue” because it means more people paying taxes and putting money back into the economy.

Gary Zuckett, executive director of West Virginia Citizen Action and T4 America’s chief organizer in the state, played a key role in making the event happen.

IMG_3536At a similar event under a 78-year-old bridge at Chicago’s Lakeshore Drive and Wilson Ave. last Wednesday, Representative Jan Schakowsky joined labor groups, the Illinois Chamber of Commerce and other groups in highlighting unsafe bridges in their area. The local affiliates for ABC, CBS and FOX all picked up the story, alongside print media and several blogs.

“Don’t my colleagues and their families and their children drive over bridges like this? Isn’t this a priority?” Schakowsky, a Democrat from Illinois’ Ninth Congressional District, said during the event. Brian Imus, the state director of Illinois Public Interest Research Group, pictured at the lectern, also addressed members of the press and public.

West Virginia has more than 2,500 bridges rated as structurally deficient, while Illinois has more than 2,200.Portions of West Virginia are also part of the Washington, DC metropolitan area, which has 215 structurally deficient bridges, or 5.7 percent of total bridges.

9.4 percent of the bridges in the Chicago-Naperville-Joliet metropolitan area are structurally deficient, for a total of 481 deficient bridges.

The deficient bridges in our largest 102 metro areas carry three-quarters of all traffic that crosses a deficient bridge each day. Check out how your area stacks up here.

New Report Ranks Deficient Bridges by Metro Areas

A new look at structurally deficient bridges in metropolitan areas finds that just a quarter of U.S. bridges, located in our largest metropolitan areas, carry 75 percent of all traffic crossing a deficient bridge each day.

Click to learn more or download the full report, which includes data for all 102 metropolitan areas over 500,000 people.

On the heels of the sudden closure of a major commuting bridge in Louisville, KY, a new report shows that more than 18,000 of the nation’s busiest bridges, clustered in the nation’s metro areas, are rated as “structurally deficient,” according to this new report from Transportation for America.

In Los Angeles, for example, an average 396 drivers cross a deficient bridge every second, the study found. The Fix We’re In For: The State of Our Nation’s Busiest Bridges, ranks 102 metro areas in three population categories based on the percentage of deficient bridges.

The report found that Pittsburgh, PA had the highest percentage of deficient bridges (30.4 percent) for a metro area with a population of over 2 million (and overall). Oklahoma City, OK (19.8 percent) topped the chart for metro areas between 1-2 million, as did Tulsa, OK (27.5 percent) for metro areas between 500,000-1 million.

At the other end of the spectrum, the metro areas that had the smallest percentage of deficient bridges are: Orlando, FL (0.60 percent) for the largest metro areas; Las Vegas (0.20 percent) for mid-sized metro areas; and Fort Myers, FL (0.30 percent) for smaller metro areas.

“There are more deficient bridges in our metropolitan areas than there are McDonald’s restaurants in the entire country,” said James Corless, director of Transportation for America, 18,239 versus roughly 14,000 McDonald’s. “These metropolitan-area bridges are most costly and difficult to fix, but they also are the most urgent, because they carry such a large share of the nation’s people and goods.”

Nearly 70,000 bridges nationwide are rated “structurally deficient” and are in need of substantial repair or replacement, according to federal data. Metropolitan-area bridges carry 75 percent of the trips that are made on structurally deficient bridges, he noted.

The Federal Highway Administration (FHWA) estimates that the backlog of potentially dangerous bridges would cost $70.9 billion to eliminate, while the federal outlay for bridges amounts to slightly more than $5 billion per year.

“The recent shutdown of the Sherman-Minton Bridge between Kentucky and Indiana was yet another reminder of the urgent need to repair our nation’s bridges,” Corless said. “A sincere initiative to fix these bridges would put thousands of people to work while ensuring that these critical links continue to carry people safely to work and that goods can make it to market, now and well into the future.”

Congress has repeatedly declared the condition and safety of America’s bridges to be of national significance. However, the current federal program falls short of the need, even as it allows states to shift funds from maintenance toward new construction, whether or not they can show progress toward rehabilitating deficient bridges.

Some states have worked hard to address the problem and have seen their backlog of deficient bridges shrink in number. However, two problems continue to persist: Existing federal programs offer no real incentives or assurances that aging bridges will actually get fixed; and the current level of investment is nowhere near what is needed to keep up with our rapidly growing backlog of aging bridges.

Last month, President Obama introduced his jobs bill before the Brent Spence bridge in Cincinnati, OH, just weeks after engineers shutdown the Sherman-Minton Bridge due to cracks in the bridge supports, and also identified potential faults in the nearby Kennedy Bridge. Since then, the President has regularly highlighted the poor state of our nation’s bridges and the need to pass a jobs bill that will put construction workers and engineers back to work repairing our bridges and highways.

“The poor condition of our bridges is a problem that is not going away,” said Andy Herrmann, president-elect of the American Society of Civil Engineers, “Most of the nation’s bridges were designed to last 50 years, and today, roughly a third are already 50 years or older.”

In order to prevent future catastrophes on our nation’s roads and bridges, the report recommends that Congress should:

  • Provide states with increased resources to repair and rebuild. States need federal support to back their efforts to prioritize repair and maintenance.
  • Ensure that funds sent to states for bridge repair are used only for that purpose, unless a state can show it has addressed its repair needs.
  • Require that new or rehabilitated be built so that they are safe for everyone who uses them, whether they are in vehicles, on foot or bicycle, or using public transit.