The backlog of our country’s deficient bridges is indeed shrinking, but barely
We hope you had a chance to check out our new report released yesterday on the state of our nation’s bridges? 1 in 9 US bridges — about 66,500 in total — are rated structurally deficient and in urgent need of repairs, maintenance or even replacement.
The Fix We’re In For: The State of Our Nation’s Bridges 2013 is an updated version of the data we released two years ago, and the findings are much the same: Everyday, Americans of all different stripes drive across these deficient bridges, with more than 260 million trips taken on them each day. To put that crazy number in perspective, McDonalds’ restaurants will serve only about 64 million worldwide today. And though we’ve gotten about 0.5 percent better nationally in the last two years, from 11.5 to 11 percent deficient, that’s only a difference of about 2,400 deficient bridges.
Check out this piece from NBC Nightly News last night.
As those comments at the very end of the segment point out, we’re better off today than we were a few years ago, so that’s good, right? Well, sure, if you’re content with a rate of improvement that’s slowed to a trickle.
We once made huge progress on repairing our deficient bridges, but today, that progress has almost flatlined. Check out this chart from our report showing the reduction in the number of structurally deficient bridges per four-year period starting back in 1992.
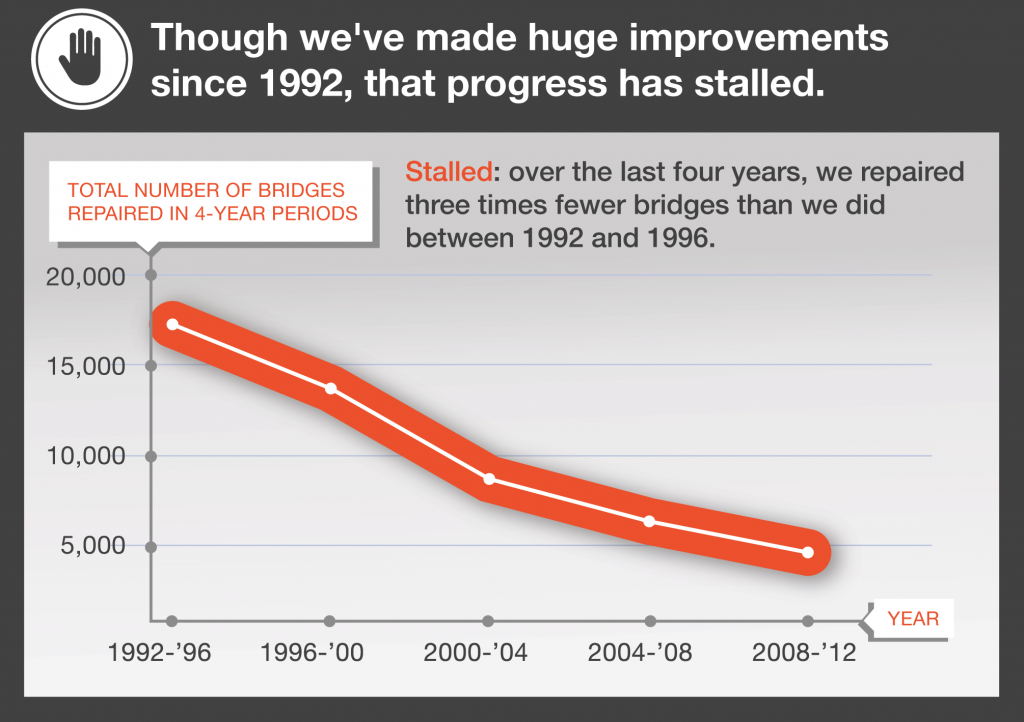
Starting in 1993, shortly after Congress gave bridge repair a greater focus in 1991’s transportation bill (ISTEA), we repaired about 17,000 deficient bridges over the following four years. But in the four-year period from 2009-2012, our log of deficient bridges shrank by only about 5,000 in total. That’s a rate of repair that’s almost three times slower than it was 20 years ago.
If you take a closer look at that improvement over 2011 (about 2,400 fewer deficient bridges), you’ll see that the big improvements made in just two states that heavily prioritized repair, Pennsylvania (-500) and Missouri (-640), account for almost half of that total national reduction of 2,400.
Also keep in mind that the last two years included a heavy load of stimulus spending on repair, and still progress has almost flatlined. Should we be content with hovering around 11 percent of our bridges structurally deficient? Should that be good enough? Can’t we do better?
Considering the dire budgetary straits that many states are in combined with Congress eliminating the dedicated bridge repair program last summer and forcing 90 percent of our deficient bridges to compete with all other pressing local needs for funding, could we finally see a year ahead where the backlog either doesn’t shrink much at all, or even grows somewhat? Certainly.
It’s time to #FixOurBridges, folks.
Tweet about the report, share our infographic (the chart above is included), share the photos on Facebook, and help spread the word far and wide. And don’t forget about our interactive map that lets you map all the bridges near you and locate the deficient bridges.

And Let Congress know it’s time to win the confidence back of the people and be good stewards of our existing infrastructure, before we build new things that we’ll also have to pay to maintain for decades.
Our three principles

It’s past time to elevate the national conversation about infrastructure.
Learn more about our platformLatest From The Blog

Five for ’25: What to expect on transportation…
Dec 11th, 2024

Meeting the moment after the 2024 elections
Nov 27th, 2024


A pause for TransportationCamp DC
Nov 19th, 2024

I cannot find the zoom link, I registered…
Jan 6th, 2024

A rare look behind the curtain of Transportation…
Jul 28th, 2023

In what Harrison Ford said was his most…
Jul 25th, 2023

Good example, walking to the local taco place…
Jul 24th, 2023