Related Resources
The Fix We’re In For: The State of Our BridgesThe Fix We're In For: The Nation's Busiest Bridges
The Nation’s Busiest Bridges
 |
| Click to download the full version of this report, with data for all 102 metropolitan areas over 500,000 people. |
Pounded by heavy traffic day in and day out, the bridges in our metropolitan areas are indispensable links in the transportation system that takes millions of people to work and goods to market every day. And they threaten to become weak links, as they age and deteriorate in an era when public investment in infrastructure is shrinking in relative terms.
The impact of a failure to attend to our bridges became all too clear in September, 2011, when the governors of Kentucky and Indiana were forced to close the busy Sherman Minton Bridge in metropolitan Louisville after inspectors found cracks in its structural beams. The closure made national headlines as Louisville traffic was snarled and millions of Americans wondered about the condition of the busy bridges they have to cross each day.
With the majority of American bridges soon due for major maintenance, overhaul or replacement, scenarios such as this could begin playing out with increasing frequency absent concerted effort and investment.
The largest 102 metropolitan areas
Transportation for America conducted an analysis of the National Bridge Inventory, a database produced by the Federal Highway Administration (FHWA), and found one in nine U.S. bridges has been rated “structurally deficient.” This means that the bridge is in need of more frequent monitoring and critical, near-term maintenance, rehabilitation or replacement.
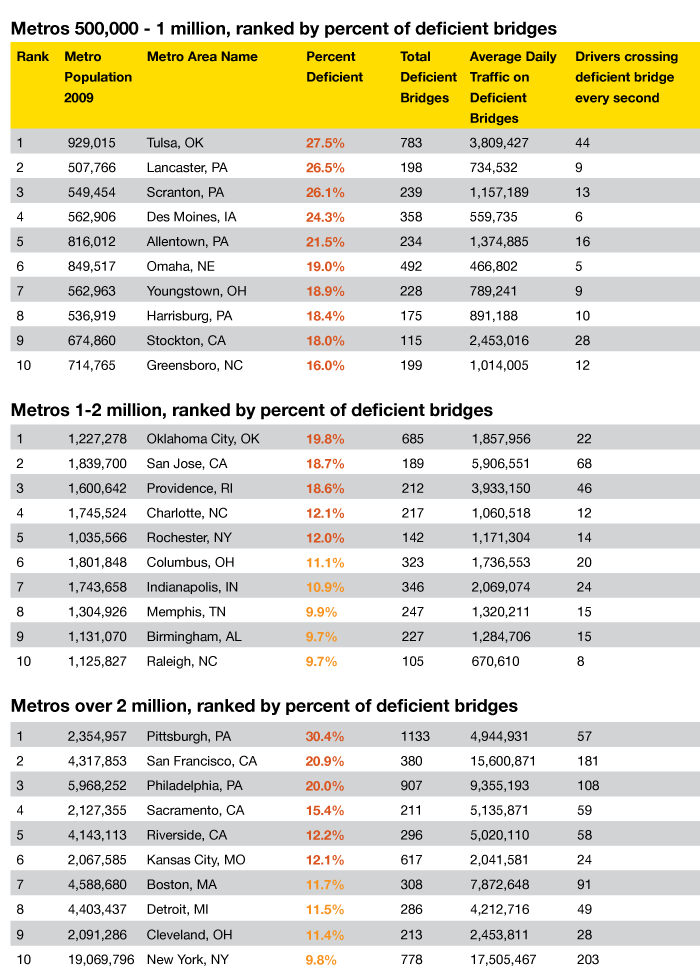
 Structurally deficient bridges in metropolitan areas carry a disproportionate share of all trips taken on a deficient bridge each day. In fact, deficient bridges in the largest 102 metropolitan areas carry three-quarters of all traffic crossing a deficient bridge.
Put another way, there are more deficient bridges in these 102 regions than there are McDonald’s restaurants in the entire country – 18,239 versus about 14,000. Worldwide, McDonald’s serves a staggering 64 million people a day. But here in America, 210 million trips are taken daily across deficient bridges in just these 102 regions.
Pennsylvania leads all other states in the nation with six metropolitan areas with a high percentage of deficient bridges. Pittsburgh leads the way with 30 percent of area bridges rated deficient — higher even than the state average of 26.5 percent. It is important to note that these numbers would be worse without the intensive bridge repair program implemented by Pennsylvania in the last several years, including a quadrupling of state funding for bridge repairs.
California leads the nation with the busiest deficient bridges. In Los Angeles, for example, 396 cars drive across a structurally deficient bridge every second of each day, on average. When ranking metros by the sheer volume of traffic on deficient bridges, California regions take several of the top spots, with the daily volume in Los Angeles at number one, more than double that of second place New York.


