The IIJA is a climate time bomb. Will states defuse it?
Despite the transportation sector being the biggest emitter of U.S. greenhouse gasses, our AI-powered analysis of over 57,000 infrastructure law-funded state projects shows that over a quarter of the law’s formula dollars are funding highway expansion projects that will drastically increase emissions. Will states reverse course with the last two fiscal years of funding?

In a recent briefing with the American Association of State Highway and Transportation Officials in Washington, DC, Delaware Senator Tom Carper took to the stage and reflected on the 2021 infrastructure law (also known as the Infrastructure Investment and Jobs Act or IIJA), and its importance in the fight against climate change. While several Democratic senators have touted the IIJA as important for reducing emissions, as it currently stands, the landmark legislation has not made a positive impact.
While it is true that the IIJA gave states an unprecedented opportunity to use formula program dollars towards emissions-reducing projects, state DOTs also retained the flexibility and authority to invest in traditional, unsustainable road-building projects. Climate researchers found that states are key in determining if the infrastructure law would reduce emissions or use the new funding to make the current problem that much worse.
Keeping these two potential outcomes in mind, we set out to determine how states are actually using the IIJA’s historic funding. With the help of Artificial Intelligence (AI), we categorized thousands of infrastructure law federal award project descriptions (here’s an example) in line with the Georgetown Climate Center’s Transportation Investment Strategy Tool. We now have a picture of how states are using their federal program funding.
Through the analysis, we categorized over $130 billion in funding that has been reported as obligated (or designated to be spent) using IIJA funding from over 56,000 Federal Highway Administration (FHWA) projects, over 1,200 Federal Transit Administration (FTA) grants, and dozens of grants from the Office of the Secretary and Federal Railroad Administration.
While we’re still just scratching the surface of this massive data set, what we found does not paint a pretty picture.
Our findings
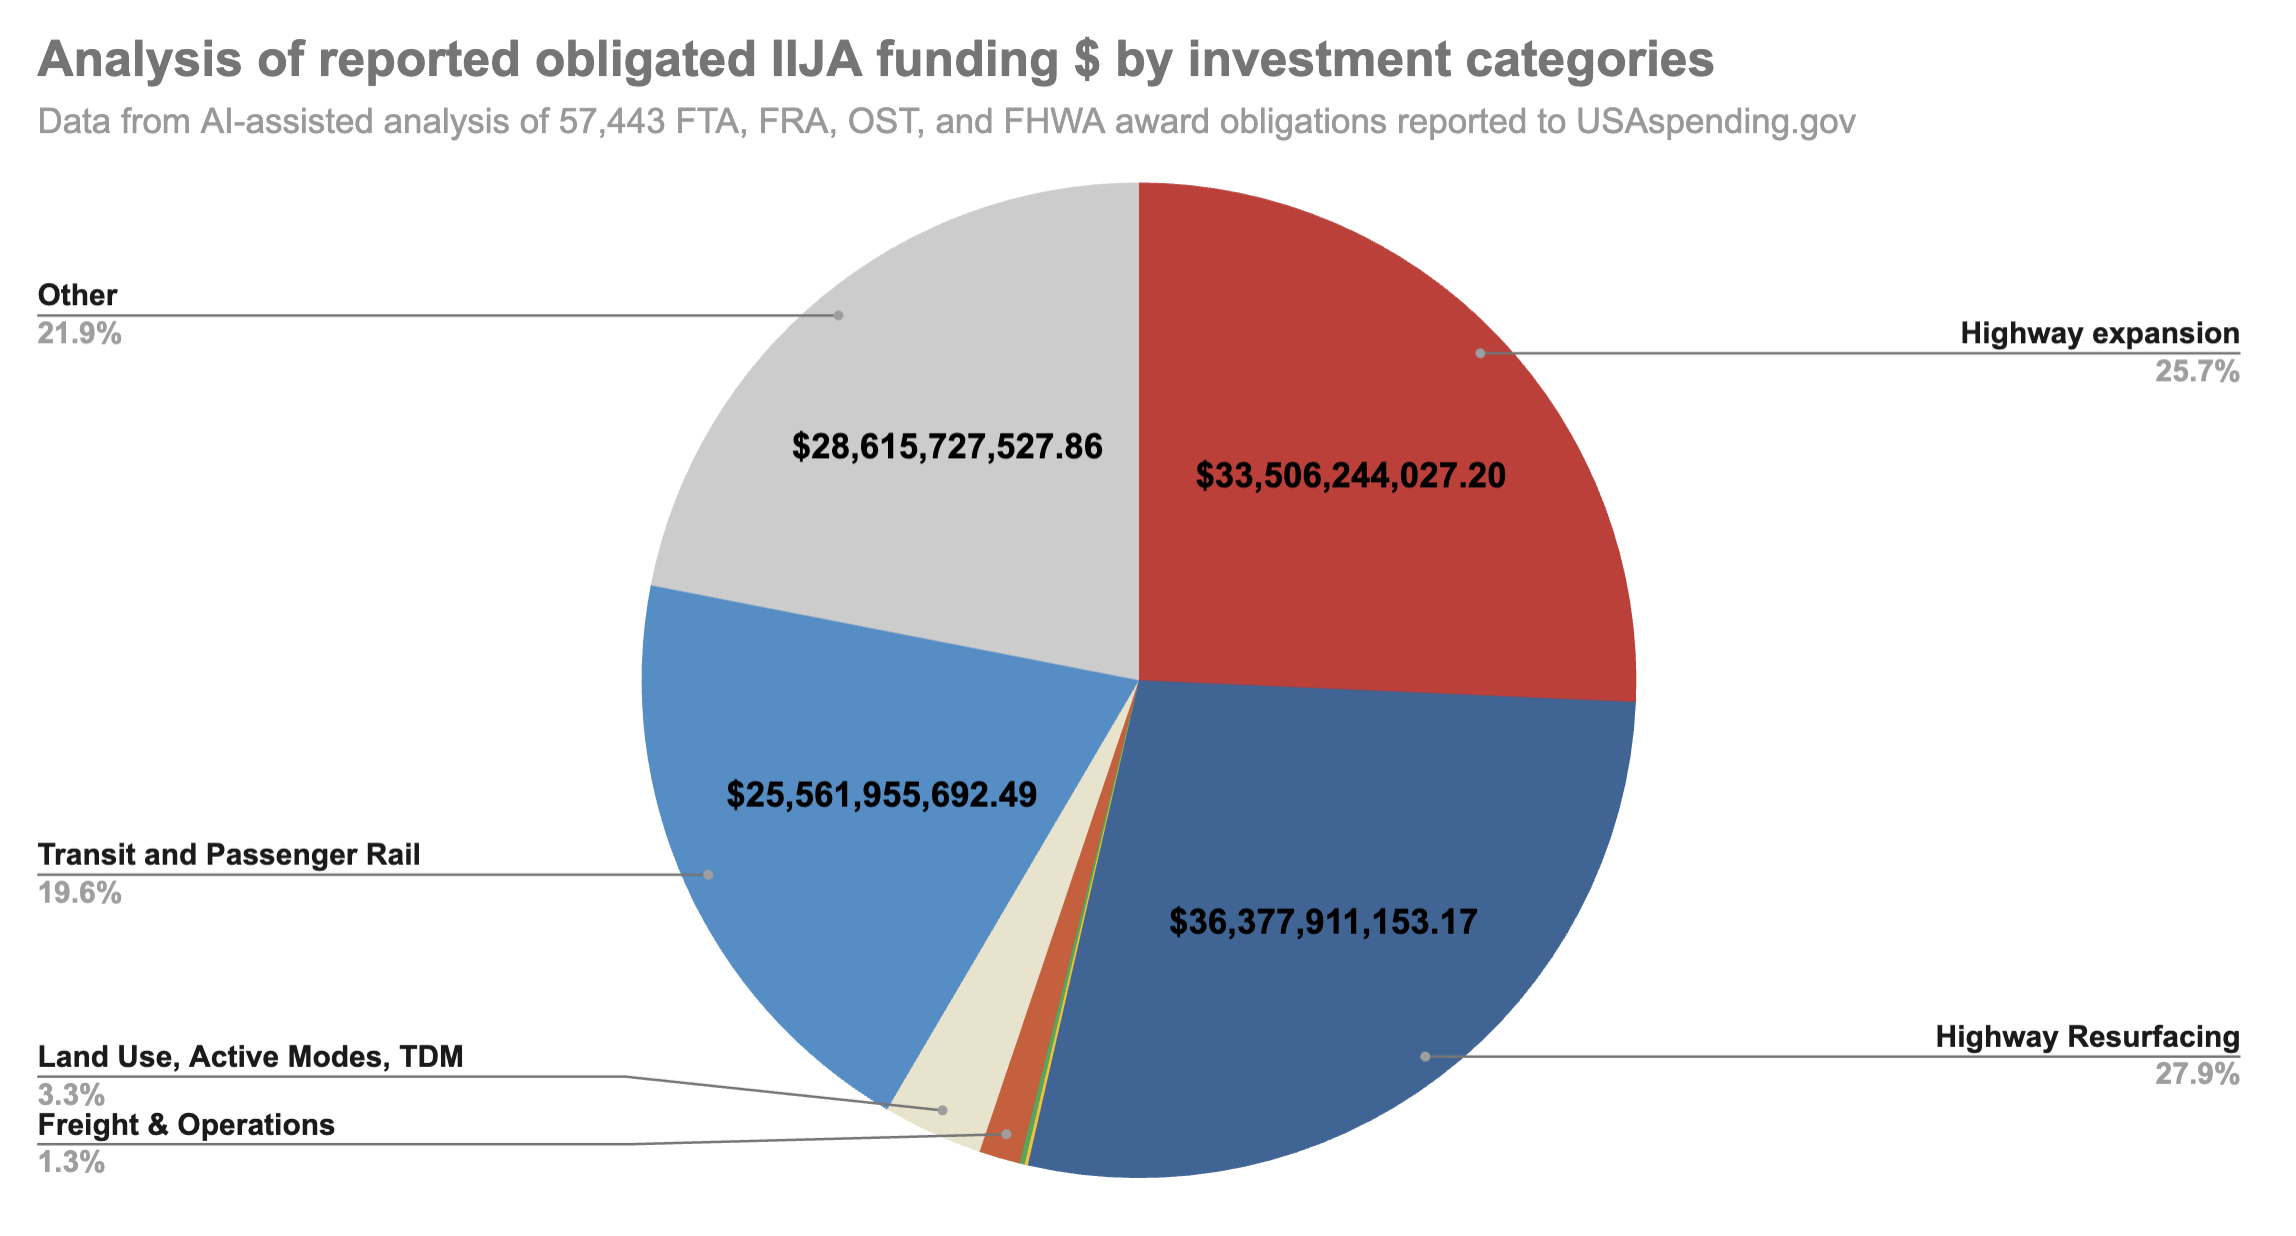
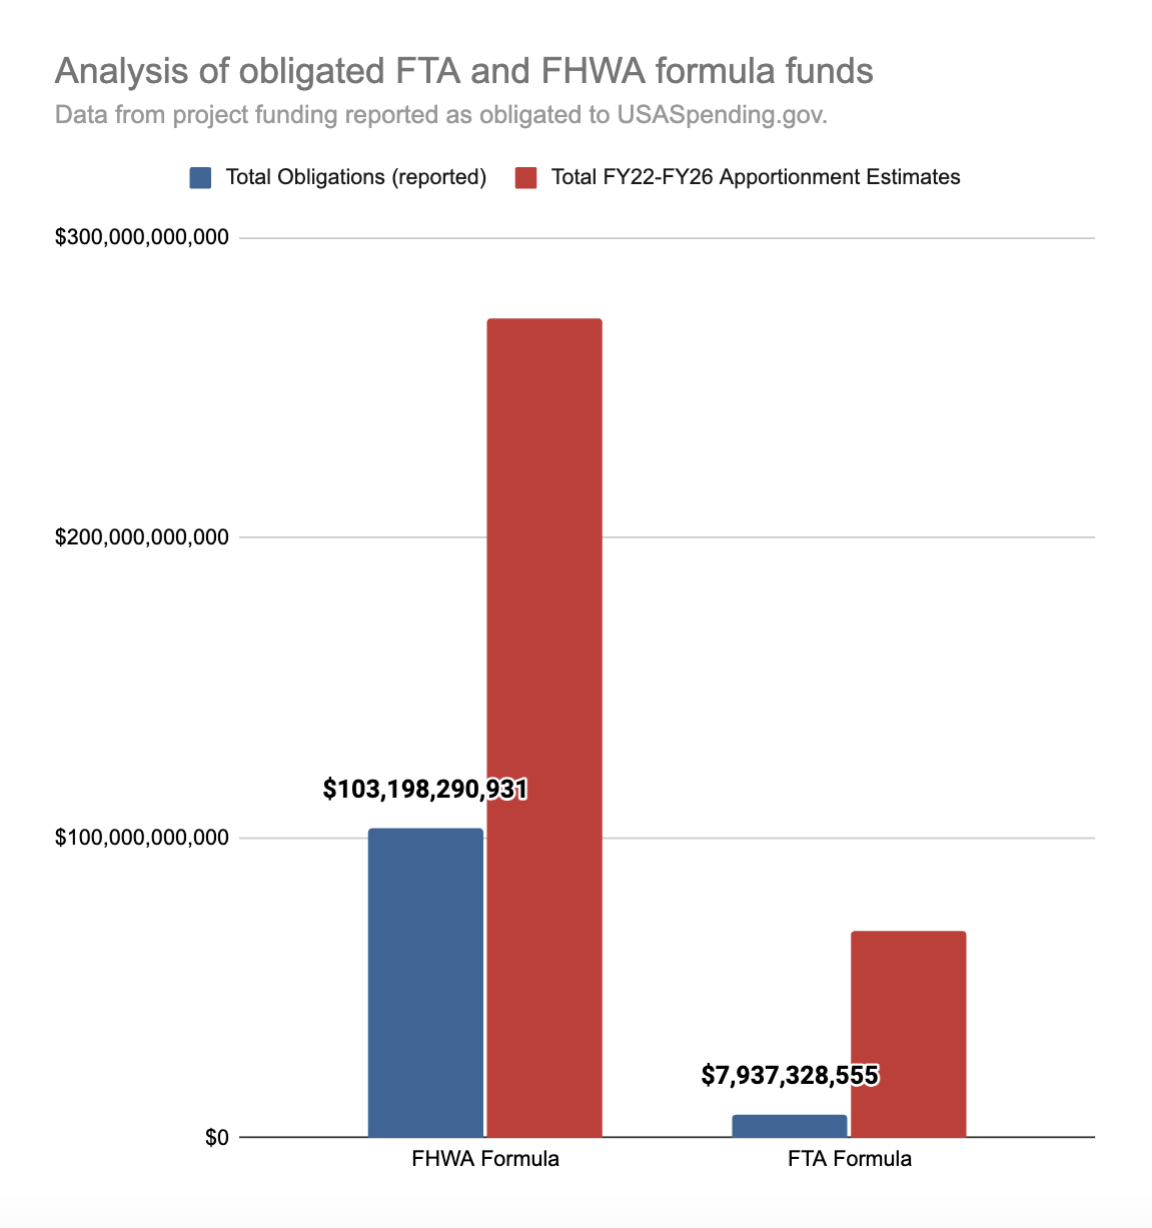
Instead of using the historic funding levels to give people alternatives to congestion, pollution, and car dependency, our analysis finds that states have designated over $33 billion in federal dollars (over 25 percent of analyzed funds) toward projects that expand road capacity, doubling down on a strategy that has failed time and time again. Worse still, states and authorities are slow to designate funds for transit and other emissions-reducing projects and even slower to outlay (actually spend) funds relative to FHWA dollar spending, even as we’re running out of time to reduce emissions in the face of climate change. Only about 20% of FTA formula apportionments from fiscal year 2022 to 2024 are reported as obligated in this dataset, while 64% of FHWA formula apportionments are reported obligated, in line with reporting from USDOT. There is also concern that if IIJA funds are not obligated/designated to be spent within a specified period of time, they could expire (or lapse) and become unavailable for use.
To maintain just the literal surface of the nation’s massive inventory of roads, nearly 28% of analyzed funding has gone to highway resurfacing, a strategy that the Georgetown Climate Center’s Transportation Investment Strategy Tool found to help reduce emissions. Considering other infrastructural work unrelated to on-road emissions, we found that road maintenance accounts for more than half of all FHWA formula spending.
Our analysis includes only the information provided by the federal government on USAspending.gov. State DOTs and federal agencies are slow to update project spending data, and many discretionary awards are not yet uploaded to USAspending.gov, so this analysis does not reflect all of the IIJA’s spending. Instead, we intend this analysis to shine a light on how states are using the largest, most flexible, and often least understood chunk of federal funding—federal highway formula funds. Without federal guardrails on states or a drastic change in spending priorities, our analysis predicts a substantial increase in GHG emissions if current trends persist.
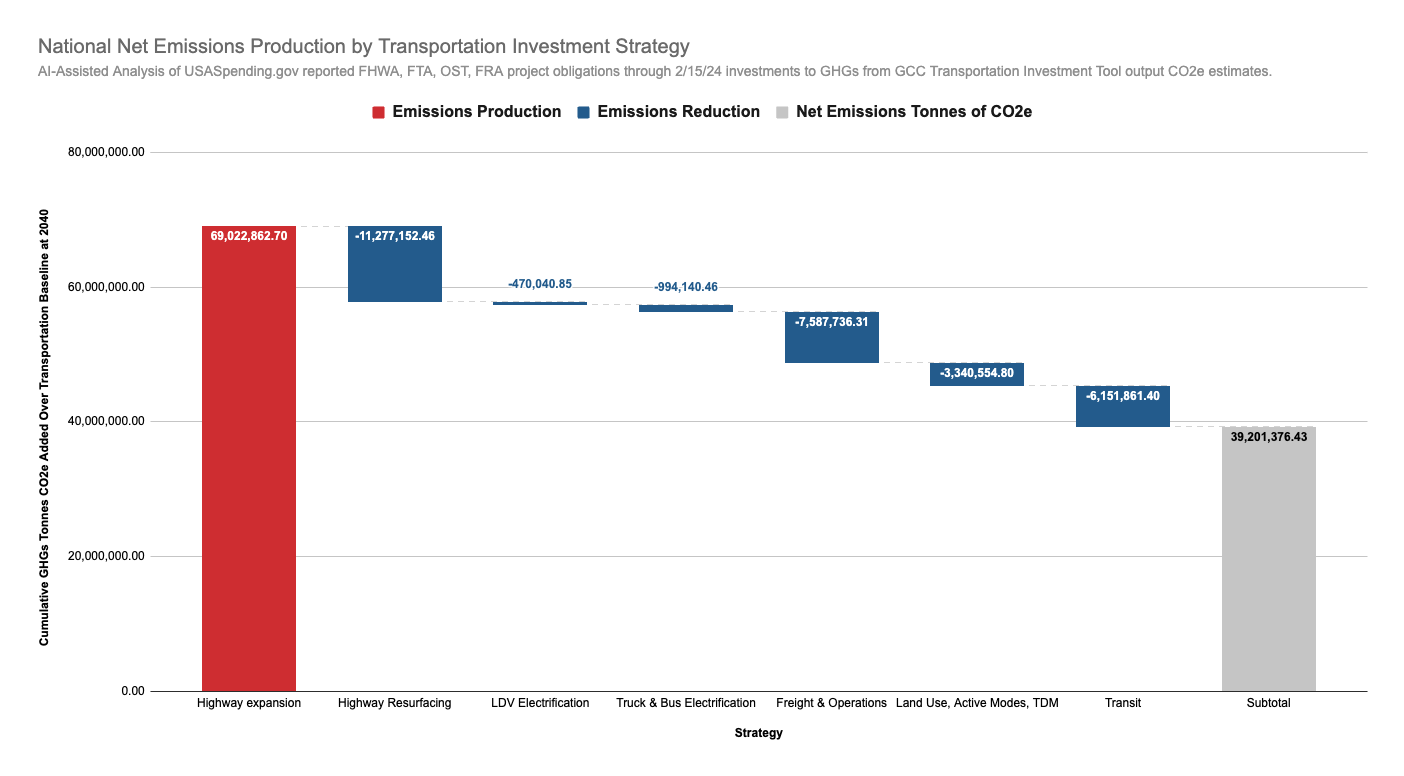
We’re only just approaching the midway point for the IIJA, which is set to expire on September 30, 2026. If states continue to fund and advance projects in the same way that they’ve done so far, the IIJA will have an alarming impact on the climate. If states do not change course, the IIJA is on track to produce an additional 178.5 million tonnes of CO2e GHG over baseline emissions by 2040. According to the EPA, this is the emissions equivalent of running 48 coal-fired power plants for a full year.
While the IIJA could have been a win for the environment, across the country, states have instead used this once-in-a-generation level of funding to expand roadways the same way they’ve been doing for years. Considering the billions of federal dollars already spent on highway expansion projects, it’s going to take more than self-congratulation over the bill’s historic funding to undo the environmental harms. In light of our findings that state spending continues to undermine climate goals, the administration cannot compromise on reducing transportation emissions and must explore every means available. Congress needs to get real—the largest and most growing sector of emissions is transportation. If we want to tackle congestion and the climate crisis, instead of offering platitudes, the next transportation bill needs to offer clean mobility options, like transit, car share, active modes, and electrification—not just the same strategies that got us in this position in the first place.
United States Reported Obligation Strategy Breakdown
AI-assisted analysis based on data reported to USAspending.gov, updated 2/15/24.
| Strategy | Total $ | Total CO2 Saved |
|---|---|---|
| Other Non-Reducing | $28,615,727,528 | 0 |
| System operations | $1,490,802,923 | 7,290,026 |
| Electric transit buses | $202,807,446 | 979,560 |
| Travel demand management | $499,844,950 | 2,214,313 |
| Light duty EV’s: vehicles | $106,276 | 460 |
| Light duty EV’s: infrastructure | $138,519,373 | 469,581 |
| Land use/smart growth | $47,297,073 | 118,716 |
| Electric trucks – MDT/urban | $0 | 0 |
| Electric trucks – HDT/short-haul | $5,985,065 | 10,653 |
| Electric school buses | $0 | 0 |
| Hydrogen trucks – long-haul | $3,167,000 | 3,927 |
| Freight/intermodal | $250,176,484 | 297,710 |
| Passenger rail electrification | $0 | 0 |
| Micromobility: e-bike ownership subsidies | $0 | 0 |
| SGR: Bus | $5,185,233,999 | 2,385,208 |
| Bicycle investment | $1,879,072,466 | 770,420 |
| Bus service: efficiency | $906,794,442 | 299,242 |
| highway resurfacing | $36,377,911,153 | 11,277,152 |
| SGR: Urban rail | $5,113,561,167 | 1,278,390 |
| Electric microtransit | $30,785,446 | 6,465 |
| Intercity rail | $8,751,313,573 | 1,662,750 |
| Transit fare reduction | $0 | 0 |
| Pedestrian investment | $1,822,206,721 | 236,887 |
| Urban rail | $1,513,168,610 | 196,712 |
| SGR: Commuter/intercity rail | $2,737,602,045 | 328,512 |
| Micromobility: shared e-scooters & e-bikes | $3,657,179 | 219 |
| Commuter rail | $317,520,073 | 15,876 |
| Bus rapid transit | $533,558,478 | 21,342 |
| Shared ride incentives | $35,431,188 | 1,063 |
| Bus service: expansion | $436,986,673 | -43,699 |
| Highway expansion | $33,506,244,027 | -69,022,863 |
Our three principles

It’s past time to elevate the national conversation about infrastructure.
Learn more about our platformLatest From The Blog

Five for ’25: What to expect on transportation…
Dec 11th, 2024

Meeting the moment after the 2024 elections
Nov 27th, 2024


A pause for TransportationCamp DC
Nov 19th, 2024

I cannot find the zoom link, I registered…
Jan 6th, 2024

A rare look behind the curtain of Transportation…
Jul 28th, 2023

In what Harrison Ford said was his most…
Jul 25th, 2023

Good example, walking to the local taco place…
Jul 24th, 2023