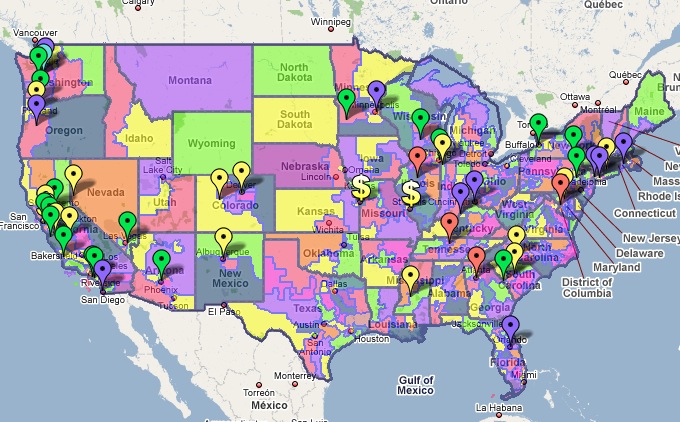
Update to the Transit Cuts map; 51 systems covered
We knew when we put it together that our list of transit agencies facing fiscal crises was not going to be exhaustive. And as soon as it went live, we heard from a number of you with information on other systems that we either didn’t know about or couldn’t find information on.
So thanks to Hugh, Richard, Jef, Randy, and Jeff, we now have 51 systems covered in the map, representing ovevr 20 million daily trips by everyday Americans. If you embedded the map in your site, then it has automatically been updated with the 14 new systems.
Cities Added: Eugene, OR; Cincinatti, OH; Augusta, GA; Clark County (Vancouver), WA; Carbon County, PA; Binghamton, NY; Orlando, FL; Olympia , WA; San Francisco-San Jose-Gilroy, CA (Caltrain); San Mateo, CA; Monterrey, CA; Hollister, CA; Orange County, CA; Western Contra Costa County, CA
I’m sure there are yet more out there we’re unaware of, so if they’re facing cuts of any kind in your area, send information in to us. You can mail information to photos [at] t4america [dot] org. If you have a source you can point us to, then all the better.
 Another nifty thing we wanted to point out is that you can use a Google map from the Gov Track system to overlay Congressional districts over the transit cuts. Keep in mind that the pin placements are not exact, but you can use this to see which Representatives should unquestionably be fighting for more transit funding in the House bill.
First click on the map link for our Transit Cuts map and then “Save to My Maps” in Google. Then click on this map link from Gov Track and do the same. Check both boxes and you’ll see a picture something like this at right:
More information at https://t4america.org/transitcuts
Yellow = Service Cuts Green = Fare Increases Purple = Service Cuts and Fare Increases Red = Service Cuts and Job Losses Turquoise = Fare Increases and Job Losses $$ = Service Cuts, Job Losses, and Fare Increases.


No Comments