
Greener Fleets: How federal dollars can supply the demand for clean transit

Electric buses line up in a brightly lit warehouse with an American flag in the background
Electric buses line up in a  brightly lit warehouse with an American flag in the background
Image source: Proterra

The Low and No Emission Vehicles (Low No) program saw a big increase in funding in America’s historic infrastructure law, but an outdated and arbitrary requirement is pushing transit agencies toward buses that still pollute. Here’s how Congress and the Federal Transit Administration can avoid locking in emissions for years to come.

While scientists have rung the alarms on climate change for decades, the 2021 infrastructure law is American policymakers’ first significant response. While unfortunately allowing for much climate-damaging investment in highway expansion, the IIJA also invests significantly in public transit systems including $5.5 billion over its five-year appropriation period for the Low or No Emission Vehicle (Low No) program—six times more than the program’s previous five years of funding. As the title suggests, the Low No program helps transit agencies transition their fleets to low- and zero-emission buses. Additionally, the IIJA provided nearly $2 billion in funding over five years for the closely-related Bus and Bus Facilities Program. While these programs are record-breaking for their level of investments in clean buses and supporting infrastructure, this legislation has flaws that are holding the nation back from cleaning up the bus fleet.

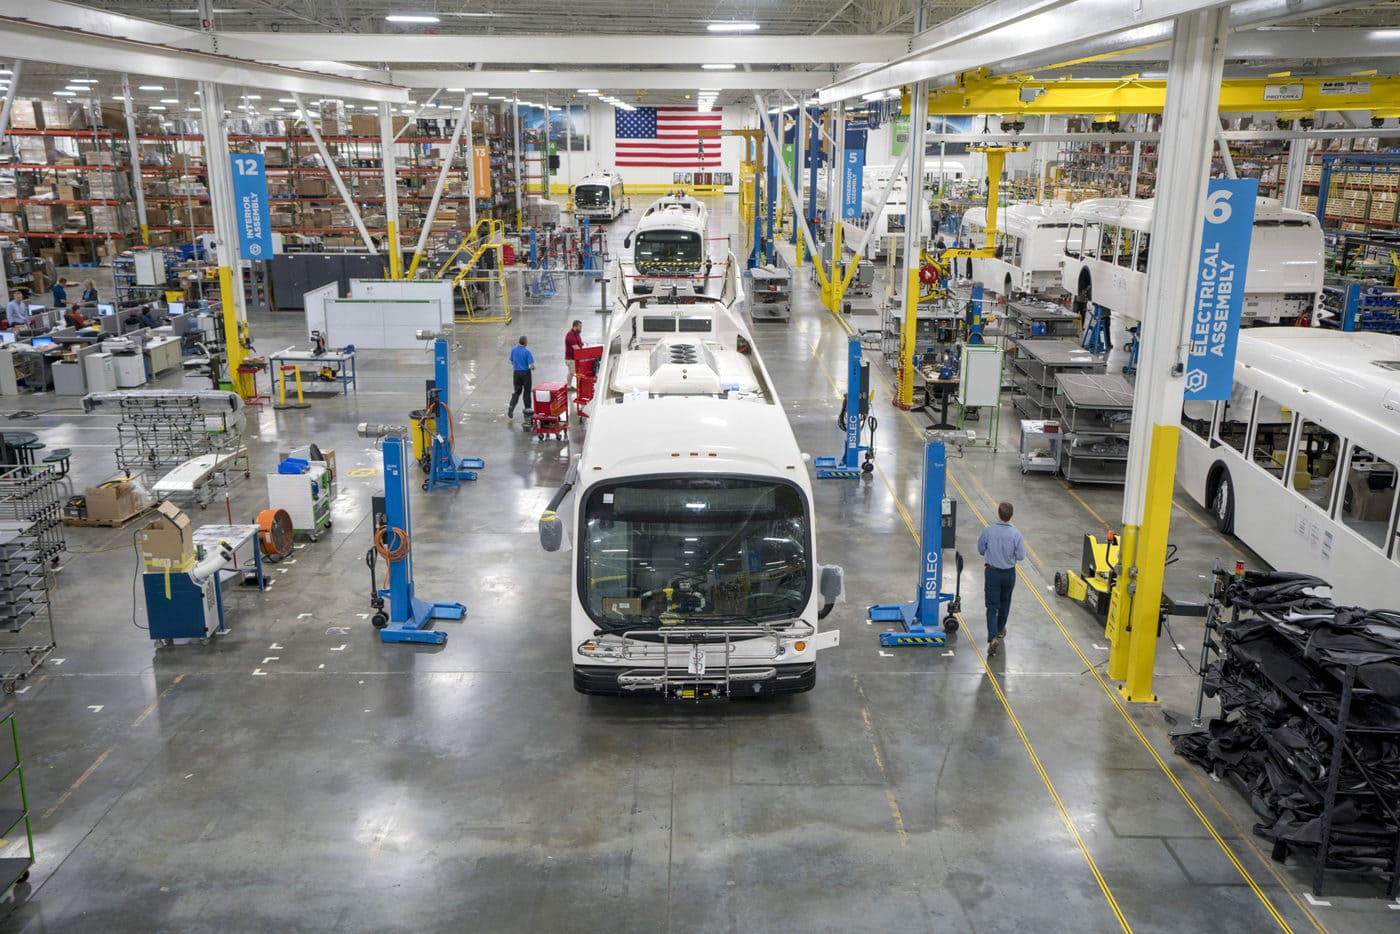
In October of 2022, Transportation for America filed a Freedom of Information Act (FOIA) request with the Federal Transit Administration (FTA) for a synthesis of all applications submitted to the Low No and Bus and Bus Facilities programs in fiscal year 2022 (FY22). We wanted to better understand how the programs are serving U.S. transit agencies’ needs and supporting America’s climate goals and emission reduction efforts. What we found was worrying.

As we wrote in Greener Fleets, a white paper we’ve submitted to Congressional leaders, we found that the program encourages transit agencies to buy diesel hybrid and compressed natural gas (CNG) buses instead of zero-emission buses running on electricity or hydrogen. The root cause: 25 percent of the Low No program’s funding is reserved for low-emission (as opposed to zero-emission) projects. This is artificially constraining the supply of zero-emission funds, locking in unnecessary transit emissions for decades.

Low No is coming up short

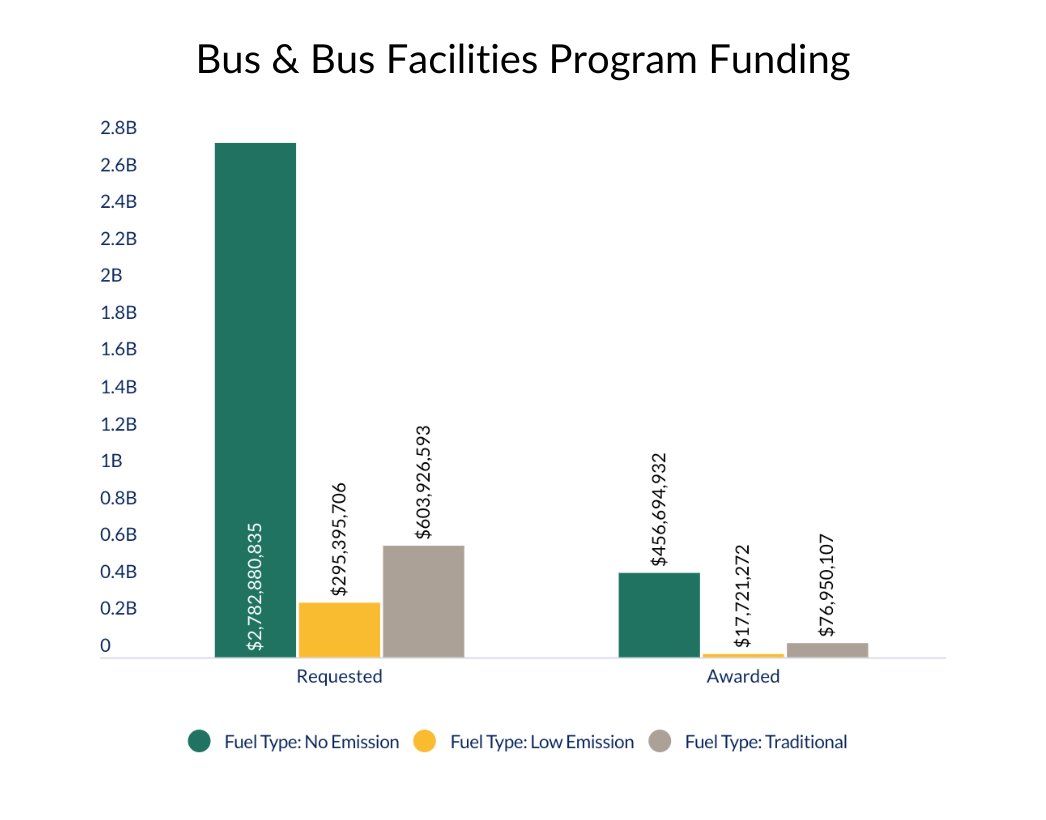
Applications for grants in FY22 for zero-emission projects of the Low No and Bus and Bus Facilities programs were in extremely high demand, composing 86 percent of the combined two programs’ grant requests. 

The Bus and Bus Facilities program does not place constraints on fuel types when considering awards, focusing on the applicant’s project rating (Highly Recommended, Recommended, Not Recommended). Still, as shown in the graph below, zero-emission projects had a one in six chance of being awarded while consuming 83 percent of the program’s available funding.

Bar chart showing FOIA findings. Notable: over $2,780,000,000 was requested for no emission funding, but only $456,694,932 was awarded. Compare this to about $295,000,000 requested for low emission and $17,721,272 awarded.

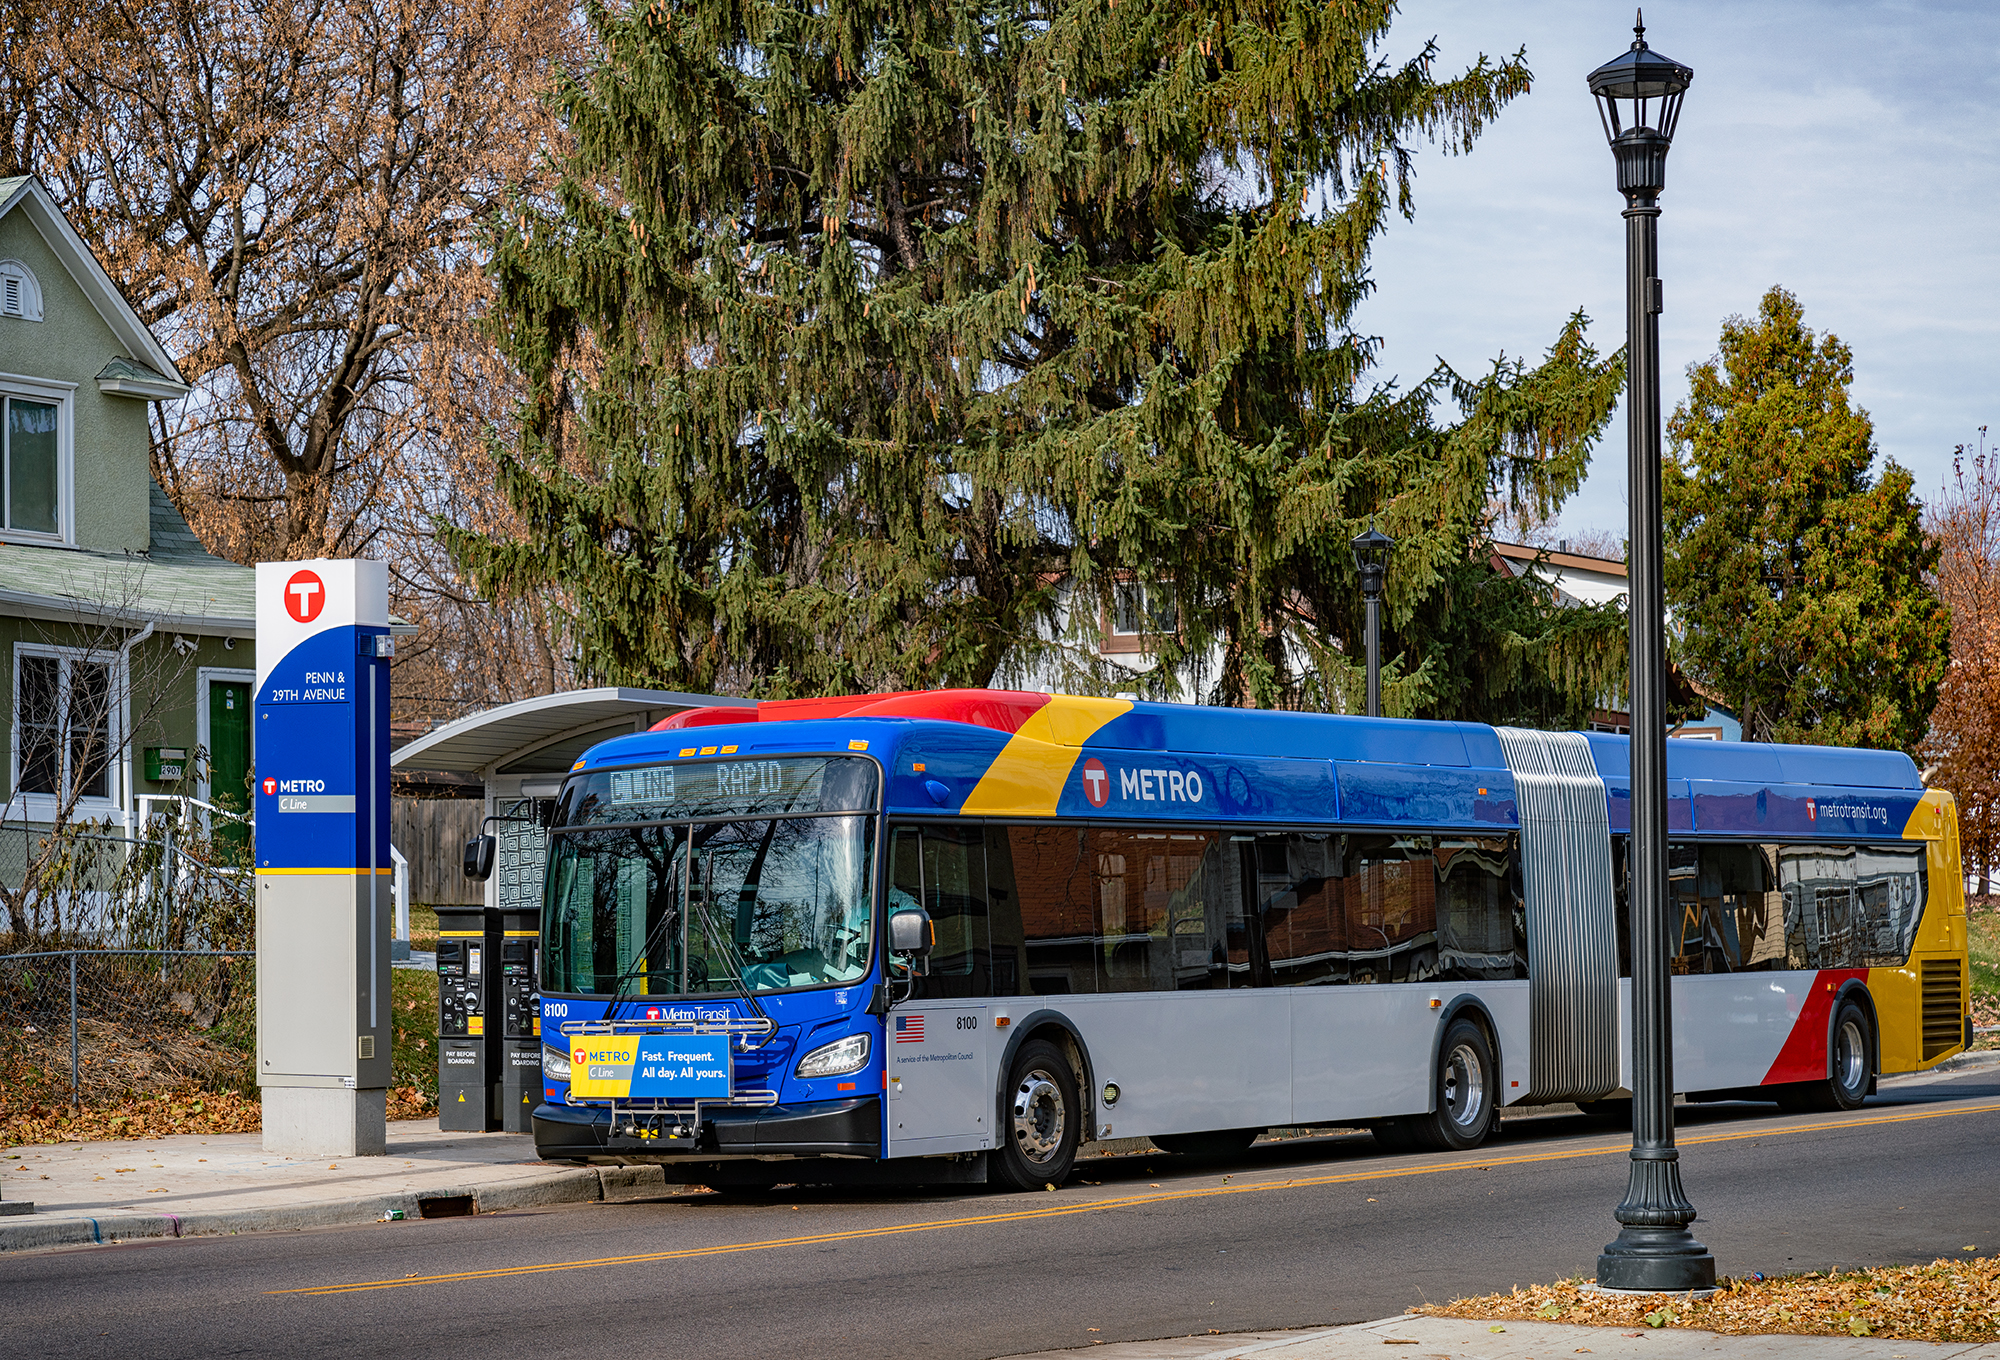
The strong demand for zero-emission buses and facilities shows that transit agencies have gotten comfortable with relatively new electric and hydrogen bus products and are more ready than ever to invest in the zero-emission transition.

Bar chart depicting probability of winning a grant across all programs. Notably, low emission projects had a 100% chance of winning Low No funding, while zero emission projects had a 33% chance. On the Bus & Bus Facilities side, no emissions projects had an 18% chance, compared to a 27% chance for all other fuel types (low emission and traditional). More information in the paragraph below and in our white paper linked at the bottom of this post.

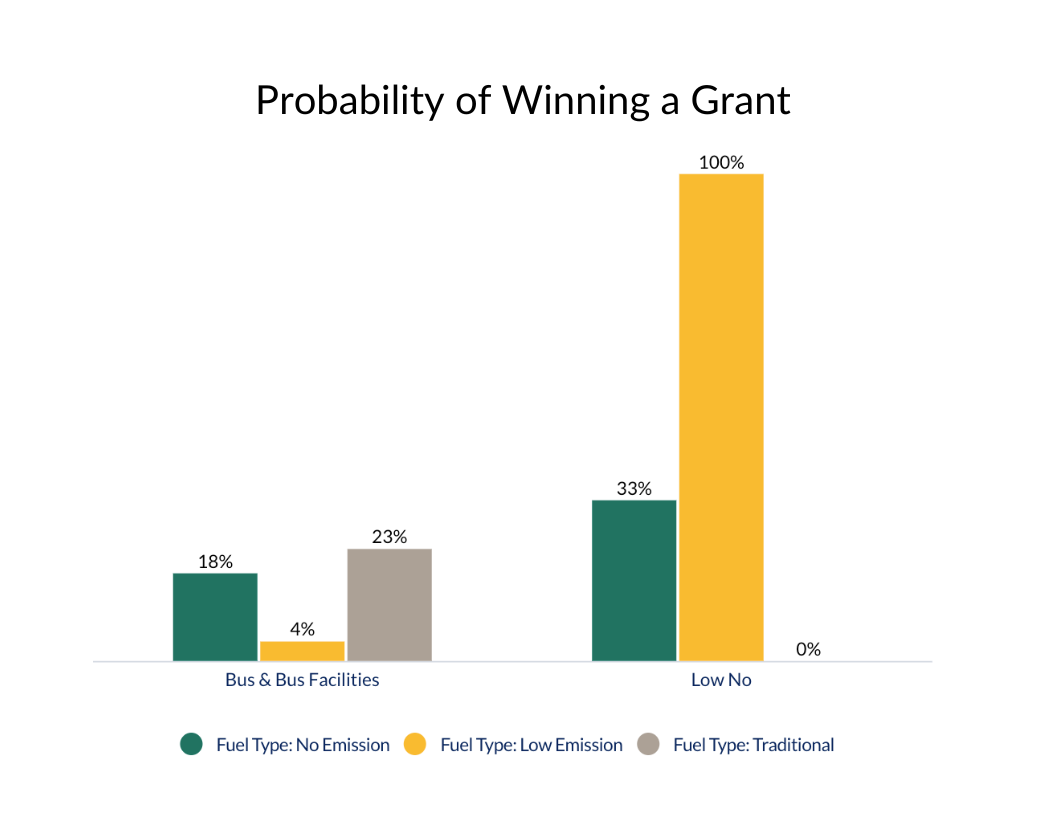
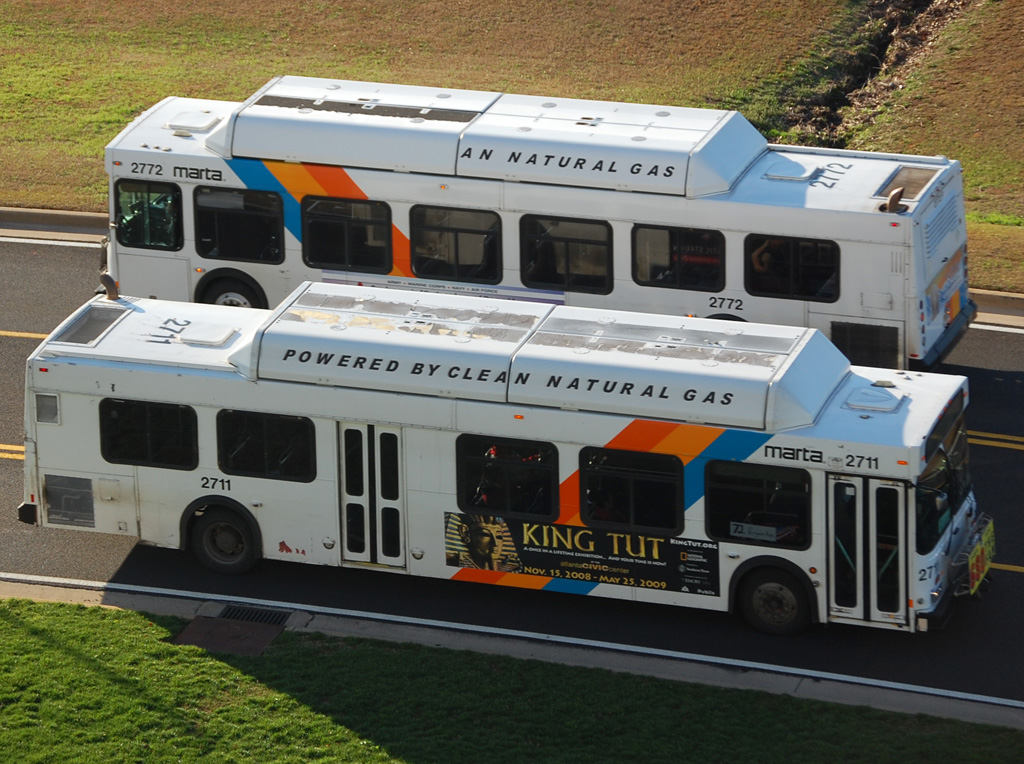
The Low No program is statutorily required to reserve 25 percent of available funds for projects using low-emission fuels, such as CNG, diesel-electric hybrid, and propane. In other words, even though 88 percent of applications were for no-emission buses and facilities, FTA was required to award 25 percent of the funding to more polluting low-emission projects. Due to this requirement, as shown in the graph above, nearly 100 percent of the low-emission projects received an award, while more than two-thirds of clean zero-emission applications were rejected. There weren’t even enough low-emission projects in the application pool to meet the 25 percent requirement.

We were concerned that this funding acceptance rate would encourage American transit agencies to give up competing for zero-emission funds (in extremely high demand), and instead apply for the less competitive low-emission funding. Based on early trends in FY23 applications, our concerns were justified. More transit agencies are competing for low-emission project funding than in FY22, putting them on track to deploy buses that will continue polluting for a decade or more, and slowing the development of an EV transit bus supply chain.

How did the 25 percent requirement come to be?

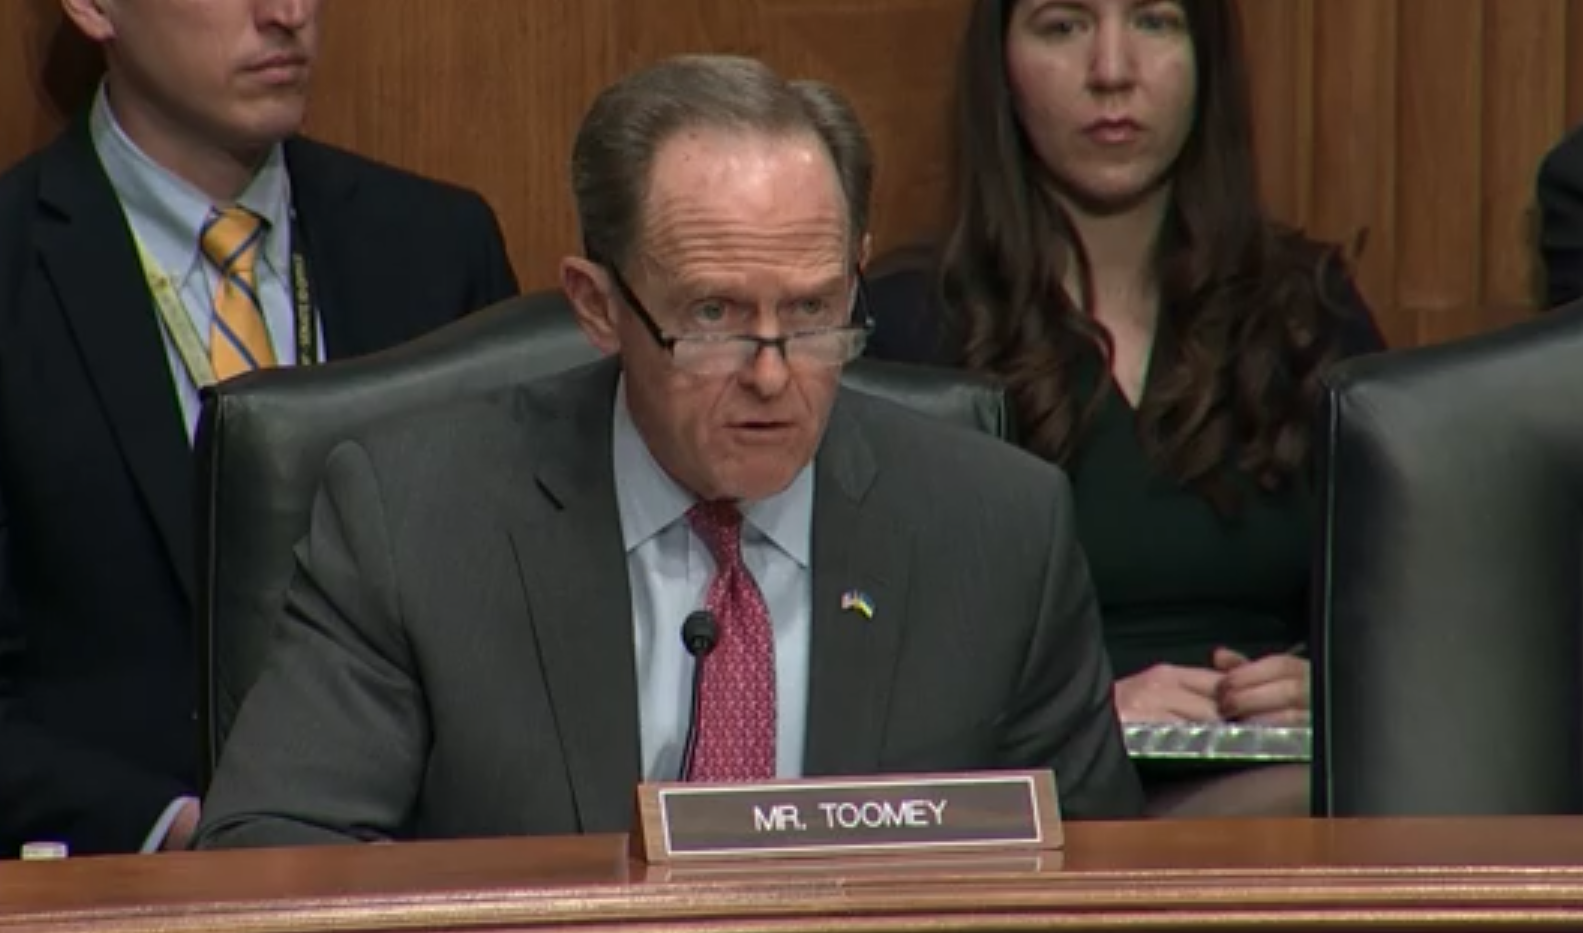
In 2015, the law that outlined the details of the Low or No Emission Vehicle program was passed by the U.S. Congress and Senate. Senator Toomey of Pennsylvania argued for a mandate to require funds be reserved for low-emission vehicles in the legislation. He successfully included a statutory requirement that 25 percent of the Low No program funding go to projects using low-emission fuels, such as CNG, a key product of Pennsylvania, whose natural gas production is second only to Texas. This statutory requirement to subsidize fossil fuels in an age of energy transition leads the IIJA to invest 1.4 billion over this 5 year authorization period in buses that still pollute.

Change the status quo

The Low No and the Bus and Bus Facilities programs are essential to ensuring American transit agencies can replace their aging bus fleets with low and zero-emission vehicles, and transit agencies are clearly eager to rise to the challenge. Congress can do more to ensure that these programs are working to accomplish emission reduction goals. They could start by eliminating the outdated and arbitrary requirement that 25 percent of Low No funding goes to low-emission vehicles. But they should go further: increasing funding for both programs to meet the overall demand for buses and facilities; creating incentives for both programs to leverage other funding sources; and increasing transparency of the program by making basic application and award information available on FTA’s website and looking for ways to simplify the application process. 

Ultimately, Congress and FTA should work together to form a vision for how the Low No and Bus and Bus Facilities programs can support American transit agencies in providing excellent transit service in our communities and converting their operations to zero-emissions rapidly enough to meet greenhouse gas reduction goals and improve air quality in the communities they serve.

Greener Fleets: Meeting the demand for cleaner transit

For more information on this problem and how to solve it, read Greener Fleets: Meeting the demand for cleaner transit.

Is the federal government squandering clean transit funds?

press release

A new report shows splitting clean transit funds between zero-emission vs. low-emission is holding U.S. transit agencies back from cleaning up the bus fleet.

WASHINGTON—A new report by Transportation for America (T4A), “Greener Fleets: Meeting the Demand for Clean Transit,” examines the Low or No Emission Vehicle (“Low No”, “5339(c)”) and Buses and Bus Facilities (“5339(b)”) grant programs. The report finds that zero-emission projects were in high demand, representing 95% of Low No funds requested in applications last year, and relatively few project applications were funded. In comparison, low-emission projects made up such a small proportion of applications that nearly all applications were funded with money left over in that category. 

Higher demand for zero-emission grants significantly lowered the probability of accessing zero-emission project funds. The report finds that this discrepancy could incentivize transit agencies to change their clean transit plans in favor of low-emission vehicles that still pollute. Click here to read the report, executive summary and access graphics.

“Seeing this kind of demand for electric public transit buses shows that America is ready for mass adoption, and we need to revise these programs to reflect that new reality,” said Chris Rall, outreach director for T4A. “Our number one recommendation to improve the programs is to remove the outdated and arbitrary split between zero- vs. low-emission categories to ensure 100% of the funds find their best use.”

U.S.-based transit fleets compete for Low No program grants to help them transition to the lowest polluting and most energy-efficient transit vehicles. Last year, the program received $1,105,329,750 in funding, of which 25% must go to low-emission buses and facilities such as diesel hybrid buses, compressed natural gas (CNG) buses and fueling infrastructure. The remaining 75% is for using electricity and/or hydrogen as a fuel for zero-emission buses and facilities. The report finds that this 75-25% funding split is unsustainable.

“As an industry leader in clean transit, we see Low No funds as essential for helping transit agencies like ours transition to modern electric buses that deliver service at a lower operational cost with zero tailpipe emissions,” said Corey Aldridge, CEO and General Manager of Mountain Line, Missoula, Montana’s transit agency, which has been transitioning its fixed route fleet to be fully electric since 2017. “The data in this report is intriguing. We encourage the legislature to consider its recommendations. Updates to the program could help fleet managers access the cleanest vehicle technologies that make the most sense for them.”

Using data collected from a Freedom of Information Act (FOIA) request from the U.S. Department of Transportation, the T4A research team analyzed applications submitted by American transit agencies to the Low No and 5339(b) programs funding. 

TOP FINDINGS

  • Overall, transit agency-requested funding exceeded awards by over 4.5 times in the combined programs. Requested zero-emissions project funding made up 86% of all requested funding.
  • Low-emission projects in the Low No program were so undersubscribed that every low-emission applicant received an award regardless of the project rating (Highly Recommended, Recommended, Not Recommended). 
  • In contrast, applicants with zero-emission projects had only a 33% chance of receiving any funding. In the 5339(b) program their chances were even lower, at just 18%

“Congress’s goal was not to drive a shift in demand and investment toward low-emission projects at the expense of investments in zero-emission transit,” continued Rall.  “This trend could lock transit agencies into more polluting technologies for decades.”

The report concludes that this unbalanced dynamic creates a strong incentive for agencies to avoid applying for zero-emission projects and instead use the Low No program to apply for funding for diesel-electric hybrid buses. This is already evidenced by the fact that applications for low-emission projects are up for the 2023 application window.

Here is a summary of the report’s recommendations for improving the programs:

  • Eliminate the arbitrary requirement that 25% of Low No funding goes to low-emission vehicles.
  • Increase funding for both 5339(b) and Low No to meet the overall demand for buses and facilities.
  • Create incentives for both programs to leverage state, regional, utility, and local funding to encourage applicants to propose zero-emission projects at scale and increase the return on investment.
  • Reduce the matching funding requirements of Tribes and Justice40 communities.
  • Increase transparency by making basic application and award information available on the Federal Transit Administration’s website.
  • Simplify the application process and help agencies understand how to make their applications competitive.

“As the market of zero-emission vehicles grows and changes, so must our programs that support the transition,” said Rall. “The increased demand for zero-emission projects is a good thing. We can update these programs to make them better for transit agencies that want to save money and clean up their air.”

“The Champaign-Urbana Mass Transit District has stepped out as a leader in transitioning to zero emission vehicles. Our hydrogen fuel cell electric buses run on hydrogen that we produce on-site utilizing 100% renewable solar energy, said Karl Gnadt, managing director for Champaign-Urbana Mass Transit District (MTD). “The remainder of our fleet is made up completely of hybrid buses so we have long appreciated the value of low emission vehicles as well. However, as zero emission technologies advance, we believe it is time to focus on a national transition to zero emission buses. Removing the dedicated low emission set aside within the Lo-No grant program will allow the program to be more responsive to transit’s needs.”

###

Is your state missing the bus? Evaluating state transit access and ridership

Transit riders representing a range of ethnicities board a bus in the state of Washington

The state you live in plays a major role in the quality of transit near you. Back in February, we took a look at state financial support for transit. This post focuses on the results of those investments.

Transit riders representing a range of ethnicities board a bus in the state of Washington
Flickr photo by Seattle DOT.

We partnered with the National Campaign for Transit Justice and the Labor Network for Sustainability to assess the quality and support of transit systems across all 50 states, the District of Columbia, and Puerto Rico.

In our first post of this series, we focused on state transit funding. But the level of funding transit has received doesn’t necessarily line up with how easily residents are able to use transit on a regular basis. To understand that piece of the puzzle, we focused on two metrics: quality of transit access and how often residents choose driving over transit.

Measuring transit access

Public transit becomes a viable option only when people are able to rely on it for quick, convenient travel to their essential destinations. But, as we wrote back in 2021, while about 80 percent of people in the US live within areas classified as “urban” (which includes the suburbs of urban centers), less than 10 percent of Americans live within walking distance of reliable, high quality transit that comes every 15 minutes. And 45 percent of Americans have no access to transit at all.

To get a better understanding of transit access in each state, we took a look at data from the Environmental Protection Agency’s Smart Location Database to get a sense of how well transit was connecting people to their essential destinations. The EPA collects the number of jobs within a 45-minute drive and the number of jobs within a 45-minute transit ride. From that information, we were able to compare the number of jobs accessible by driving and the number of jobs accessible by transit.

But we couldn’t stop here. We found that some states, like New York, have dense, transit-rich cities with more jobs accessible within a 45-minute transit ride than within a 45-minute drive. This didn’t mean transit access was well-distributed across the state.

To better understand transit access for all state residents, we looked at regional parity, meaning the average person’s access to jobs by transit compared to the most transit-rich areas around them. We found that New York and Hawaii, which initially scored near the top for transit access, did not have consistently strong transit networks throughout the state. 

Map of quality of transit access by state according to our research (described in the above paragraphs of this section). Results in the last two paragraphs of this section.
Map is not drawn to scale.

We took the average of these combined factors to determine the quality of transit access in each state, shown on the map above. Oregon and DC had the highest transit access, while 20 states (Alabama, Arkansas, Connecticut, Georgia, Indiana, Kansas, Kentucky, Louisiana, Maine, Michigan, Mississippi, Missouri, North Carolina, Ohio, Oklahoma, South Carolina, South Dakota, Tennessee, Texas, West Virginia, and Wisconsin) had the lowest access scores.

These scores don’t include Puerto Rico because the EPA’s Smart Location Database doesn’t include data on access to jobs via car or transit for Puerto Rico. The EPA, and the federal government as a whole, should work to capture this information for all U.S. territories in order to provide a stronger picture of the return on federal investments.

Transit ridership (or lack thereof)

Vehicle miles traveled (VMT) is the measure of the total miles driven by all vehicles on a given state’s roadway in a given year. VMT is usually used as a measure of roadway usage, but here, it functions as a proxy measure for transit usage by measuring its inverse: car usage. We assume states with more driving on average also have less transit ridership on average.

During the COVID-19 pandemic, more people drove less often and transit ridership also dipped dramatically. To provide a more a relevant picture of travel habits, we looked at travel data from 2019.

Eight states and territories had less than 8,500 VMT in 2019, and so transit ridership in these states is likely high. They include: Oregon, Illinois, Washington, Alaska, Pennsylvania, Hawaii, Rhode Island, New York, and DC. The areas with the highest VMT (and therefore lowest transit ridership) were Puerto Rico, Wyoming, and Alabama.

Map of vehicle miles traveled by state. Key findings in the paragraph above.
Map is not drawn to scale.

What’s next?

In the final part of this series, we’ll share the combined scores for each state so you can see how your state ranks overall in transit support and availability, including the specific data we used for our analysis. Stay tuned!

Think creatively, go bold, iterate time and again on transit

Three TransMilenio buses are waved on by a police officer in a brightly colored vest

Transit serves as the sustainable mobility lifeline for people in many communities around the world. Transit also serves as the great equalizer, transporting white collar workers, essential workers, tourists, as well as youth and seniors. Yet in the US, transit is still deemed over-resourced and undeserving. Traveling on Bogotá’s TransMilenio highlighted what matters most in transit service delivery: a willingness to think creatively in order to improve service.

A line of six red TransMilenio buses stream down a tree-lined street
Various bi-articulated bus routes traversing a major Transmilenio trunk line in Bogotá, CO. T4A photo by Benito Pérez.

Serving billions around the rapidly urbanizing world, transit is a mobility lifeline lifting people out of poverty and connecting them to jobs and services in their community. In many transit conversations, major cities like London and Tokyo are held in high regard for having stellar transit operations and infrastructure. What many decision makers in the United States take from comparing such examples is robust, permanently fixed, expensive infrastructure in transit to attract ridership, calling for the investment in the shiny new rail or streetcar line in their community.

Folks in the United States often assume that the transit systems are so good in other major cities because those cities are wealthy and come from the developed world. We would do well to consider how well cities in developing countries, like Colombia, are doing in providing high quality transit before letting ourselves off the hook. If we peel back the layers of any highly regarded transit system, we’ll see that they are seeded in decades of trial and error, flexibility, and low cost solutions improving frequency and reliability, before doubling down on capital intensive investments that many US decision makers look to replicate.

If leaders in the US want to have a serious conversation on how to evolve public transportation into the world class mobility option that is needed and deserved by all, then they should take a field trip down to Bogotá, Colombia. Within a week, I had a chance to be immersed with TransMilenio, a living lab of public transit innovation and evolution for world class transit that stands miles above and beyond many US transit systems.

What is TransMilenio?

Three TransMilenio buses are waved on by a police officer in a brightly colored vest
A bi-articulated bus traversing a major Transmilenio trunk line in Bogotá, CO being directed by transit police. T4A photo by Benito Pérez.

Prior to 2000, Bogotá was a city of major congestion and very unreliable and incongruent transit mobility options. Transit that was available in the metropolitan area of 7 million people consisted of private on-demand shuttles and buses (informally creating fixed routes where there was regular demand for service). Those uncoordinated shuttles were subject to irregular schedules due to being stuck in traffic with all other vehicles. Planning in the city in the 1980s and 1990s called for the creation of wider boulevards, elevated highways to increase vehicle throughput, and construction of a heavy rail line.

However, in the 1990s, Bogotá mayor Enrique Peñalosa changed the conversation on transportation in the Colombian capital, proposing and building an integrated transit system modeled after Curitiba, Brasil, which relied on bus rapid transit (BRT), a trinary road system (system of one-way circulating streets surrounding a smaller footprint two-way street that has exclusive bus lanes), and transit-oriented development. The TransMilenio project was to be larger in scale to Curitiba’s system, expansive in reach in the metropolitan area. It would enhance mobility reliability for all users to get to jobs and community services, but also accomplish this goal at a fraction of the cost of past proposals of highways and heavy rail.

About 13 different bus routes intersect across Bogota in a brightly colored map
Map of TransMilenio in Bogotá, CO. Map from Wikimedia Commons.

Since the first TransMilenio trunk line went live in 2002, the system has looked at ways to optimize service delivery to ensure people can reliably use the system and expect buses to arrive at stops every 3-5 minutes. Changes have included BRT serving all stops along the route and creating a local versus express route system, which ultimately evolved into a local paired with a tiered express route system (with different express routes serving different stops along the route). Every time a new trunk segment was introduced to the system, TransMilenio would reoptimize the system to integrate the new trunk route, while still preserving frequency and reliability. As of 2022, TransMilenio as originally planned is nearly built out, with final trunk lines finishing design and starting construction.

Today, the TransMilenio system covers 12 major trunk routes served by nearly 1800 buses (each can carry 300 people) and 152 stations. It includes 71+ miles with 3-5 minute headways, and it’s the foundation of the metro area’s tiered bus network. The TransMilenio system, carrying between 2.5-3 million daily riders, exemplifies the best of bus rapid transit, to include but not limited to dedicated lanes, off-board fare collection, a common fare structure ($2950 COP = $0.60 USD as of this writing), and accessible stations.

Redefining world class transit through iteration

To exemplify a stellar transit system, decision makers have to engage in a conversation and take steps in implementing seamless, integrated, and simplified mobility that elevates moving people. As Bogotá’s system enters its second decade of service, it is iterating on its trials and errors to better serve its customers and pursue its mission.

TransMilenio has heralded several successes as well as shortcomings through its operations and evolution. The system today is moving people through the region 32 percent faster than other modes and has reduced greenhouse gas emissions in the city by 40 percent. Safety in and along TransMilenio has also improved, with significant reductions (80-90 percent) in road injuries and fatalities attributed to the system. However, TransMilenio leadership have expressed regret in not integrating transit signal priority in earlier routes to improve reliability. Additionally, accessibility remains a hurdle for the tiered transit system that feeds into TransMilenio, particularly for customers with mobility impairments boarding buses and getting to and from bus stops. This accessibility challenge is compounded by the initial lack of dedicated bus lanes for feeder buses—this system has only started to leverage painted transit priority lanes during peak periods to access TransMilenio stations more reliably.

As TransMilenio enters its third decade of operations, the agency will need to confront these challenges to maintain reliable service, before continuing to embark on future expansion plans, which includes the initial construction of the Bogotá metrorail system.

The bottom line: If at first you don’t succeed, try try again!

Decision makers at transit agencies, local governments, state DOTs, as well as legislators both at state houses and Congress, need to take a hard look at the transit paradigm in the US. There has been quite a prevailing and concerning mindset that public transit is a costly endeavor that yields minimal benefits. As such, the paradigm for public transit has been to provide the bare minimum for essential community service, if at all. Transit service has been considered as secondary to auto-centric transportation policy, investment, and operations in the US. The challenge here is changing the decision maker mindset that transit investments are a quick agent solution, akin to a weight loss miracle that happens overnight, and deemed an immediate failure when immediate results for transit don’t emerge.

To move the needle forward for transit in the US, decision makers should look to the TransMilenio example, where Mayor Peñalosa laid out a long-term vision and strategy to achieve a sustainable and reliable transit system that can connect people to everywhere they need to go (and not just the peak job commute as is currently the US transit system modus operandi). Transit evolution in the US needs to start with a bold rethink of what transit is for and how it can benefit communities. Only then should we lay out the initial investments (only reaching for capital intensive investments after proven sustainable transit growth), and start iterating towards our achievable goals.

Follow the money: Where does your state stack up on supporting transit?

A passenger hops onto a bus on a sunny day

Even though transit service is a localized experience, the state you live in actually has a massive impact on your access to frequent, reliable transit. As with interstates, ports, or other vital parts of a state’s transportation network, state governments have a major role in supporting the planning, operations, and maintenance of public transportation service. But the financial commitment to transit varies widely from state to state.

Flickr photo credit: TriMet

In partnership with the National Campaign for Transit Justice, we assessed the quality of transit support and availability across all 50 states, the District of Columbia, and Puerto Rico. We’ll unpack our four criteria in a series of blog posts. This first post focuses on the dollars and cents: transit spending and restrictions on state tax dollars.

At a time when transit agencies are facing heavy financial stress, state support can be a key source of funding that allows transit to continue delivering reliable service. Most large transit systems, many of which are vital for supporting the largest regional economy in a state, operate with some level of support from their state. But that’s not always the case. There are statewide policies that impact a state’s financial commitment to transit, which can range from robust support down to almost nothing.

Transit agencies across the nation are nearing a fiscal cliff in 2023 as Covid-era relief packages expire. Click here to learn more.

Transit spending

If you’ve ever wanted to know what your state’s priorities are, take a look at the budget. That’s one of the first places we looked to assess state support for transit.

The 2021 infrastructure law increased federal transit spending, but in almost every case (with the exception of small agencies), these funds are not permitted to be used on operations, which means they don’t cover expenses like bus drivers’ salaries or bus maintenance. These expenses account for two-thirds of transit agencies’ total expenses, and without federal support, the burden of this funding can only realistically come from a few sources: state funding, local funding, and farebox revenue. The amount of state funding can have a major impact on the reach and quality of transit, especially in rural areas that don’t have as much local funding to supplement state dollars.

Click here to learn how transit spending on operations impacts local driving habits.

In the first graphic below, transit spending refers to each state’s total spending on public transportation in 2021—adjusted to per person rates to fairly compare states of varying size. We identified six bands of state transit spending per person:

  • Less than $12
  • $12.50-$25
  • $25-$50
  • $50-$100
  • $100-$200
  • More than $200

To see where your state lands, take a look at the figure below.

Map of state transit spending. For more information, see the text under "Transit spending." A table showing each state's spending will be available in our upcoming report, The Transit Report Card.
Map depicting statewide spending on transit per capita (or per person) in each state in 2021. Map is not drawn to scale.

While the map above shows each state’s most current spending levels (from 2021) on public transit, it’s not a full picture. Annual transit spending is also volatile, subject each year to the whims of state legislators, so these numbers from 2021 could look very different today. To get a stronger sense of long-term transit funding, we had to take a look at one of the frequent key sources—gas taxes.

State restrictions on gas tax revenue

Gas taxes are the taxes you pay every time you fill up a tank, and they’re the bedrock revenue stream for most states’ transportation systems. In fact, this is how we fund transit capital improvements nationally, by devoting a small share of the 18.4¢-per-gallon federal gas tax to a trust fund for transit. Yet in many states, it’s illegal to use state gas taxes for public transit.

Restrictions on gas tax revenue create a counterintuitive cycle, where all gas tax funding goes only toward building more roads, resulting in people having to drive more, which means more gas sold, which means more money spent on only new roads and no other travel options—leading to more driving and more spending. Without the reliable source of funding fuel taxes would provide, many transit agencies have had to rely on sales taxes, which are an incredibly volatile funding source subject to the swings of the economy. As a result, transit agencies can be forced to raise fares or cut service to stay afloat. 

Gas tax restrictions can come from state statutes or state constitutions. Statutes are laws that can be written, passed, and repealed by state legislators. On the other hand, to repeal any law in a state constitution, an amendment needs to be passed. It is more difficult to pass a constitutional amendment than to repeal a statute.

In seven states, gas tax revenue is restricted by state statutes. Though these prohibitions can be a frustrating roadblock for advocates and transit agencies, they can be repealed. In the figure below, these states are shown in medium blue.

23 other states have a clause in their state constitution prohibiting gas tax revenue from being spent on public transit. Edit 2/23/2023: Three additional states (MI, OK, and CO) have partial restrictions on the majority of gas tax revenue being spent on transit. All of these states are shown in dark blue below. Though constitutional restrictions are much more difficult to overturn, advocates who see their states have these restrictions shouldn’t give up. In some cases, the language may be vague or flexible enough to leave room for transit to receive funding, even if the law hasn’t been interpreted that way in the past. For example, Colorado advocates were able to win transit support by making their fight about the way their gas tax law was interpreted.

States with no restrictions, like California, Virginia, South Carolina, and New York, are shown in light gray. These states allow gas tax revenue to be used for transit, which can serve as a lifeline in times of economic stress.

Map of gas tax revenue restrictions by state. For more information, see the text under "State restrictions on gas tax revenue." A table of each state's restrictions will be available in our upcoming report, The Transit Report Card.
Map depicting restrictions on usage of motor fuel tax revenues in each state as of 2022. Map is not drawn to scale. Edit 2/23/2023: A previous version of this map erroneously included Illinois, Wisconsin, Florida, Massachusetts, Vermont, and Louisiana as states with constitutional or statutory restrictions. These states have no restrictions.

The bottom line

State spending is a strong indicator of state priorities, and low spending (coupled with a lack of funding options) is a clear sign that transit service is not at the top of state legislators’ minds.

Across the country, the transit fiscal cliff is looming. To weather the storm, agencies require financial assistance, or they’ll be forced to cut valuable service. Now is the time to increase transit spending at the state level. States with statutory and constitutional restrictions on funding for transit will need to think critically about how well these restrictions are serving them and their residents.

Keep an eye out for our next post in this series, which will focus on transit access and driving levels in each state.

Transit fiscal cliff or transit fiscal doom?

When ridership plummeted at the onset of the Covid-19 pandemic, transit agencies across the country experienced substantial operating budget deficits. The federal government responded by rolling out multiple relief packages to help agencies make it through the worst of the pandemic. Now, in early 2023, funds are running out. We surveyed transit agencies nationwide to see where they stand as federal support dwindles.

Baltimore Charm City Circulator. Photo via Flickr/Elvert Barnes Photography

What is the transit fiscal cliff?

According to the American Public Transportation Association, in the five years leading up to the pandemic, ridership was slowly declining across a range of transit agencies. Even with relatively stable ridership, transit agencies were already struggling to make ends meet. 

When the Covid-19 pandemic caused national lockdowns, ridership plummeted, causing revenues from fare collection to drop to almost zero. Without fare revenues, transit agencies no longer had the funding to cover their operating costs. And the federal government stepped in, rolling out three separate emergency relief packages, and incorporating increased support for transit agencies in the Infrastructure Investment and Jobs Act (IIJA). (Learn more about what the IIJA could accomplish for transit here.)

However, this funding alone was not enough. Ridership still hasn’t returned to pre-pandemic levels, and workforce shortages have only applied additional stress. Some local and state leaders also misinterpreted the new influx of federal cash as an opportunity to cut back on their own spending on transit, further delaying the recovery.

These combined stressors have created the transit fiscal cliff: the operating budget deficit expected at transit agencies across the country once their federal relief runs out. And for many transit agencies, the cliff is coming very soon—in some cases, as early as next year.

Above is a depiction of the Washington Metropolitan Area Transit Authority (WMATA) operating budget outlook for Fiscal Year 2024. The area outlined in the red dashed line represents the budget deficit. This graph is just one example of the drop-off, or fiscal cliff, many transit agencies expect to experience when federal funds run out.

How bad is it?

The National Campaign for Transit Justice (NCTJ) and T4America conducted a sample survey to paint a picture of the fiscal health of transit agencies around the United States as they approach the two-year anniversary of the last emergency relief package. In an effort to hear from a representative sample, we contacted about 40 transit agencies across the country, operationally diverse in size,  around the country. 

Out of the agencies we contacted, we received 27 responses. Here’s what we found:

1. Urban ridership recovery lags behind rural ridership.

We started our analysis by separating agencies into groups based on geographic area. 5 survey participants serve rural populations, 19 participants serve urban populations, and 4 participants serve both rural and urban populations. 

While there is a broad range, the majority of urban transit agencies report recovery levels lower than 75 percent of pre-pandemic levels. Rural agencies  reported a range of ridership recovery as low as 60 percent and as high as 90 percent. Meanwhile, jurisdictions that serve both rural and urban populations hovered near the top, reporting ridership around 80 percent of pre-pandemic levels. 

Increased workplace choice might explain the slow ridership recovery in urban areas. Workers who have greater workplace choice could have the option to work remotely and no longer rely on public transit to commute. We also found that urban riders are experiencing less reliable service due to workforce shortages. Service reliability is imperative to workers dependent on public transportation, and a lack of reliability could push riders to other travel options.

2. Most agencies are experiencing workforce shortages.

Since the onset of the Covid-19 pandemic, workforce shortages have been a major issue across sectors, including public transportation. We knew that the agencies participating in our study might be experiencing shortages, but we were unprepared for the prevalence of workforce issues.

Of our 27 participants, 24 continue to experience workforce shortages, starting when the pandemic began. Some agencies are short over 800 operators and maintenance workers who are vital for the day-to-day operation of transit agencies. As a result of the limited personnel, some agencies have had no choice but to cut service. 

To address these shortages, agencies are working to incentivize workers to join their team. See this blog post for more information on their efforts.

3. Two-thirds of transit agencies predict budget deficits by 2025.

We separated participants into three groups based on their timelines for expected operating budgets. An overwhelming majority of transit agencies expect budget deficits with start dates rapidly approaching. Transit agencies began running out of funds as early as Fiscal Year 2022, and only 5 of our 27 participants didn’t project an operating budget deficit.

10 out of 27 projected deficits starting in Fiscal Year 2024, and an additional 10 projected deficits starting in Fiscal Year 2025. Only 3 transit agencies projected operating budget deficits starting in the Fiscal Year 2026 or later and expected funds to last long term without intervention.

4. Transit agencies are implementing unique tactics to address budget shortfalls.

Participants varied in how they plan to address their deficits. Seven participants plan to increase fare prices, five plan to cut services, three are discussing ballot measures to increase funding, and the remaining are looking at solutions unique to their situations. One agency is looking to change service hours to reflect new traffic patterns. Another is looking to create a coalition of local businesses and institutions to philanthropically support the transit system, which would help replace missing fares.

It’s clear that transit agencies know the fiscal cliff is coming, and they’re not turning a blind eye. To continue delivering the service communities need, these agencies are offering creative solutions, showing a steadfast commitment to the operation of public transportation.

Help transit succeed

The Stronger Communities Through Better Transit Act (H.R. 3744), sponsored by Congressman Hank Johnson of Georgia, would allocate $20 billion annually to transit agencies’ operating budgets for four years, starting in FY23. The additional federal funding would empower agencies to make significant improvements to transit service. This could mean providing additional service or developing services for underserved communities. You can show your support for this legislation by calling your congressional representatives.

In addition to calling for federal funding, you can contact your state legislators and tell them to support similar legislation at the state level. In some states, that may mean advocating for constitutional and statutory changes that would allow the state to provide funding support for transit and alternative modes of transportation.

Another way to advocate for transit is by getting involved with your local government meetings. Providing feedback for members of local government is an integral step in improving transit service.

For too long, transit agencies have struggled to provide necessary service to our communities. So that all Americans are able to take advantage of this valuable resource, transit agencies must be given the support they need to deliver quality, reliable service.

Following through on the ADA: The All Stations Accessibility Program

The Federal Transit Administration (FTA) released a notice of funding opportunity for the All Stations Accessibility Program (ASAP) that allocates $343 million in fiscal year 2022 (FY22). This program offers competitive grants to localities for the upgrading of legacy stations so they meet the standards of the Americans with Disabilities Act (ADA) of 1990.

Flickr photo by MTA

Why do we need the All Stations Accessibility Program?

The transportation sector is a leading contributor to greenhouse gas emissions nationwide, and the majority of its contributions comes from driving in private vehicles. As we wrote in our report Driving Down Emissions, in order to reduce transportation emissions, we need to give people the option to travel outside of a car.

One such option is transit—like buses, subways, and commuter rail—but many barriers prevent people from replacing their daily car trips with transit trips. (Read our blog series for more information on the impact increased transit access and funding can have on car trips.) The Americans with Disabilities Act (ADA) of 1990 required transit stations to address one of these barriers: equitable access for people with disabilities.

Equitable access is pivotal for allowing people with disabilities to utilize other forms of travel outside of car travel. Walking and rolling to destinations presents its own challenges, because the majority of U.S. cities aren’t designed for walking and rolling. Destinations are spread out, and even nearby destinations might be on the other side of a wide, dangerous arterial road. In addition, many sidewalks aren’t accessible for people who use mobility aids, either due to obstructions like snow (and even EV-charging extension cords), poor maintenance, or inaccessible entrances and exits at intersections. For the 40 percent of people with disabilities who cannot drive, transit access can be an essential resource for daily trips.

However, even in cities with readily available transit networks, like New York City, people with disabilities do not have the access they need. That’s because, more than 30 years after the ADA was enacted, many legacy stations (public transit stations built before 1992 or commuter rail stations built before 1991) haven’t been updated to meet equitable accessibility standards. 

Many legacy stations were built without consideration or guidance on designs that adequately served riders with disabilities. Once the ADA was passed, the law required that any capital improvements made to public transportation or commuter rail stations must satisfy requirements of the ADA. However, ADA compliance presented an additional cost to transit agencies, so rather than install the capital improvements their riders needed, they avoided making these necessary changes to their stations. As a result, many legacy stations not only remain inaccessible—they’ve entered a state of disrepair.

The lack of available options can pose major issues in the lives of people with disabilities. Limited transit access can mean that one small change—like the only elevator at the nearest accessible transit station being out of service—can create hours of delays as a wheelchair-bound rider waits for paratransit, attempts to hail an accessible cab, or chooses a less direct transit route that requires multiple connections. Such delays can make all the difference in whether riders reach essential services, like healthcare appointments or job interviews, or miss their window. And in the case of natural disasters like hurricanes and floods, these delays can make it impossible for people with disabilities to safely evacuate using transit. As Jean Ryan of Disabled in Action put it, “access delayed is access denied.”

Reliable, accessible transit is an important resource for people with disabilities to reach their daily needs. Considering that a quarter of the American population is disabled, improved access for all travelers is also central to getting more people on the bus, subway, and train—boosting transit revenues and lowering transportation emissions. ASAP gives localities the funding they need to upgrade legacy stations so that transit stations can make good on the long overdue promise of the ADA and better serve all riders.

Has your transit agency applied for an ASAP grant?

The Notice of Funding Opportunity (NOFO) for the All Stations Accessibility Program was released on July 26, 2022. Applications for ASAP grants must be submitted for review no later than September 30th, 2022 at 11:59 p.m. States, local authorities (including MPOs), and other entities (like transit agencies) that operate or support legacy stations can apply for this grant. (Note: Even if local authorities miss their window for ASAP grants, they can seek federal funding for capital improvements to address accessibility. Learn more about transit funds made available by the new infrastructure law and check out our funding memo for more details.)

ASAP grants can cover up to 80 percent of the total cost of the proposed project. Localities must fund the remaining 20 percent of the total cost but localities can derive this funding from a variety of sources. The FTA has not released a maximum funding cap, but maintains the authority to cap funding during the selection process.

Localities can apply for two funding options: capital projects or planning projects. Capital projects include repairing, improving, modifying or retrofitting legacy stations while planning projects include developing or modifying ongoing projects to comply with ADA standards. If localities want to apply for both capital project funding and planning project funding they should submit separate applications for each project.

After the application process, FTA will assess applications based on criteria that consider the need for improvement, the benefits from the proposed project, coordination with stakeholders, local financial commitment, implementation strategy, and applicant capacity. The FTA will review this criteria as well as prioritize projects that address racial equity and barriers to opportunity. 

Operators of legacy stations have the responsibility to create an equitable riding experience, and now the ASAP can empower these entities to meet their ADA obligations and adequately serve all riders. To encourage transit ridership, agencies need to provide riders with reliable, accessible service—applying for ASAP grants will help them do just that.

Transportation for America members have access to exclusive resources that provide further detail on this topic. To view memos and other members-only resources, visit the Member Hub located at t4america.org/members. (Search “Member Hub” in your inbox for the password, or new members can reach out to chris.rall@t4america.org for login details.) Learn more about membership at t4america.org/membership.

Recruiting and retaining the best: Transit workforce best practices

Prospective applicants line up for a Sacramento transit hiring event

Transit agencies now have the federal funding needed to develop a world-class transit workforce, but pulling it off is another question. We’ve compiled strategies for success from agencies that have implemented real solutions to empower their operator and maintenance workforce.

Prospective applicants line up for a Sacramento transit hiring event
Sacramento residents line up for a job fair at their Regional Transit District (source: SacRT)

We wrote about the dwindling transit workforce last fall and earlier this spring, but here’s a quick summary.

When the pandemic started, transit operators were already strained by a stressful work environment and long, unpredictable hours. The pandemic presented new challenges, not the least of which was a lack of ridership that left transit agencies strapped for funds. As agencies tried to cope operators were let go, or they saw their wages/hours significantly reduced even as their jobs grew more difficult than ever. (Check out TransitCenter’s report on Bus Operators in Crisis to understand how difficult these jobs have become.)

Now, as ridership is rising, agencies are finding themselves without the necessary staff to meet demand. We’ve made some suggestions before about how to fill this crucial need and keep it filled—in short, transit agencies need to properly invest in their workforce and provide them with the support they require, even through periodic tough times. But right now, as federal funding helps to fill agencies’ wallets, how can they recruit transit staff?

We spoke with transit agencies that are trying to understand their staff and use innovative recruitment strategies to address their workforce needs. Here’s what we heard.

Understanding the employees’ experience

To better understand their employee retention hurdles, Bay Transit of Middle Peninsula Virginia decided to deploy an employee survey. They evaluated employee perceptions of workplace attributes (such as benefits, competitive wages, and less concrete ideas like agency trustworthiness) and identified gaps between employee expectations and Bay Transit’s actual performance. This information helped them determine what their employees needed from them and how they could be a more competitive workplace.

Further down the Chesapeake Coast in Hampton Roads, Virginia, Hampton Roads Transit (HRT) took a more direct approach to employee engagement, this time with a focus on its management team. Like most transit agencies, operators were welcome to attend and speak with the agency’s management team. But many HRT operators did not have the time or means to schedule and/or attend these meetings, and often had no idea how to engage their management at all. So the management team decided to visit the system’s bus depots and in-service vehicles to speak with operators about the issues they were dealing with on the job. This experience allowed them to become better advocates for their employees when speaking with the agency’s governance board and provide their workforce with the support it needs.

More support for current workers

Even before the COVID-19 pandemic, the Missoula Urban Transportation District, or Mountain Line, in Missoula, Montana was in a labor free fall. They were understaffed, with remaining employees facing high burnout and low morale, while voters had approved a transit expansion that was going to require a 30 percent workforce increase. Voters acknowledged that an expansion required increased funding for transit but were unsure of the most impactful ways to spend the funds. In 2021, Mountain Line was only able to retain 50 percent of its new hires. They were going the wrong direction.

In the fall of 2021, Mountain Line developed a new strategy. First, its board decided to use part of the new funding approved by votes to increase wages 15 percent across the board, a massive jump in pay that allowed them to compete with other employers in Missoula. This also made their employees feel more valued. Mountain Line found this strategy to be the most effective for recruitment. They also invested in improving the internal culture for their workforce by initiating a Diversity and Inclusion Committee and improving internal communications. (Read more about Missoula’s efforts to turn the corner on employee retention on page 16 of the Passenger Transport magazine.)

Overcoming barriers to recruitment

Photo from Wikimedia Commons

There are many reasons people do not apply to be transit operators. As a transit rider, the job can appear difficult and thankless. Des Moines Area Regional Transit (DART) tried to do something about that by allowing people to test drive buses to see whether they were comfortable behind the wheel. They invited people to the Iowa State Fairgrounds to test drive a 40-foot long bus through an obstacle course. At this event they also advertised a $3,000 sign-on incentive to new drivers with a Commercial Drivers License (CDL) and a $2,000 sign-on incentive to new drivers without a CDL. 

The IndyGo transit system in Indianapolis realized they were losing out on applicants with non-violent criminal records. Many of these applicants were well-prepared to be transit operators or mechanics, but they were blocked from working for IndyGo by a rule that had no bearing on their ability to do the job. So IndyGo created the Second Chance hiring initiative to help level the playing field for applicants who may be highly qualified but have had a criminal conviction.  

Back in Hampton Roads, HRT has tried to boost their dwindling recruitment numbers by forming a partnership with Tidewater Community College to create the Drive Now program. Drive Now provides free training to prospective transit operators that includes a CDL, a Virginia Career Readiness Certificate, and customer service and workplace skills. These skills and certifications can be expensive to acquire on one’s own, so Drive Now helps pave the way for new applicants to find jobs in transit.

Finding hires in unexpected places

When the Alexandria Transit Company (DASH) found themselves with a shortage of trained technicians to service their buses, they looked beyond their recruitment practices to where those practices were being implemented. They were mostly targeting experienced diesel technicians from heavy vehicle industries with similar skills that are needed for bus maintenance. DASH soon realized, however, that this applicant pool was too narrow to meet their capacity needs, so they widened their search to include technicians from outside fields (mostly automotive) with comparable skills and similar foundations. This brought in talent that may not have discovered careers in transit and reduced the barrier to entry. When veteran operators trained new hires to become diesel mechanics, they discovered that they also deepened their own knowledge and skill.

To address its recruitment issues, the Sacramento Regional Transit District (SacRT) turned to its riders. They advertised free rides for anyone that attended hiring events. These riders were familiar with the system, and many were comfortable being trained to operate its buses.

Developing a workforce for the future of transit

Perhaps the newest frontier of transit workforce development is in operating low and zero-emission vehicles. On Tuesday, August 16, the Federal Transit Administration (FTA) announced the first round of 150 grants awarded under the Low- and No-Emission (Low-No) and Bus and Bus Facilities programs. The Low-No program requires grantees to 1) create Zero-Emission Fleet Transition Plans and 2) spend 5 percent of award money on workforce development training, including apprenticeships and other labor-management training programs as recipients make the transition to low or no emission vehicles. 

This workforce development requirement yielded some innovative recruitment and training ideas. One example is Omnitrans in San Bernardino County, California, which will spend part of its $9.3 million award to launch its comprehensive workforce development program (under its strategic plan) to increase compensation, improve professional development, provide stability, and improve the internal culture. Another example is MARTA in Atlanta, which will use part of its $19.3 million award to support its 2-year apprenticeship program and collaborations with local technical colleges.

So what?

Though local actors are producing innovative solutions, national problems persist. Transit operators face rising rates of assault from riders. Operators are still recovering from the increased stress of the worst part of the COVID-19 pandemic. Many transit labor forces, even in massive systems like Amtrak, remain overworked and understaffed

The money to fix these issues is available. The new infrastructure law provided numerous funding streams for workforce development, including the Low-No Program. Also, the U.S. Department of Transportation will now cover 100 percent of the cost of workforce development programs if they are paid for out of the ample-funded highway formula programs. 

The time to take decisive action is now. The communities that succeeded often did so because of proactive engagement and collaboration between local advocates and their public officials to explore and implement innovative solutions. It will be up to local administrative and political will to implement the proven strategies laid out in this article.

King County’s blueprint for better bus speed and reliability

Transit rider at King County Metro bus stop

The Seattle area’s busiest transit agency released their “playbook” for better transit through smart incremental improvements and community partnerships. Focusing on bus speed and reliability, this guidebook is a valuable resource for any transit agency looking to build trust with riders.

Transit rider at King County Metro bus stop
Flickr photo by Joe A. Kunzier Photo, AvgeekJoe Productions

In King County, WA (Seattle and its surroundings), transit demand is booming. The region has made forward-thinking investment and policy decisions that support smart development decisions, allowing them to maintain a high quality of life amid rapid growth. They’ve made a serious commitment to transit—not only through expansion, but through bolstering existing services—and built efficient infrastructure while incentivizing ridership. As a result, King County has grown a strong transit user base, reduced single-occupancy driving downtown, and cultivated stronger and healthier communities. 

So when their busiest transit agency—King County Metro—released their comprehensive Bus Speed and Reliability Guidelines and Strategies in August, they showed the world what they call their “playbook” of operational tools and capital projects that save riders time and communities money. At a time when building public trust in transit is essential, it’s an excellent guide to the infrastructure and services that make transit trustworthy.

King County Metro (or just Metro) was one of America’s ten most-ridden transit agencies in 2019, and the busiest not to operate any rail services. They achieved this high ridership through smart comprehensive planning (and funding!) for services that run to the places where people actually go. They’re the core provider of local buses in King County, with a strong network of frequent routes in dense core neighborhoods, rapid routes that take riders between communities, and freeway express routes that run on dedicated lanes. Together with the regional agency Sound Transit, as well as agencies in neighboring Pierce and Snohomish Counties, Metro is a national leader in smart transportation planning.

What strategies does the report propose?

In the report, Metro details the incremental infrastructure strategies they implemented to gradually improve street-level bus systems. They provide design initiatives that help buses skip past traffic, including changes to street and intersection design, bus stops and routing, traffic flow alterations, and signaling improvements. The advantages and costs of each are outlined in a digestible format, along with guidelines and extensive examples from the region. 

Street design improvements involve physical changes to the street itself, prioritizing buses in areas where cars often get in the way. Metro proposes dedicated bus lanes and short bypass lanes as projects where buses get their own space. Relatedly, changes to road channelization—that is, the flow of traffic, particularly approaching intersections and the size and design of turns—can have a tremendous impact on bus speed.

Metro also took a look at bus stop planning. The location and design of bus stops can inhibit the stopping and boarding process, slowing down the ride. The report explains how lengthening bus stops—to accommodate more than one bus at a stop at the same time—makes boarding quicker and more convenient for riders, as well as how lengthening stops can be integrated with other design strategies like bulb-outs that slow traffic and enhance pedestrian crossings. Thoughtful bus routes are integrated with these stops and avoid unnecessary turns and choke points.

King County metro bus at an intersection with a crosswalk and painted bike lane
Flickr photo by Oran Viriyincy

Changing traffic control through regulations and signaling is another strategy. Turn restrictions can work alone or go hand-in-hand with street design improvements to move buses faster through intersections, and strategically altering or removing parking frees up lane space and makes it easier for buses to access stops along a sidewalk. Metro explains a few ways that reprogramming traffic signals can also help. The timing of green lights on a street can be adjusted to match the pace of a bus as opposed to car traffic. And technology allows Metro buses to directly change signals, so buses don’t need to wait at red lights or behind cars at intersections.

With a roadmap for physical design in place, Metro also plans to bring communities to the table. Metro operates in many cities throughout King County. The roles of Metro and the appropriate jurisdiction are included in the report alongside key tasks for the planning, design and implementation, and performance management steps for both Metro- and jurisdiction-led projects. Metro lays out several principles for a general cooperation process and timeline, making the report an excellent starting point for other agencies to reference in planning their own partnerships.

“It’s important to build trust and a great working relationship with city staff,” says Irin Limargo, capital planning supervisor at King County Metro. “This effort can start with projects that offer a win/win for transit and traffic, then try to move to higher transit priority treatments.”

Why is it important?

King County may be among the first to publish such a report, but other transit agencies looking to increase reliability and ridership should take notice. Although its examples are centered around the Seattle region, its practices are applicable anywhere.

“In our observation, improvements implemented in Downtown Seattle, even if providing just a few seconds of delay-reduction per trip, can rack up thousands of operating hours savings each year due to the large number of trips operating through that area. That said, our suburban and smaller city partners are equally important because transit operates as a system and routes cross city boundaries,” says Limargo. 

The report offers tried-and-true strategies that go hand-in-hand with the core principles of smart transportation policy, safety, and accessibility. Coordination is a persistent theme in this report, and it goes beyond the six jurisdictions that worked together in its publishing. Their incremental approach gives new life to existing infrastructure and makes it more useful and long-lasting than a continued dedication to unsustainable driving patterns. It prioritizes safety by proposing improvements that intentionally slow down or decrease the influence of cars in a given area, and it makes pedestrian and transit infrastructure more publicly visible than it is today. And improving speed and reliability through small improvements can help riders reach more places more consistently. 

Special thanks to Peter Heffernan, government relations administrator at King County, for getting us at T4A in touch with Irin Limargo.

USDOT and Congress: Taking sides but not talking about implementation

Sheltered Richmond bus stop by a bus only lane

If we’re going to ensure that the historic amount of transit funding in the infrastructure law actually results in good, usable, high quality transit that improves access to jobs and services, Congress is going to need to do a better job of oversight and thinking through the very real and difficult issues at hand for transit, not just arguing about whether or not transit is a vital part of transportation and mobility in communities small and large.

Sheltered Richmond bus stop by a bus only lane
Vital topics like how to use the IIJA to institute more practical improvements to transit like Richmond’s were not on the docket during this week’s Senate Banking Committee hearing. GRTC bus rapid transit photo by BeyondDC on Flickr

Nearly two weeks ago, Secretary Buttigieg testified before the Senate Committee on the Environment and Public Works. On paper, the purpose was to discuss implementation of the infrastructure bill. However they instead wasted much of the hearing arguing about a harmless Federal Highways Administration memo calling for investment in repair and safety projects, improving equity, and reducing emissions. One side didn’t like the existence of these priorities on a piece of paper while the other side tried to point out that these priorities are all clearly laid out in the bill (even if the bill does little to further them). There was no real conversation about implementation ideas or needs, and the very real challenges of spending this money in a way that improves the state of our country’s infrastructure and helps connect people to opportunity.

Unfortunately, that trend continued this week during a Senate Banking, Housing, and Urban Affairs Committee hearing about public transit and the infrastructure law.

While the majority showed a willingness to ignore bad faith arguments from the minority and certain invited guests about whether or not transit should even exist, they will need to do far more in the future to address very real concerns about ensuring that transit money get appropriated in a timely way, that USDOT advance new capital projects smoothly, how to handle very real workforce challenges in the transit industry, aligning transit investments with equitable transit-oriented development, and positioning transit to be a reliable and competitive mode for people to use within their community. In fact, the Federal Transit Administration is currently seeking input on their rules surrounding the Capital Investment Grants, like New Starts—a topic that would have been good to discuss.

Senator Sherrod Brown (D-OH) described the vital service that public transit provides in our communities, highlighting the example of a worker spending a day’s wage on Uber or Lyft to get to/from work on a Sunday to keep their job, because there isn’t any transit service. The Senator painted a clear picture why transit needs more investment to improve the experience of existing transit riders and make the service viable for millions of new riders, connecting this need to the current pain of high gas prices, saying “if people had reliable public transportation then they don’t need to decide between gas and rent.”

Senator Brown during the hearing

Unfortunately, ranking member Senator Pat Toomey (R-PA) seems to have no real interest in ensuring that transit serves Americans well. He derided past investments in public transit, including the COVID relief funds that continued to connect essential workers to work during the pandemic, as wasteful spending and for not “paying its fair share. The senator incorrectly noted how vehicles pay gas tax to pay their fair share of the transportation system, seemingly unaware that the gas tax hasn’t come close to paying its share in 15 years or more. (Tens of billions in general tax dollars have been transferred into the highway trust fund after the gas tax declined in value and failed to cover what Congress was still sending out to states.) 

Senator Toomey

Rather than getting into the specifics of what all of the speakers said, it is frustrating that we have now finished the second Senate hearing about implementation of the infrastructure bill with little-to-no substantive conversation about implementation. How is this money going to be spent? What kinds of transit projects are going to be funded? How is USDOT going to speed up the dreadfully slow pipeline of transit capital projects (especially compared with relative ease for highway projects)? What’s wrong with the measures that the Federal Transit Administration uses to score projects for funding, and how could those measures be improved to prioritize access? These kinds of questions were completely absent from the day. 

Congress has a vital role in oversight and accountability, and prodding the administration to update old vehicle-centric rules and standards and empower transportation agencies to reduce the impact of the system on the environment and communities and better connect people to jobs and necessities. (Many of our recommendations are listed here.)  

While the rest of the speakers were a stark display of contrasts, the committee never really probed the implementation steps that USDOT or Federal Transit Administration could take to fill any holes in the legislation or better support the goals of the witnesses and needs of transit systems and riders. They didn’t even acknowledge that they exist. 

Going forward, we need Congressional committees to lead oversight efforts that focus on specific implementation steps needed, any problems in implementation, and especially the results. To do that, the members will have to be an active participant and bring a probing skepticism to ensure we are doing all we can to get the most out of the law. And unfortunately, there will need to be a discussion about how to sideline histrionics about unenforceable memos as well as members or witnesses who are totally out of step with the mainstream and seemingly have no interest in delivering a strong transportation system for drivers and non-drivers alike.

Transit adaptability during the COVID-19 pandemic

Blue Pittsburgh bus

Transit agencies across the United States have struggled with decreased ridership, safety hazards, and low morale as a consequence of the COVID-19 pandemic. Yet some have responded by changing their approach to better serve everyday riders, make transit free or more affordable, and rethink what the future of transit should look like to reduce emissions and provide access for those who need it most.

Blue Pittsburgh bus
Port Authority of Allegheny County (Pittsburgh) buses. Flickr photo by Can Pac Swire.

This post was written by Devin Willis, program associate at Smart Growth America. It is the fourth of a series of posts on this topic—find the full set here. Some of the agencies profiled in this piece were interviewed with support from the Kresge Foundation. 

This series has explored how public transit is an essential part of mitigating climate change by reducing emissions. Connecting more people to their everyday destinations via public transit offers a way to cut back on vehicle miles traveled (VMT) and transportation emissions. 

We’ve been writing this series against the backdrop of the COVID-19 pandemic, which has presented unprecedented challenges for transit agencies and the millions of riders they serve. Transit providers all over the country are struggling with revenue loss due to the massive ridership drop in 2020, service cuts, driver shortages and illness, vaccine skepticism, and low morale. Although the funds for transit in the 2021 infrastructure bill will help, those funds can’t help fund operations for most transit agencies or undo the damage caused by the pandemic. (The American Rescue Plan, passed during the pandemic, does specifically provide emergency operations support for transit agencies.) 

This is a slight detour from our series about the potential of reducing emissions with more transit, but we wanted to profile a few transit agencies that shifted their approach during this historic pandemic to provide better access for their riders and rethink the future of transit in their communities—both of which are stepping stones to more significant improvements that can help reduce emissions.

Richmond, VA preserved ridership levels with fare-free transit and a past network redesign

Sheltered Richmond bus stop by a bus only lane
GRTC bus rapid transit. Flickr photo by BeyondDC.

Unlike many transit agencies nationwide, Richmond’s public transit only suffered a relatively modest drop in ridership, and has already recovered local bus ridership to pre-pandemic levels. This is likely due in part to a handful of bold actions on the part of the city government and the Greater Richmond Transit Company (GRTC). GRTC CEO Julie Timm, hired just six months before the pandemic, attributes their success to three main steps taken:

1) The strength of the 2018 network redesign connecting essential workers to jobs; 2) the extensive COVID protective measures enacted early and throughout the pandemic to protect staff and riders; and 3) the ongoing commitment to Zero Fare operations to protect the health and financial stability of our riders. GRTC’s focus on connecting people to essential resources resulted in higher sustained ridership.

As Timm notes, before the pandemic in 2018, GRTC implemented a significant redesign of its bus routes to improve access and produce faster, more consistent service. Their redesign includes new route names and numbers (routes are now named after major roads that are well known to locals like Hull Street), increased bus frequency, and easier connections. This service redesign successfully produced an increase in ridership every month between June 2018 and February 2020, reaching a full 29 percent increase over that time period and providing a solid foundation to build upon during the difficulties of the pandemic.

The most notable change that GRTC made during the pandemic was the decision by the GRTC and Mayor Levar Stoney in March of 2020 to suspend all fare collection from bus riders. In Richmond, the majority of the bus service ridership and revenue comes from the often economically distressed households of essential and low-income riders. This shift to 100 percent free transit spared many families and workers from having to choose between their bus fare and other needs like food, medicine, and employment access.

While Richmond was not the only city to introduce fare-free policies during the pandemic, GRTC is among the more successful cities to do so, effectively preserving the city’s bus ridership and maintaining the zero fare policy longer term. And two years later, GRTC is continuing to offer fare-free transit while most other cities that did so have since returned to their previous fare policies. The GRTC was awarded $8 million in state grant funding from the Virginia Department of Rail and Public Transportation to continue experimenting with the effects of zero fare policy over the next three years through June of 2025. The City of Richmond and Virginia Commonwealth University have agreed to match this funding in support of the zero fare policy and its positive effect on bus riders.

Atlanta, GA looks to restructure service to respond to changing needs

MARTA buses in Atlanta. Flickr photo by James Williamor.

Before the COVID-19 pandemic, the Metropolitan Atlanta Rapid Transit Agency (MARTA) had approximately 110 bus routes with over four million passengers per month. In the early months of the COVID-19 pandemic MARTA, like many other US transit agencies, watched ridership crater. And in the intervening two years of the pandemic, they have struggled to bring their ridership back to pre-pandemic levels. At present, MARTA’s ridership is approximately 65 percent of pre-pandemic levels. 

Similar to Richmond’s 2018 redesign but taking place during the pandemic, MARTA launched a major initiative to restructure bus service as a response to the pandemic and to better address the needs of residents. MARTA is currently leading a major online and in-person community engagement effort, soliciting feedback and ideas regarding new potential bus routes and service types. MARTA is posing key questions to its riders directly about the tradeoffs between service frequency and breadth of coverage directly: do riders want to see fewer routes with more reliable, frequent service between highly-trafficked areas (similar to the changes Richmond made, as well as Columbus and Houston) or more routes in more neighborhoods but less convenient service on those routes? Following the engagement, the proposed redesign concept will be released in the spring of 2022.

In addition to the bus network redesign, MARTA has also begun to experiment with mobile ticketing and fare collection to ensure the wellbeing of transit operators and riders. The agency added a mobile ticketing system in order to make transit use more contactless and limit the spread of coronavirus. MARTA hopes to make these changes permanent.

Pittsburgh, PA reroutes buses to better serve low-income riders

Pittsburgh’s Port Authority of Allegheny County lost 80 percent of its ridership during the coronavirus pandemic. Prior to the pandemic, the Port Authority’s transit network was historically focused on connecting suburban commuters to downtown Pittsburgh from residential and suburban areas in the surrounding region. When the pandemic hit and many of those office jobs switched temporarily or permanently to remote work, this type of commuter ridership dried up almost completely. 

Like many other transit agencies, the pandemic spurred the Port Authority to reconsider how best to serve its lower-income passengers who rely on public transportation and may not have other options. Pittsburgh increased bus and rail frequency for 37 percent of the neighborhoods within its service area. This is part of a larger shift away from commuter routes and toward providing more service in low-income neighborhoods. Pittsburgh’s transit agency has also added more off-peak and weekend hours to accommodate riders who do not work on a 9-to-5 schedule. 

The Port Authority also implemented changes in the fare system to encourage different types of riders to use the bus system. They recently introduced a modest fare proposal that would restructure the bus fare pass from a calendar-based weekly and monthly pass system to a more flexible 7- and 31-day pass system. This move is a good first step as it removes the bus pass from the commuter-centric five-day week and allows the bus system to better serve non-commuters such as persons traveling on the weekend or outside of rush hours. Locals have pushed for even more significant changes, including fare-free service or a similar policy. One proposal recommends that fares be limited for low-income passengers who are SNAP/EBT beneficiaries.

What’s next

The steps these agencies have taken are examples of what other agencies can do to increase ridership and safety in the pandemic. While the challenges faced by transit agencies during the COVID-19 crisis are very real and there are not easy solutions, the agencies profiled here were able to respond to the changing needs that they observed, focusing on providing access for those who need it most, potentially reducing emissions in the process by improving access and ridership. This type of responsive, nimble approach to transportation infrastructure will help make transit a viable alternative to driving and will help us reach our climate goals.

Reducing emissions with better transit, part three: Examples from leading cities

Flickr/Creative Commons of a Metro Transit METRO C Line bus photo by Tony Webster. https://www.flickr.com/photos/diversey/49040491042.

Greater transit use is key for lowering emissions, and cities across America are reconsidering how they serve their residents with public transit—and the land uses that encourage better service and ridership. Several cities are laying the groundwork to make this happen—even outside of the “transit hotspots” one may expect.

This post was written by T4America policy intern Jackson Pierce. This post is the third in a series of posts on this topic—find the full set here.

In our first and second installments of this series, we showed how proper funding for transit operations and for increasing transit access are a one-two punch that makes transit more useful, lessening the need to drive and in turn lowering emissions. The historic influx of transit funding coming from the infrastructure bill provides an opportunity to better connect people to the jobs and services they need while reducing climate impacts. These improvements will also help address equity concerns by providing better quality service to more people who urgently need it. In our third installment, we highlight how Houston, Columbus, Austin, and Minnesota’s Twin Cities have made strides toward better service and smarter planning by focusing on providing better transit access to adapt today’s limited funding to existing infrastructure.

Houston and Columbus rescued their bus systems from low ridership by starting fresh

Houston—with a population ranked 4th in the nation by city proper, 5th by immediate metro area and 9th by expanded metro area—is infamous for its wide highways, sprawling cityscape, poor walking infrastructure in many areas, and nearly ubiquitous accommodation of the motor vehicle. Yet Houston has also become a public transit leader by significantly redesigning its bus service from the ground up in 2015 to focus on giving as many people as possible access to frequent, high quality transit, with help from transit consultants Jarrett Walker & Associates.

Houston is recognized as a leader for good reason. The city redrew its former bus network from scratch, allowing METRO (the city’s transit agency) to consolidate redundant routes into more frequent, centralized patterns that served population centers more often.

Houston’s frequent bus routes before and after the redesign.

On August 15th, 2015, a network of mostly infrequent bus routes converged downtown, which was not where most bus riders needed to go in the very decentralized metro area. On August 16th, these same buses ran on a brand-new network, a grid of 22 frequent routes that allowed access to multiple spread-out dense activity centers and neighborhoods. It was a transformation that required no new resources (outside of signage and wayfinding changes), just a smarter approach that recognized the city’s changing development patterns. (Read Smart Growth America’s longer 2015 profile of this story, just before the changes went into effect, which details the planning and work that went into it.)

There are a few things worth recognizing when discussing the replicability of Houston’s plan in other cities. Houston’s old network had clear redundancy in its routes. In other cities these routes may not exist, or have been cut in the past, so a comparable result to Houston’s “cost-neutral” solution may require greater investment overall or adding more resources elsewhere. Houston is also anchored by the Red Line, one of the most successful modern light rail projects in the country, and having that service as a network cornerstone bolstered METRO’s ridership on both modes. 

While Houston is a popular example of a completely redesigned network, the idea has been successfully replicated at smaller scales.

By Ɱ – CC BY-SA 4.0, https://commons.wikimedia.org/w/index.php?curid=89607531

Columbus: Before Columbus redesigned its routes in 2017, for example, their bus map had been largely unchanged since 1974—even though the region had become one of the fastest-growing in the country. COTA (the Central Ohio Transit Authority) didn’t have the fleet size or duplicative routes that Houston’s METRO did, but managed to add seven frequent routes to their previous total of three, including two new crosstown routes that matched the city’s multi-centered development patterns. 

Equity was a major concern during Columbus’ route redesign, leading Columbus to emphasize improving the frequency of their routes on weekends. Columbus also introduced their CMAX rapid bus line in 2018. While not “true” bus rapid transit—lacking dedicated lanes, off-board fare payment, and frequent headways on weekends—it still provides a solid anchor service for COTA’s other routes to feed into.

Frequent routes on COTA before and after the update.

Despite a nationwide decrease in transit ridership in the 2010s, Houston and Columbus both grew their ridership with their redesigns. Within a year of opening Houston saw a six percent growth in system ridership, and before the pandemic, Columbus’ ridership was up four percent overall since the 2017 redesign. This occurred because both cities updated their transit network to match changes in development patterns, improving transit access in the process.

In Austin, a strong baseline is paying off

CC photo of an Austin bus by I-ride capital metro on Flickr https://www.flickr.com/photos/i-ride/5179709865/

Austin’s population has nearly doubled from 2000-2020 and its transportation systems are struggling to keep up, but the region’s major transit agency, Capital Metro, is working its way toward an accessible and intuitive system.

In 2010 Austin launched Capital Metrorail, a 32-mile commuter rail line that failed to draw significant riders, because it runs infrequently and misses much of the city’s density. To address that gap, in 2014, Capital Metro launched MetroRapid, a rapid bus system (similar to Columbus’ CMAX) featuring two lines making limited stops along some of the city’s main north-south corridors, hitting the neighborhoods that Metrorail missed, including the downtown core, south Austin, and the University of Texas. And in 2018, Capital Metro also embarked upon a full bus network redesign, which they dubbed “CapRemap.”

Austin’s current high frequency transit network.

CapRemap followed the principles of Houston and Columbus’ work, achieving similar results. A year after CapRemap’s release, the total bus system’s ridership had increased by about 4 percent and MetroRapid’s increase was about 6 percent—indicating that improving the grid of routes that increase accessibility across the city also strengthens the core of the system. Capital Metro also introduced new standards of mapping and signage that make Austin’s buses easier to use and navigate. 

These improvements contributed to the success of a ballot initiative in November 2020 for the agency’s much more ambitious $7 billion ProjectConnect plan (click to see a map.) At the center of that plan are two light rail lines, which largely follow the current MetroRapid routes, paired with the introduction of new MetroRapid upgrades for some of the busiest existing bus routes. ProjectConnect is evidence that a well-planned baseline system will grow public support for more substantial infrastructure through incremental upgrades.

The Twin Cities are focused on serving corridors with the highest driving demand 

Compared to the prior examples, Minnesota’s Twin Cities are taking a more incremental and perhaps unconventional approach to transit improvement and network strengthening. Like in Houston, many of the region’s main activity centers—like downtown Minneapolis, downtown St. Paul and suburban Bloomington—are connected by well-used local light rail services, which are reinforced by a grid of crosstown bus routes. Sixteen of these bus routes run every 15 minutes or better on corridors that are highly traveled but do not need the level of capacity that rail provides, and the region’s transit agency, Metro Transit, sees this network as a key to improving access throughout the region. 

A METRO C Line bus by Tony Webster.

Kick-started in 2010 by the region’s Transit Master Study, Metro Transit has begun upgrading several of its busiest bus lines to what they call rapid arterial routes by “stopping less frequently and allowing passengers to pay before boarding.

The A Line and C Line are currently operating as “backbone” routes of the bus network, with three more (F, G, and H) prioritized for near-term service frequency upgrades in the agency’s 2021 Network Next plan. This plan, set to be updated every five years, is centered around making data-driven, equitable decisions that improve speed and reliability. 

Metro Transit is also working to better integrate local buses into its larger regional bus network, branded with colors, which operates partially on major freeways. The Orange Line, which just opened in December 2021, travels in dedicated high-occupancy toll lanes southward from downtown along Interstate 35W, one of the region’ busiest freeways. Unlike some freeway express routes in other cities, the Orange Line runs in both directions at 15-minute intervals (during weekdays) and serves substantial, accessible modern stations that bridge the gap between the speed of freeway travel and the pedestrian accessibility that serves successful transit. This approach also acknowledges the reality of the region’s multiple centers and serves the places that people are already going by car.

One of the I-35W rapid bus median stations on Metro Transit’s new Orange Line. Photo by Metro Transit.
Final construction of an I-35W rapid bus median station on Metro Transit’s new Orange Line. Photo by Metro Transit.
An early rendering of an I-35W rapid bus median station on Metro Transit’s new Orange Line. Photo by Metro Transit.

When the COVID-19 pandemic hit, Metro Transit became one of a number of agencies to adjust its service to respond to shifting transit needs and provide better access: by lowering fares, providing near-term service to get students to school in the wake of bus driver shortages, and expanding a program to provide targeted transit passes to specific apartment buildings to better meet the needs of residents and actively reduce car-dependence. 

The agency’s strategies stem from three principles, according to Metro Transit arterial bus rapid transit manager Katie Roth, who collaborated with T4A in this case study: 1) to meet the market for transit as it stands today, 2) improve the market for transit for the future, and 3) improve access to transit in communities that have historically suffered disinvestment. “This is how we’re going to emerge from the pandemic as a transit system,” she says. 

Following traveler demand and creating a reliable all-day network will boost the resilience of neighborhoods around the region, providing a solid foundation to expand upon with their Network Next plan.

What other communities can learn about improving transit access 

Making a real impact on our climate will require providing transit that offers a true alternative to driving. While there is no “one-size-fits-all” answer that works for every city and no US city that has fully solved this puzzle, the agencies profiled here have several things in common: they used data to understand service needs and were willing to rethink their route structure—sometimes dramatically—to provide better access for people most reliant on transit and keep up with changing development patterns, often seeing significant increases in ridership as a result. 

Unfortunately, no amount of clever service redesign will make up for resources that simply aren’t there, so increasing transit funding must be part of the picture. And even a significant boost in funding won’t be enough to meaningfully improve transit access for all the people who need it in the more sprawling areas of our metro regions, so putting more people in the path of high quality transit by changing local development practices is a critical step on the path to a lower-emissions transportation system.

The Twin Cities region isn’t the only one that has updated its transit service to respond to evolving needs during the pandemic and beyond. In our final post in this series, we will be profiling agencies that have changed their approach during COVID to shift some focus away from traditional 9-to-5 commuters, make transit more affordable, and rethink what the future of transit should look like to reduce emissions and provide access for those who need it most.

The infrastructure bill’s limited state of repair funding and policies

Flickr photo of bridge resurfacing by WSDOT. https://www.flickr.com/photos/wsdot/49921039787

There is very little new funding in the infrastructure bill specifically dedicated to repair and no new requirements on highway monies for prioritizing repair on roads and bridges. Overall the law doubled down on the practice of giving states immense flexibility with the bulk of their money and then hoping that they use that flexibility to prioritize repair. Advocates should be ready to hold states and metros accountable for making progress. 

promo graphic for a guide to the IIJA

This post is part of T4America’s suite of materials explaining the 2021 $1.2 trillion Infrastructure Investment and Jobs Act (IIJA), which governs all federal transportation policy and funding through 2026. What do you need to know about the new infrastructure law? We know that federal transportation policy can be intimidating and confusing. Our hub for the new law will walk you through it, from the basics all the way to more complex details.

The law’s shortcomings

I-35W in Minneapolis. I-5 over the Skagit River in the Pacific Northwest. Miami’s pedestrian bridge at Florida Atlantic University. The 295 pedestrian bridge in Washington, DC. Last week’s bridge collapse in Pittsburgh, PA.

I-35W

Those are just a few high profile US bridge collapses over the last decade. Many smaller ones have escaped national scrutiny. And of course, who knows how many potential collapses were avoided (good!) through weight restrictions, lane closures, or outright closures that resulted in lengthy detours (bad!).

These collapses all happened for a plethora of overlapping reasons related to engineering, age of infrastructure, design flaws, ineffective inspection systems, and others, but they are also the by-product of our overall reactive vs. proactive approach to repair and our failure to require repair ahead of building new. The House’s five-year INVEST Act would have instituted a fix-it-first requirement, but the Senate and the administration discarded INVEST and ultimately struck a deal to continue the status quo on repair: giving states money and freedom, and hoping they use their discretion to maintain the system.

What’s in the law?

While states are given wide latitude on how to spend their money, they unquestionably will have more money at their disposal for the next five years because nearly all of the core programs that are typically used on repair needs increased in size. There are two major programs worth highlighting:

1) The National Highway Performance Program (NHPP) is one of the two largest sources of funding used for repair—about 53 percent of all states’ base highway formula apportionment (~$147 billion in the new infrastructure law). NHPP funds are intended to be spent on the National Highway System’s roads and bridges, as well as transit or for bicycle and pedestrian infrastructure in an NHS corridor. The easiest way to understand the NHS is that it consists of a spectrum from nearly all multi-lane arterial roads up to interstates, as well as a lot of two-lane rural state highways. Funding for the NHPP went up by 26 percent over the FAST Act, which means more money theoretically available for repair projects if states choose to spend it that way. The infrastructure law did open up NHPP to fund more climate mitigation projects classified as “protective features,” including raising roadways, replacing culverts and drainage, and “natural infrastructure.” Advocates and local leaders—especially in coastal areas—should work hard to make their state or metro area aware that these types of projects are now eligible for NHPP funding. (Relying on the past precedent of emergency aid for repairs after disasters will be risky as climate emergencies become more frequent but funding stays the same.)

2) The Surface Transportation Block Grant Program is exactly what it says: a block grant given to states for all surface transportation needs. This second biggest pot of money states can use on repair is also the most flexible. Not only can these funds be used on repair projects, but they can also go toward transit, biking, walking, and nearly other possible mode of surface travel—though many states do not take advantage of that flexibility. This program represents 23 percent of all highway formula dollars, and was increased by 35 percent from the FAST Act, up to $79 billion in the new infrastructure law.

There is also a separate new program for repairing bridges that’s already been in the news after FHWA released the first batch of funding to states.

The $43 billion bridge formula program is “designed” to repair bridges, whether on the National Highway System or what are known as “off-system” bridges owned by counties, cities, or other localities. While states still have to come up with 20 percent of the cost for repairing the bigger NHS and other state-owned bridges, this program can cover 100 percent of the cost of repairing or rehabilitating these locally owned off-system bridges, to try and incentivize more funding toward these vital but smaller bridges—like the Fern Hollow bridge in Pittsburgh that just collapsed—which many states ignore.

Note: Thanks to the Washington Post’s Ian Duncan for noting that states can in fact use this repair program for expansion and building new bridges, according to FHWA’s guidance on the program:

The construction of a new highway bridge on a new alignment is an eligible project under the BFP, but FHWA encourages States to first focus their BFP funding on projects that improve the condition of in-service highway bridges classified in poor condition and that preserve or improve the condition of in-service highway bridges classified in fair condition. Note that the FHWA considers the construction of a new highway bridge in a new location, in connection with replacement of an existing highway bridge in poor condition, to be improving the condition of an in-service highway bridge.

While states are free to neglect repair needs on their roads, bridges, and highways, the new infrastructure law does uphold the much stricter existing State of Good Repair programs and requirements for public transit. (Yes, we require state of repair on transit, but not on roads and bridges.) The funding for both transit and rail repair grants was also increased dramatically.

  • Transit: $3.5 billion for state of good repair grants represents a $1 billion increase over the FAST Act. These formula grants provide funding to repair or replace a wide variety of rail infrastructure (rail itself, signals, stations, navigational systems, etc.) The infrastructure law also created a new $300 million rail vehicle replacement competitive grant program that can be used to replace any rolling rail stock. Larger, legacy rail systems with especially old infrastructure will fare better in the grant process for this new program.
  • Passenger rail: $53.5 billion for state of good repair grants (up from $6 billion in the FAST Act) within two different programs to improve the state of good repair, improve performance, or expand or establish new intercity passenger rail service, including privately operated intercity passenger rail service if an eligible applicant is involved. Notably, these repair funds (from the Federal-State Partnership for Intercity Passenger Rail, formerly the Federal-State Partnership for State of Good Repair) are closely tied up with the money being used to expand interstate rail service, so regions will need to coordinate their grant applications between connectivity/expansion and their repair needs in order to best utilize these funds. Funds from the Consolidated Rail Infrastructure and Safety Improvement (CRISI) program are more broadly directed toward repair and safety improvement projects.

How could the administration improve these repair provisions?

Unfortunately, the deal the administration struck with Congress limits the extent of their own authority. States control the bulk of the money, with no fix-it-first requirements. Yes, USDOT has urged states to prioritize repair (and climate, equity, etc.) with their huge formula programs. Some governors and AASHTO already responded to that modest request with shock at the suggestion, even though they know they retain the freedom to continue ignoring those needs.

But there are still things the administration can do. They can choose to prioritize repair and modernization (and climate resilience) within their large range of competitive or discretionary grant programs, and prioritize repairing transit/rail infrastructure in communities that need it most or have been historically underserved to serve their equity goals. USDOT could issue guidance or scoping requirements to include identifying climate threats (extreme weather, extreme temperatures) and the frequency the asset will need repair/maintenance based on the design. And they could require this for any project that undergoes a NEPA environmental review.

How can this advance our goals? How can advocates improve outcomes on repair?

When it comes to advocates and local leaders, the greatest potential is with increasing awareness, reporting, and accountability. For example, even though climate-related projects are now eligible for NHPP funds, governors, legislators or the DOT leadership may not realize it or may have zero interest in pursuing those projects. Further, there are very few states that have a pipeline of resilience projects ready to tee up. Advocates should fill that information gap to make the most of the new climate mitigation eligibility within this huge pot of cash, and focus on the projects that would protect and serve the most climate-vulnerable neighborhoods and people.

When it comes to passenger rail, as states (hopefully) create new interstate passenger rail compacts, some of the repair money for rail will be essential for getting them and subsequent new service off the ground. This would mean coordination across multiple regions and states to make those big projects a reality, as with the ongoing Gulf Coast rail project.

And lastly, you should be reaching out to every reporter on a transportation beat in your state to remind them of the promises that transportation agencies are making on repair.

When we go in-depth with a reporter who is new (or sometimes even a vet!) on the federal transportation beat, they are often shocked to learn there are no requirements for states to repair things first. Help bring your media along and give them actionable information to hold your decision makers accountable. They have just been given a nearly unprecedented windfall of federal cash for the next five years and have the complete freedom to spend it all on repair projects. If your state makes slow or no progress on repair (or does better in some parts of the state than others) that is due to spending priorities set by the governor, legislature and/or DOT. 

Advocates and the media should be holding anyone who fails to move the needle in the right direction publicly accountable.

So what?

As one of our three core priorities, repair was one of our biggest disappointments in the infrastructure law. The last decade has shown us repeatedly that too often states use their flexibility to build new things they can’t afford to maintain while neglecting to properly address their repair needs. This is one of the most fiscally irresponsible things we do with transportation policy. Every dollar spent on a roadway expansion project is both a dollar that was not spent on repair, and a dollar that created decades of future repair costs. When Sen. Manchin talks about being concerned about costs passed to our grandkids, our current approach to repair should be exhibit A. 

The administration should use every tool in their arsenal to ensure that the funds they control prioritize repair, while using their regulatory toolbox to nudge states and metros toward the same goal. Advocates can have some of the greatest impact by working to both publicize repair needs (including climate related projects) and hold their decision makers accountable for making progress. 

With a massive increase in guaranteed federal funding coming their way, they have no excuses left.

Don’t blame the snow, blame our roads: Why it’s so difficult to travel in winter weather

Pedestrians attempt to cross the street next to a pile of snow blocking a one-way lane

Every year, winter storms highlight the failings of our car-first approach to infrastructure. And as climate change worsens, the need for change intensifies. Cities and states must do more to make sure people are able to access the goods and services they need regardless of weather conditions.

Pedestrians attempt to cross the street next to a pile of snow blocking a one-way lane
Pedestrians navigate snow removal. Photo by Joe Flood, National Weather Service, via Flickr.

During winter storms, millions have no choice but to to drive in dangerous conditions because they have no other, or no safer, option. Without a better way to get to work, purchase food, or access other necessary resources, people must drive in bad weather or in sloppy road conditions, a factor in nearly half a million crashes and more than 2,000 deaths on our roadways every winter. Millions more get stuck because sidewalks, steps, and crosswalks are the last places to get cleared of snow.

People who live in rural areas experience this problem severely, as increasing distances from work, school, and services and the lack of other transportation options requires them to drive further to access what they need. In bad weather, rural residents can find themselves driving in particularly treacherous conditions on roads often overlooked in favor of busier interstates or nearby highways or roads in need of repair. Those without cars, or without key winter weather features like four-wheel drive, can be completely cut off from the goods and services they need.

And that brings us to the additional risk, beyond crashing, that people face in winter weather conditions: getting trapped, as was the case in early January when Virginia-area commuters found themselves nearly stationary on I-95 for over 24 hours. Other high profile incidents occurred in Atlanta, Texas, Raleigh, even Buffalo (even earlier this week abroad in Greece and Turkey). In these severe examples of the danger of winter travel, the state DOTs described the difficulty of keeping up with the intense snowfall and icy conditions. As climate change worsens, DOTs will find it increasingly difficult to prepare for snow and manage snow removal, especially if roadways continue to widen and destinations continue to spread further apart.

Places with good public transit and ample sidewalks well connected to destinations are more resilient when snow starts to fall, as residents have other options to avoid risky car travel. But even then, those municipalities tend to prioritize car travel at the expense of these other forms of transport, so necessary snow removal for sidewalks, bus routes, and bike lanes is often delayed or entirely forgotten while high-speed, high-volume roadways are always taken care of first. (Or in the case of most cities, sidewalk snow removal is left entirely up to residents, something that some cities are reconsidering.)

Even when bike lanes and sidewalks get snow removal treatment in communities (i.e. using traditional plows to clear protected bike lanes and bus stop sidewalk extensions), there is an inherent risk of the infrastructure being damaged. By ignoring these other modes of transport and failing to maintain them properly, even multimodal cities can ultimately force more drivers onto dangerous roads as residents lose their access to safer options.

It goes beyond bike lanes and bus routes. Many bus stops lack shelters, forcing people waiting for their bus to stand in the storm. Shelters that do exist aren’t prioritized for snow removal, and leaving removal up to third parties can further complicate the process. In DC, for example, the bus shelter advertising concessionaire is supposed to clear the shelters, meaning the city has to contact a third party to get the snow removed. This makes removal inconsistent, so it’s more difficult for bus riders to count on their stop being well-maintained. 

Newer modes in cities, like bikeshare and micromobility systems, face their own challenges in winter weather. Bikeshare stations and other micromobility vehicles can be buried in snow from snow plows and sidewalk snow clearing efforts—not to mention that when bikeshare stations run on solar power, their solar panels have to be kept clear from snow as well. 

Snowy sidewalks are a constant dilemma, as many municipalities leave snow removal on public sidewalks up to the adjacent residences, leading to patchwork removal at best. This is a particular problem for people who use wheelchairs, walkers, or strollers, who rely on well-maintained sidewalks to get around.

The problems revealed by snowfall aren’t isolated to severe weather conditions. Year round, speedy car travel is prioritized over the safety of drivers and pedestrians. People who cannot drive have few other options for travel, and those that can drive are finding themselves driving more and more, on roadways in need of attention and repair. Climate resilience is necessary outside of winter months as well. In places facing extreme heat, providing shade could be an important way to serve the people who aren’t in personal vehicles.

To tackle these concerns, states and municipalities must prioritize, both in their investments and operations, other forms of transportation beyond car travel, so that more people can travel safely and conveniently to access goods and services in dangerous weather. They also need to address land use, as sprawl continues to pull people further away from the services they need, lengthening trips at the same time that climate change worsens travel conditions for everyone.

Transit funding in the infrastructure bill: what can it do for me?

Bus stopping in front of a crosswalk filled with pedestrians

The new infrastructure bill authorizes $109 billion to fund public transit projects through formula and competitive grant programs. Here’s what you need to know about the new money and (modest) policy changes to the transit program, as well as how you can make them work for you.

Bus stopping in front of a crosswalk filled with pedestrians
Photo by City of Minneapolis

The new infrastructure law is already pouring hundreds of billions of dollars into transportation projects and has created dozens of new USDOT grant programs that will advance hundreds of other projects. With this new law in place, T4America is empowering states and local communities to leverage this funding toward the best possible local projects. To that end, we’re embarking on a longer series of posts where we will be walking through specific topics like transit, climate, equity, rail, providing clear information about the law’s funding for that area, new grant programs, and how local officials and advocates alike can utilize the new funding to prioritize repair over expansion, improve access to jobs and services, and put safety over speed.  This first post is about transit. 

promo graphic for a guide to the IIJA

This post is part of a series of content T4America is producing to explain the new $1.2 trillion Infrastructure Investment and Jobs Act (IIJA), which now governs all federal transportation policy and funding through 2026. What do you need to know about the new infrastructure law?  We know that federal transportation policy can be intimidating and confusing. Our hub for this law will guide you through it, from the basics all the way to more complex details.

What’s in the law?

The first thing to know is that the infrastructure law failed to make any transformational changes to transit policy. (We covered this in #3 here.) Unlike the significant changes made to other areas, Congress carried forward the same old policy from the FAST Act, maintaining the status quo in which transit projects are subject to onerous oversight not required of highway projects. The second thing to know is that the law increased overall federal transit funding by 79%. This does not begin to address the full needs of transit in the U.S., but will allow numerous states and cities to make major investments in transit.

That funding is split between several programs. The largest share ($23 billion over five years) goes toward the core program for making capital improvements to expand or improve high capacity transit service. By comparison, the FAST Act spent $11.5 billion on this program, the Capital Investments Grant program (CIG). Notably, CIG money cannot be used to maintain or operate existing service. As defined by federal law, a “fixed guideway” for CIG projects is a means of public transit that operates on its own right-of-way, like a rail line, dedicated bus rapid transit line (bus lane), or even a ferry route. 

CIG grants are split into Small Starts (projects under $400 million, most often bus or bus rapid transit projects) and New Starts/Core Capacity (larger projects, where nearly all of the rail projects happen), and the two have different processes for funding approval. Under the previous infrastructure law, only projects that cost less than $300 million were eligible for Small Starts. The new infrastructure law increased that number to $400 million but left the maximum federal share of a project the same, at $150 million. This means local agencies with Small Starts projects that cost more than $300 million will need to come up with a higher percentage of local or state funds than in previous years.

While CIG funding cannot be used for repair projects, the infrastructure law increased funding for its State of Good Repair Formula Program from $13.4 billion in the FAST Act to $21.6 billion over five years. These non-competitive grants are distributed by USDOT to fixed guideway transit systems that are at least seven years old. So while transit agencies will not need to apply for funding, they will need to proactively identify repair needs to access this cash. There is also a new Rail Vehicle Competitive Grant program, funded for $1.5 billion over five years, aimed to help transit agencies leverage local/state/private financing to replace rail vehicles (think streetcars, subway rail, or light rail cars). The law also included $1.75 billion in competitive grant funding to help agencies meet Americans with Disabilities Act (ADA) accessibility standards, which can include repairs and upgrades to station elevators, boarding ramps, adequate support rails and signage, among other necessary services. USDOT has made clear that projects that engage with pertinent stakeholders and have community support will be best positioned to receive these competitive grant monies. 

In a minor but notable change, the law also strengthened reporting requirements to count all assaults on transit workers, a step in the right direction as transit operators continue to face rising rates of assault by transit riders.

How else could the administration improve the transit program?

Though Congress failed to make any real substantive changes to transit policy and instead locked the status quo in amber for another five years, Biden’s USDOT does have some leeway for interpreting and implementing this policy. For one, the Federal Transit Administration (FTA) could absolutely update their guidance for both formula and grant programs to more strongly emphasize that transit projects prioritize equitable access for all users (regardless of mobility challenges) and climate adaptation and resilience. Those who have been around for a few years will remember that FTA once rewarded transit capital projects “that tended to favor shorter travel times and longer distances between stops—rather than the number of people moved or the numbers of residents with access to reliable transit service.” This resulted in projects that moved suburban commuters quickly through a city but failed to improve transit access in order to score high in FTA’s cost-effectiveness criteria. But this is the kind of guidance that FTA and USDOT have the latitude to change.

Furthermore, FTA project guidance can place higher value on projects that have supportive land uses and facilitate first- and last-mile connections to transit, inclusive of shared micromobility.

How can the new money advance our goals?

Overall, assessing the transit needs of your community will be the best way to find and utilize the right funding sources. Advocates should work with transit agencies to pursue and develop the plans and projects that would best serve marginalized communities and improve the state of repair, and then work with the agencies to finalize plans to submit for capital funding. Here’s how this funding could be used to advance transit-related equity and climate goals.

Equity: As mentioned above, expanding and improving transit is the best way to serve and improve access in marginalized, underserved communities. But if these investments are directed to the wrong projects, they can instead reinforce racist land-use decisions (like those of “urban renewal”). Transit investments need to shift away from “development potential” and instead be meticulously planned around serving the people already living in the communities in question. Follow the people! Planners, transit agencies, and all stakeholders should direct their projects toward improving accessibility, connecting people not only along commute corridors, but to food, parks, shopping, health services, and other services. As we have seen during the COVID-19 pandemic, the people who most need transit are not served by the commuter-centric model present in most American cities.

Climate: The infrastructure law is not the climate legislation that the Biden administration billed it to be. The new transit money should be spent to give as many people as possible greater access to high quality transit, helping to keep the growth of emissions and vehicle miles traveled in check.  Doing so will be incredibly important considering the historic amount that Congress also provided for new highway spending in the infrastructure law. Cities can focus on electrification of projects using known technologies we can implement today (wires, limited range batteries), rather than holding out for expensive or nonexistent technologies to become widespread. Cities also should look at ways to better quantify and qualify the impact that transit projects can have on climate change (such as highlighting induced demand on roadways without the transit project).

So what?

For local transportation officials who have an interest in expanding and improving transit service, the overall increase in transit funding means that more projects will get funded, allowing you to push through projects that have stalled out due to a lack of funding. For cities in transit-unfriendly states, those state DOTs will need to spend the additional transit formula money anyway (which is inclusive of operating and capital repair dollars), so if cities approach them with detailed transit plans and projects that have community support, the state will find these projects hard to turn down. For competitive grants, knowing the intricacies of grant eligibility and USDOT’s selection criteria will make your applications that much stronger. 

For advocates and concerned citizens, the next time your local transportation officials say they don’t have enough money for critical vehicle repairs or equitable network expansion, you can point them to specific formula and competitive grants, as well as the eligibility criteria to prove that your project can receive that funding. 

One last important note we addressed in our competitive grants blog post: Strong local matching funds (ranging from 20 to 50 percent  of project cost) are critical to winning these grants, and the process to raise these funds starts by engaging in state and local budget processes far in advance (6-9 months before the start of the fiscal year.) So advocates, this means you should engage agencies early and often on resource prioritization to realize transit projects.

Note: There are ample opportunities for the infrastructure law to support good projects and better outcomes. We also produced memos to explain the available federal programs for funding various types of projects. Read our memos about available funding opportunities for transit capital and operating projects. In conjunction with TransitCenter and the National Campaign for Transit Justice, we also produced a table of transit funding opportunities. View that table here.

If you have additional ideas for how to utilize these expanded programs, or have questions about the content listed here, please contact us. Our policy staff is eager to hear from you. 

Reducing emissions with better transit, part two: Improve transit access

Increasing funding for transit operations is a vital first step to help more people drive less, but there’s an equally important next step: connecting more people by transit to more of the destinations they currently reach by car.

Bus riders wait at the Silver Spring Transit Center in Silver Spring, MD. Photo by BeyondDC

This post was written by Rayla Bellis, Director of Thriving Communities at Smart Growth America, and Abi Grimminger, T4America Communications Associate. This is the second of a series of posts on this topic—find the full set here.

In our first installment of this series on the importance of transit to reduce emissions, we focused on increasing spending on transit operations—more buses, more trains, running more often (in the 288 urbanized areas with available data.) We found that by increasing federal support for transit operations across these areas, we can make meaningful progress in reducing driving emissions. But while that’s a crucial step in the right direction to meet our climate goals, we also need to consider how to expand access to transit and help more people use transit to get where they need to go.

Pairing expanded transit service with greater access to transit

For a second phase of our analysis of how investing in transit can help meet our climate goals, we looked at what we could achieve by improving transit access—in this case meaning how well transit connects people from their homes to available jobs in their region within a reasonable travel time. Improving transit access goes beyond simply expanding transit service. While offering more routes or more frequent service can certainly improve transit access, it won’t necessarily do so if those routes aren’t designed to connect the places where people live as directly as possible to the places they need to go

In the 288 urbanized areas studied, we examined the annual vehicle miles traveled (VMT) estimates for all 88.5 million households included in the 2017 National Household Travel Survey. We analyzed what share of their regions’ jobs (within 45 minutes from their homes) they could reach with existing transit service using data from the EPA’s Smart Location Database. Unsurprisingly the households that are unable to reach any jobs by transit within that time frame traveled quite a bit by car—averaging 23,090 miles per year.

Households that could get to work using transit drove significantly less, and the improvement came with even modest levels of access to jobs via public transportation. Households that could reach just 10 percent of jobs in their metropolitan area by transit drove 19,040 miles per year (an 18 percent drop). When that access increased modestly up to 10-20 percent of jobs, households drove 17,710 miles per year on average (a 23 percent drop), and when they could reach over 20 percent of all metro-area jobs with transit, average driving in those households dropped to 16,380 miles (or 29 percent less than households with no transit access).

Even improving transit access to connect people to up to 20 percent of metropolitan area (MSA) jobs leads to significant drops in average miles driven per year, reducing emissions. 

Based on those results, we estimate that if we could manage to give all 88.5 million households we studied access to at least 20 percent of their region’s jobs by transit by 2050, we could reduce annual vehicle miles traveled by these households by 23 percent, leading to a total reduction in VMT (including non-household trips like deliveries and ridesharing) in those urbanized areas of 16 percent in 2050 compared to projected VMT based on our current trend. This is 377 billion fewer miles driven annually. Given that transportation emissions are the main perpetrators of greenhouse gas emissions in the U.S., this would be a major step toward improving climate outcomes.

Raising the bar

Providing all households in the 288 urbanized areas we studied with access to at least 20 percent of their region’s jobs by 2050 will require more than simply increasing investment in transit or even just running more trains and buses because of the existing low-density suburban development in many of these regions, which has contributed heavily to VMT growth and emissions in these cities. It will take a real push to make transit-supportive land-use decisions and provide the right transit service to connect people to the destinations they need. But that doesn’t mean it can’t be done. In fact, some urbanized areas are already providing a significant share of their residents with access to at least 20 percent of their regions’ jobs by transit today, raising the bar for communities across the country.

In cities like Champaign, IL, Bloomington, IL, Duluth, MN-WI, and Boulder, CO, more than 70 percent of households can currently reach more than 20 percent of metropolitan-area jobs using transit. Bringing all 288 urbanized areas we studied up to a level of access comparable to those regions by 2050 (in line with the current top 2 percent of cities in the graphic below) would result in an 11.9 percent reduction in  VMT in 2050, compared to what is currently projected for that year. Though a slightly less ambitious target, bringing all 288 urbanized areas up to the level of access provided in the top 5 percent of cities would still have a sizable impact, resulting in a 9.5 percent reduction. That would significantly reduce both emissions and the amount of time Americans spend in their cars on average—a win for the environment and for commuters.

In cities with the best current transit access (those in the top 2 percent), about 70 percent of households can reach more than 20 percent of their jobs by transit.

Bringing all 288 urbanized areas to the level of access provided by the current top-performing regions could reduce annual VMT in 2050 by 11.9 percent compared to currently projected levels for that year.

If we brought all 288 urbanized areas up to a minimum level of transit access to jobs already achieved by the……we could achieve a reduction in annual VMT in 2050 of……meaning a cumulative VMT reduction over 30 years of…
Top 25% of urbanized areas-3.7%-2.0%
Top 10% of urbanized areas-6.5%-3.6%
Top 5% of urbanized areas-9.5%-5.2%
Top 2% of urbanized areas-11.9%-6.5%

Source: Estimated using data on household VMT from the 2017 National Household Travel Survey and data on transit accessibility from the EPA Smart Location Database.

It is important to note that the impacts of poor access to transit aren’t felt equally. People who most need an affordable alternative to car travel are often the same people who don’t have viable transit access. Black workers are four times more likely to take transit than white workers, yet transit access is roughly 24 percent worse in the quartile of urban areas with the most Black residents, compared with those with the fewest. Areas with high poverty rates get less frequent, reliable transit service than wealthy neighborhoods. If we want to face climate goals head-on, we also have to address these inequities in transit access.

But how?

Increasing access to jobs via transit will require an intentional policy and investment strategy, because it depends on several factors beyond just how much we spend on transit: how well transit serves different populations currently, development patterns in the region, and where jobs and services are clustered. And overall, to make the more ambitious scenarios possible, changes in local and metro-area land-use decisions need to go hand-in-hand with the increased transit investment. 

Some cities would need to spend a great deal to significantly improve transit access in the more sprawling portions of their regions if development practices don’t change, which is all the more reason to change those development practices now. Yet scores of cities could likely make meaningful improvements to transit access with very little additional spending. For instance, some cities (like Columbus, OH and Houston, TX) have been able to expand transit access simply by reconsidering the way their routes are structured and reconfiguring their service from the ground up with a focus on improving access. 

To address the pressing need to reduce emissions from transportation to meet ambitious climate goals, we’ll need to not only invest more money overall in running more buses and trains more often, but also consider how to expand that transit service into more places and serve more people—especially those who need it most. More on this in an accompanying report coming in the new year.

Lemonade from lemons: Improvements worth celebrating within flawed infrastructure bill

Pier 1 embarcadero

Money from the finalized $1.2 trillion infrastructure deal is already flowing out to states and metro areas who are plugging it right into projects both already underway and on the horizon. After covering six things the administration should do immediately to maximize this mammoth infusion of unexpected cash, here’s a longer look at some of the law’s incremental or notable successes, with the aim of equipping the administration and advocates alike to steer this money toward the best possible outcomes.

promo graphic for a guide to the IIJA

This post is part of T4America’s suite of materials explaining the 2021 $1.2 trillion Infrastructure Investment and Jobs Act (IIJA), which governs all federal transportation policy and funding through 2026. What do you need to know about the new infrastructure law? We know that federal transportation policy can be intimidating and confusing. Our hub for the new law will walk you through it, from the basics all the way to more complex details.

Passenger rail

Amtrak train pulling into a station
Image from Wikimedia Commons

If you’re looking for good news in the infrastructure bill, passenger rail probably represents the most encouraging and exciting inclusion in the bill. After being woefully neglected over the past 40 years, passenger rail is one of the biggest winners, receiving a historic investment that totals just north of $100 billion over five years. (All of which is thanks to impressive bipartisan work by the Senate Commerce Committee earlier this summer—read our much more detailed take on all the passenger rail provisions here.

This will provide significant opportunities to reshape American passenger rail in a transformative way. With the record investment, there is ample opportunity to improve safety and state of repair for existing rail infrastructure, make existing service more reliable, and support new, expanded passenger rail service. Communities near rail and lacking in intercity mobility options could connect their community with affordable intercity mobility and integrate passenger rail service with first- and last-mile community connections. 

But these improvements are not going to happen automatically nor will they happen easily. The Biden administration, the Federal Railroad Administration, Amtrak and others will have to be very aggressive in ushering this money out the door and supporting state and local plans for those improvements to see the projects that have been promised or mentioned in breathless news coverage come to pass. If the administration fails on this count, this could turn out just like the 2009 Recovery Act, where money sat idle or was even declined by governors. On top of that, freight railroads will be opposed to the improvements in some places, just like they’ve fought or negotiated in bad faith against the publicly and politically popular plan to restore passenger rail along the Gulf Coast.

Additionally, Amtrak’s mission and governing structure have been adjusted to bring a greater focus on expanding and improving the national network. For the majority of Amtrak’s existence, the mission of passenger rail service was to justify investments with performance and operate to make a profit, no matter the cost to user experience, and no matter that nearly every other transportation mode fails to turn a profit. This hampered innovation and opportunity to build and retain rail ridership. Small but significant changes in the infrastructure bill reorient Amtrak’s mission towards the value of the customer and the importance of connecting those customers across urban and rural communities. 

While the bill lays out goals for an Amtrak Board of Directors that better represents a diversity of perspectives and communities across the Amtrak system, as we noted last week, those slots need to be filled immediately if the administration is serious about improving passenger rail service and taking advantage of the funding and this historic opportunity.

By reinvigorating passenger rail infrastructure and user experience, this bill could lay the groundwork for other future advancements, including high-speed rail.

Connecting people to jobs and destinations

Alaskan Way Viaduct demolition in progress in Washington
Image from WSDOT via Flickr

As we’ve noted, the bill pours the lion’s share of the funds into the same old highway programs with few substantial changes. And states are already responding to their hard-won flexibility and historic amounts of cash by supercharging previously planned or ill-conceived projects. But there are some notable ways the bill recalibrates the highway program for the long run. 

First, a portion of every state’s funding will go to new programs aimed at reducing carbon emissions, improving transportation system resiliency, and congestion relief, in addition to existing money devoted to Congestion Mitigation and Air Quality (CMAQ) dollars. States and metro areas must also now dedicate a portion of their planning money towards Complete Streets planning and implementation. (2.5 percent of each state’s State Planning Research dollars and 2.5 percent of their metropolitan planning dollars.) This money will be dwarfed by the hundreds of billions going into streets and roads being designed the same old way, but this is an incremental step toward elevating active transportation and livable streets within the transportation program. 

Within the largest pot of funding that states and metro areas control (the Surface Transportation Block Grant program), the amount set aside for smaller but vital transportation projects like bikeways, new sidewalks, safe routes to school, and micromobility was increased from 1.5 percent up to 10 percent. This bill also lets local municipalities control more of this funding directly by increasing the share of that 10 percent that they directly control from 50 up to 59 percent

Lastly, while the $1 billion Reconnecting Communities program will be overpowered by hundreds of billions in highway funds perpetuating the very problem this program aims to solve, its inclusion is an important step toward repairing the damage of past highway projects and is worth celebrating. For the first time, Congress is acknowledging the racist and damaging history of highway building, laying the groundwork for future efforts and also providing a way for advocates to spotlight how some of the worst excesses of the past are still going on today in many urban areas. But devoting any federal dollars to tearing down divisive infrastructure plus the means to stitch communities together again is a vital step on the path toward reorienting the highway program to serving people and communities with the transportation system. 

Transit

A Philadelphia bus drives through a snowy intersection
Image from BruceEmmerling via Pixabay

Most of the headlines and coverage about transit focused on the fact that it will receive historic levels of investment over the next five years from the infrastructure deal. That’s certainly good news, but that also glosses over some important shortcomings. 

First off, unlike the Senate Commerce Committee did with passenger rail, the Senate Banking Committee never actually drafted a transit title to incorporate into the infrastructure bill. This preserved the transit policy status quo in amber for the next five years. Secondly, while the House’s superior INVEST Act proposal focused on trying to maximize transit service, frequency, and access, this bill failed to fix the current priority of keeping costs down no matter the effects on people when it comes to service, ridership, and access to transit. T4America is still looking to Congress to redress that wrong within the still-in-progress budget reconciliation bill (the Build Back Better Act), ensuring that public transportation, a fundamental backbone in our communities and a lifeline towards affordable housing opportunities, is properly funded.

Thirdly, while the $39 billion is a historic amount for transit and many excellent projects will be built because of it, this amount should have been higher. $10 billion was cut from the original infrastructure deal’s framework agreement with the White House back in June. 

While we weren’t anticipating the Senate increasing the share for transit, the infrastructure bill did maintain the historic practice of devoting at least 20 percent towards public transportation and did not decrease it. On a positive note, the bill emphasized improving the nation’s transit state of good repair, plus improving transit accessibility via a grant program to retrofit transit stations for mobility and accessibility.

Environmental stewardship and climate adaptation

A parking space painted green with a symbol indicating the space is dedicated for EVs
Image from Noya Fields via Flickr

Although the infrastructure bill continues to heavily fund conventional highway and road expansions, digging us into an ever deeper hole of traffic congestion and greenhouse gas emissions, it is also the federal government’s biggest investment yet in climate adaptation and protection and recognizes the severity of the impacts of climate change which are already being experienced across America.

The new PROTECT program dedicates $7.3 billion (~2.9 percent of each state’s share of all highway funds) and $1.4 billion in competitive grants to shore up and improve the resilience of the transportation network, including highways, public transportation, rail, ports, and natural barrier infrastructure. Knowing where climate- and weather-related events are likely to be worse is a vital first step, and the National Oceanographic and Atmospheric Administration (NOAA) will invest $492 million in flood mapping and water modeling which could inform future infrastructure planning and investment.

The existing Alternative Fuels program is expanded and recalibrated to focus more, though not exclusively, on zero-emission vehicles and related infrastructure. A new Carbon Reduction program will dedicate ~2.5 percent of each state’s share of highway funds (~$6.4 billion total) to support active transportation, public transit, congestion pricing, and other strategies to reduce carbon emissions. (Although the core highway program will continue making emissions worse.)

All of this represents a positive first step in federal recognition of the severity of the impacts of climate change, but it is still not scaled to the level of risk that we face, though we applaud Congress for taking a bipartisan step on climate change and we hope to see more.

Safety

Cyclists on the Black Lives Matter Plaza in DC
Photo by Ted Eyton via Creative Commons

When it comes to safety, a new federal safety program, even a large one, is not what we need. The entire $300+ billion transportation program should be a safety program, with safety for all users as the highest and ultimate consideration in every single case on every single project. A transportation system that cannot safely move people from A to B should be viewed as a failure, regardless of whatever other benefits it brings.

With that backdrop in mind, there are key safety provisions that ensure a fairer shake for vulnerable road users. If injuries to and deaths of people walking, biking or using assistive devices exceed 15 percent of a state’s total traffic injuries and fatalities, then that state must dedicate at least 15 percent of their Highway Safety Improvement Program dollars towards proven strategies to make those people safer and lower that share. This helps put some teeth into highway safety dollars to target investments where they are critically needed, versus typical lip-service and disingenuous investments sold as safety projects that are really about increasing capacity, speed, or other goals.

The new Safe Streets and Roads for All program is a competitive grant program allowing applicants to seek funding to better plan and implement Vision Zero strategies in their communities and regions. Once deemed a niche concept, the Vision Zero safety framework has gained some prominence. For it to go mainstream, it will need to be fundamental to all highway spending.

Looking ahead

Though this bill leaves much to be desired, there are still some notable changes that will start to shape the direction of state, regional, and local transportation programs. The key will be how they are used. In the coming weeks, T4America will highlight key opportunities to better administer, deliver, and shape the US transportation program for generations to come. 

The infrastructure bill is finished—what you need to know

Infrastructure will be built, but what kind?

The $1.2 trillion infrastructure bill is notable both for including Congress’ most significant effort to address climate change, and its general failure to make fundamental changes to a transportation program that’s responsible for massive increases in transportation emissions, worsening state of repair, unequal access to jobs, and increasing numbers of people killed on our roadways.

promo graphic for a guide to the IIJA

This post is part of T4America’s suite of materials explaining the 2021 $1.2 trillion Infrastructure Investment and Jobs Act (IIJA), which governs all federal transportation policy and funding through 2026. What do you need to know about the new infrastructure law? We know that federal transportation policy can be intimidating and confusing. Our hub for the new law will walk you through it, from the basics all the way to more complex details.

First, you can read our short statement about the deal’s passage (signed by President Biden on Monday, November 15!) In a sea of media coverage and complicated explainers, we wanted to drill into just a few basic things you should know and remember about this new bill:

1) Transportation policy and funding is now wrapped up until 2026

Did you catch this one?

The way this deal was repeatedly referred to in the media as a standalone infrastructure bill created a lot of confusion, so it’s worth being clear on this count: Congress just wrapped up the every-five-years process of transportation reauthorization because the Senate’s five-year transportation policy proposals passed earlier this summer were the foundation of this larger infrastructure deal. There’s a lot of additional money that will go into various forms of infrastructure, but of the $645 billion total for transportation, about $300 billion is for a new five-year reauthorization to replace the expiring FAST Act. The additional ~$345 billion consists of annual appropriations of various kinds which are not guaranteed or sourced from gas taxes via the highway trust fund (see #4 below for more on that.)

So other than the annual appropriations process where Congress decides funding levels for some discretionary programs like the transit capital construction program or BUILD grants, funding and policy decisions are now finished for five years, and the focus now moves to implementation, i.e., how this money gets spent and where. 

2) So what was in the five-year reauthorization included in the deal?

We took a long look at the good, the bad, and the ugly when the deal passed the full Senate back in August, and almost nothing has changed since:

[It] includes a lot of new spending, but that spending isn’t directed toward outcomes, much less the priorities that the President articulated in The American Jobs Plan. Though this bill mentions safety, climate, and equity often, as it stands, it will fail to produce meaningful shifts. “The White House will soon discover that they’ve dealt themselves a challenging hand in their long-term effort to address climate change and persistent inequities, while kicking the can down a crumbling road that’s likely to stay that way,” T4America director Beth Osborne said in our full statement after Tuesday’s final vote.

There is some good news, though. When it comes to the next five years of policy and spending, passenger rail was the biggest winner, making the expansion of reliable, frequent rail service to more Americans a cornerstone of the deal’s approach. The rail portion ​​will “1) expand, increase, and improve service, 2) focus on the entire national network (rather than just the northeast corridor), 3) encourage more local, ground-up coalitions of local-state partnerships for improving or adding new service, and 4) make it easier to finance projects and expand that authority to transit-oriented development projects.” We explained these provisions in-depth in this post.

3) More money for transit but with policy crafted in 2015 (and before!)

The transit portion of reauthorization was never produced by the Senate Banking Committee, which means that this deal basically carried forward the status quo approach to transit policy from the now-replaced FAST Act, but with a historic amount of transit funding (along with a historic amount of highway funding.) The House’s discarded five-year INVEST Act proposal contained some vital improvements to transit policy, but it was ignored by the Senate when assembling the larger infrastructure deal.

We’ll have much more about the modest changes to the transit program in a later post—including what’s next.

4) What else was included in the non-reauthorization portions of the bill’s $1.2 trillion price tag?

This great chart from the National Association of Counties shows where the additional transportation money— outside of the ~$300 billion, five-year authorization—is going:

For more on the non-transportation inclusions in the bill, you can read this post from Smart Growth America with a broader look at the package and what was included on climate resilience, broadband, and other areas. 

5) Time to hold the administration and Congress accountable for accomplishing their ambitious promises

The Biden administration has made significant promises to taxpayers about what they are going to accomplish with this historic investment when it comes to repair, climate change, safety, equity, and an equitable economic recovery from the past year and a half. They’ve assembled a tremendous team of superstar smart people at USDOT to make it happen. They’ve shown their willingness to use their administrative authority to at least temporarily halt damaging highway projects. They’ve created a litany of helpful new competitive grant programs they now need to write the rules for awarding. 

But watching the president sign the bill isn’t just a celebration, it’s a cue for them to get to work with some major urgency: the first year of this money is flowing out the door already, so states are already pouring this money into projects already underway. 

It will require a herculean effort from them to make sure this bill accomplishes what they believe it will. As we said when the deal was first approved by Congress on November 5, “The administration is confident they can make substantial progress on all of these goals despite those deficiencies. Most states are promising to use the flexibility they fought for to make marked improvements across these priorities. To make that happen, both the administration and the states will need to make major changes to how they approach transportation, but we know they can do it.” 

Because they missed the chance to codify a wholly different approach to transportation into law, they only have the option of making changes that are administrative or imposed by the executive branch—changes which can all be undone by a future administration.

Now is the time for us, the media, advocates and local leaders of all stripes to hold them accountable for what they have promised to accomplish with this historically massive infrastructure bill. 

After COVID, who’s driving the bus?

A child waits at his bus stop

As schools have returned to in-person learning and employment centers come back to life, mobility is grinding to a halt with a slow return of bus operators, the result of market pressures and ill-timed disinvestments.

A child waits at his bus stop
Image by Glenn Beltz via Flickr

A common sight across communities in America is the classic yellow school bus ferrying children to and from school and the public transit bus, circulating people of all walks of life to jobs and services in their communities. 

We see buses everywhere because of the thousands of bus operators who undergo rigorous training and certification to operate these oversized passenger vehicles safely and efficiently. The operator training is supported via a network of training operators, who keep abreast of the latest safety and operational standards from the federal government and vehicle manufacturers.

Communities are facing a lack of operators and bus trainers, due to a cascading slew of factors exacerbated by the COVID-19 pandemic. 

bus driver wearing mask adjusts mirror
Image from Flickr/MTA NYC

Transit drivers under pressure

From the perspective of the transit bus operator, driving a bus lent itself to job security, community respect, and in many areas, union representation. Most importantly, driving transit was an inclusive industry for those historically marginalized from the labor market. 

However, the glamor of the job has eroded significantly over time, with stagnant wages, more arduous hours, contentious riders, more complicated roadways to navigate, and more complicated vehicles to operate. The industry was already struggling to both train and retain skilled operators. 

COVID-19 presented further challenges to an already strained transit workforce. With the onset of the pandemic, transit bus operators were on the frontlines, providing mobility to fellow frontline workers and subjecting themselves to regular COVID exposure risk (and some losing their lives to COVID, such as 136 NYC MTA operators in the early days of the pandemic). For some operators, that was too much risk to bear.

To add to these challenges, transit systems facing dire budgets with falling riderships made draconian cuts to service (eliminated routes, lowered frequencies, reduced reliability) and then struggled to pivot the operators, bus trainers, and mechanics that remained into other roles. As a result, transit operations scaled down quickly, without a plan to scale back up. This cut off transit-reliant people (seniors, youth, persons with disabilities, persons with limited financial resources) from jobs and services. But when the fiscal picture for transit agencies started to look better, scaling operations back up took more time than scaling down.

Hampton Roads Transit (HRT), operating in southeastern Virginia and serving over 22 million annual passengers, is no exception. A spokesperson told T4A that “HRT is currently operating a reduced service plan in order to maintain a level of reliable service. The pandemic has had a significant impact on HRT staffing, beginning with a dramatic decrease in attendance that when added to the shortage of operators resulted in HRT at one point being down 30% of bus operators needed to meet service.” 

Empty driver's seat
Image from Wikimedia Commons

Unpredictable workloads for school bus drivers

Faced with similar challenges to those of transit bus operators, if not worse, school bus operators are opting out of shuttling children to school. With split schedules (AM and PM stints), school bus drivers are unable to work enough hours to qualify for benefits, despite working more than half of their day. With COVID-19 requiring virtual learning, many districts were unable to pivot operators to other roles in the interim, forcing these drivers to be furloughed for more than a year. 

Now as schools reopen to in-person learning, many bus operators have decided not to return, choosing to pursue steadier opportunities. Others are less able to work because of falling ill or succumbing to COVID-19. This has placed school districts across the country in a pinch.

The story linked above notes that some school districts are asking—even paying—parents to drive their children to school, contributing to daily congestion and eroding air quality. Other districts have had to delay starting school to give themselves time to find, train, and license new drivers . Yet others have required the state to intervene and call in the National Guard to drive children to school. To add salt to the wound, in many cities, children are shuttled to school by transit buses, which as noted earlier, are already stretched thin.

What we need

This developing crisis will require considerable intervention by municipalities to stem the tide. It will involve revisiting bus operator working conditions, and strengthened policies and procedures to protect the bus driver from health hazards as well as unruly passengers. 

Most importantly, municipalities will have to invest considerably to ensure that compensation for a bus operator is competitive and marketable alongside investment in training resources and the staffing involved to support not only bus operator training, but also the maintenance of bus fleets. Hampton Roads Transit’s re-staffing issues reflect many of these national trends. According to their internal figures, “the number of applications received dropped by 48%.  To attract new operators HRT is currently offering $4,000 sign-on bonuses, Commercial Driver’s License training, and referral bonuses.  HRT recently negotiated a new collective bargaining agreement, increasing the starting pay by 20% in order to be competitive locally.” But these increased incentives require increased funding.

Tom Klevan, the manager of multimodal planning for the Southwestern Pennsylvania Commission, phrased the need for action well in an email to T4America:

“The bus operator shortage currently facing public transit providers across the country illustrates the growing and continuing need for both federal and state investment in multiple mobility options, as well as our nation’s road infrastructure. Further, we need to increase public understanding of the role that transit plays in the overall well-being of communities. The global COVID-19 pandemic has served to shine a bright light on the value of life-essential tasks—including operating and maintaining transit vehicles—as well as the fragile nature of our global and local economies if we collectively don’t take steps to focus resources both public and private on creating the conditions that promote equity.”

Lastly, municipalities and transit agencies will need to revisit protocol in addressing future resource strains. Those protocols need to prioritize not cutting transit service, training, and maintenance support, because as we’ve seen, those short-term solutions lead to steeper costs in the long run.

Want to save the climate? Start by funding transit operations

The current trend of more driving will make it harder for us to reach our emissions goals. Making public transit a more convenient and reliable option so people can access the things they need while taking shorter or fewer car trips is one way to reverse the trend of more driving.

MARTA buses in Atlanta. Flickr photo by James Williamor.

This post was written by Rayla Bellis, Director of Thriving Communities at Smart Growth America, and Abi Grimminger, T4America Communications Associate. It’s the first of a series of posts on this topic—find the full set here.

Transportation accounts for the largest share of emissions in the US, and cars and trucks are responsible for nearly all of it. To fully decarbonize transportation by 2050, we need to transition to electric vehicles (EVs). But that transition is still decades away, and in the meantime the cumulative impacts of more driving and more emissions will make it harder for us to avoid the worst impacts of climate change. We cannot afford to wait until the 2040s to start bending the curve on transportation emissions: we need to take real action now. And we won’t get there if we continue to do what we’ve been doing: driving more and more (measured as vehicle miles traveled or VMT).

We need to give people better options for getting around without needing a car. That means public transit, and a lot more of it. Public transit isn’t a reliable option for most Americans. While about 80 percent of people in the US live within areas classified as “urban” (which includes the suburbs of urban centers), less than 10 percent of Americans live within walking distance of reliable, high quality transit that comes every 15 minutes. And 45 percent of Americans have no access to transit at all. 

Image from TransitCenter’s excellent video, The Case for Federal Transit Operations Support

Yet the federal government gives transit just 20 percent of surface transportation funding, and the rest goes to highways (which often funds highway expansions that make public transit even harder to use). Transit agencies can use this funding to repair and maintain their systems and to build out new services—but they can’t use it to help cover the cost of operating their systems, which accounts for two-thirds of a transit agency’s total expenses. This has put an enormous strain on agencies’ budgets, particularly as they continue to suffer from reduced fare revenue as a result of the COVID-19 pandemic. 

We can afford to do better

In partnership with Third Way, Transportation for America recently analyzed 288 of the largest urbanized areas in the U.S. to help us understand just how much we would need to increase transit operating funding in those regions to enable residents to drive less. 60 percent of all driving happens in these 288 urbanized areas. While the scale of CO2 reduction we need isn’t something transit—or EVs, or any other single strategy—can fulfill alone, it turns out we can make real headway with an achievable increase in transit spending. 

While more than two-thirds of the urbanized areas analyzed currently spend less than $100 per person on transit operations, there’s a correlation between more transit operations funding and lower amounts of driving in these metro areas. Our analysis found less driving per capita in the areas that spend more on transit operations per person (keep an eye out for a full report soon with more detail on our methodology and analysis results). That means that if we increase operating spending per person across those urbanized areas and continue to scale that spending up over time, we can expect to see meaningful reductions in driving. 

We estimate that if we doubled transit spending in all of those urbanized areas by 2050, VMT in those regions will be 6.1 percent below its current growth trajectory. If we triple our investment in transit operations, VMT would be 10.7 percent lower. That’s less time spent commuting, less time in traffic, and less emissions warming our planet.

In fact, doubling or tripling transit spending would be roughly equivalent to taking every single gas-powered car off the road for about an entire day every two months for the next 30 years. If we fail to reach our goals of 100% electric vehicles by 2050, it would be closer to a day every single month with no emissions whatsoever from gas-powered vehicles.

VMT reduction impacts of increased transit spending

The 288 urbanized areas we analyzed spent $48 billion on transit operations in 2019.

By 2050, if we ↧ ↧By 2050, we would increase annual transit spending to...And see VMT reduction across those urbanized areas in 2050 of...
...double transit operating spending in each urbanized area$94 billion-6.1%
(143 billion fewer miles per year than projected)
...triple transit operating spending in each urbanized area$120 billion-10.7%
(250 billion fewer miles per year than projected)

Estimated using 2019 transit operating spending from the National Transit Database and 2019 per capita VMT from the Federal Highway Administration. Scenarios doubling or tripling transit spending were capped at a maximum of $800 per person in each urbanized area.

While we won’t be able to double or triple transit operating spending overnight, these are investments we can—and need to—start making now. Unfortunately, the federal government is continuing to turn a blind eye to the need for better transit funding if we ever want to reach our climate goals. Though the Infrastructure Investment and Jobs Act increased federal spending on transit, this legislation provides an historic amount of money for highways and prioritizes car travel. That will encourage driving-oriented road projects and development decisions that make our investments in transit less effective and the service we do have more difficult to access. A transit stop that’s dangerous or difficult to reach is a transit stop that will be underutilized, only being used by those people willing to endure the difficulty or risk. A broad coalition of stakeholders is urging $10 billion more for transit in the budget reconciliation package, which can be used to cover operating costs. Though transit will ultimately need much more than this to enable us to meet our climate goals, $10 billion is an important step in the right direction. 

There’s more to this story

It’s not just about pumping more money into transit—how we provide transit service matters. In order to reduce the amount we drive, we’ll need to ensure that transit effectively connects people to the places they need to go. We’ll be doing a series of blog posts analyzing what it would take to build a national transit system that helps get us to our climate goals.