The Coalition for Smarter Growth’s Smart Growth Social is coming up on October 24, 2023! This year, we’re partnering with them to bring you a night of networking, community, and celebration of smart growth.
The Coalition for Smarter Growth’s Smart Growth Social is back and better than ever! And, we have exciting news… Our special guest speaker this year will be David Zipper, leading thinker and commentator on transportation, technology, and cities. David is a Visiting Fellow at Harvard’s Kennedy School and a contributing writer at Bloomberg CityLab, who’s also been published in Vox, Slate, The Atlantic, and The Washington Post.
David will be talking about how we can save transit, offering thought-provoking ideas as we all work together for Metro funding and the walkable, transit-oriented communities that are key to a sustainable future.
Smart Growth Social has always brought together our region’s most passionate urbanists, community activists, and professionals from across public service, urban planning, and transportation sectors in the DC region. We’ve been lucky to hear from amazing leaders and advocates like Jeff Speck, Katie Cristol, Beth Osborne, Jeff Tumlin, Gabe Klein, and Dan Reed.
We’ll have beer, wine, food, and lots of time for networking. There’s so much to enjoy at Smart Growth Social! So, don’t miss this opportunity to connect with friends and be inspired to action by one of the most influential people in transportation policy.
Current state gasoline taxes aren’t enough to cover our transportation funding needs. Evaluating alternatives needs to involve taking five key principles into account. Read our policy evaluation framework, created by T4A Policy Associate Stephen Coleman Kenny with support from T4A Policy Director Benito Pérez, NRDC Senior Transportation Advocate Zak Accuardi, and T4A Policy Intern Julia Camacho.
Our transportation systems are largely funded by motor fuel taxes that finance the federal Highway Trust Fund. Since the 1980s, these funds have been allocated using a roughly 80/20 split between highway and transit spending under the assumption that drivers were paying a larger share and deserved to receive more investments in return. However, after a crisis in 2008 when the national fund ran out of money—requiring billions of dollars in bailouts ever since—this system has proven to be outdated and unstable.
Why the gas tax status quo needs to change
In 2008, the National Surface Transportation Infrastructure Financing Commission wrote that the United States has an “ever-expanding backlog of investment needs” that then-current transportation funding policies would only cover one third of. As of 2016, public transit systems have faced a backlog of over $105 billion for maintenance and replacement costs.
Today, this problem is only worsening. America’s reliance on gasoline taxes in order to fund roads and transit systems is proving to be unsustainable. As vehicles become increasingly efficient and electric vehicles (EVs) become more commonplace, overall levels of fuel consumption are decreasing—thus lowering gas tax revenues and further widening the infrastructure funding gap. Without a change in our revenue-raising systems, our roads and transit infrastructure will crumble. It’s critical we act now.
As policymakers explore potential alternatives to the gas tax, a variety of options have emerged, including the following:
Road pricing, or taxing by vehicle miles traveled (VMT)
Adding new tolls
Congestion pricing
Flat vehicle registration fees
Indexing the gas tax to inflation
Taxes on external costs of driving like emissions and accidents
General revenue subsidies
Duties on fuel sales
Many of these proposals are not new—for instance, T4A wrote about raising the gas tax or indexing it to construction fees back in 2014. But save for some VMT-based road pricing pilot programs in Oregon, Virginia, and most recently Utah, little progress has been made.
Choosing the right option
There are a variety of possibilities, but no one option fits every regional context. Rather, the process of evaluation has to be sensitive to the goals and priorities of state and federal transportation programs. With that in mind, there are five main needs that new proposals will need to address, which we compiled into a policy evaluation framework:
Outcomes: How the funding scheme changes road user behavior by incentivizing one of the following outcomes: electrification (EV adoption), mode shift away from personal vehicles, or maintaining the status quo.
Fairness: Ensuring that the funding scheme is fair to all users by having road users (including drivers of internal combustion engine (ICE) cars and EVs alike) pay user fees in accordance with the wear and tear they impose on the road system.
Stability: Estimating the revenue projections of the proposed system and whether or not it raises enough money to maintain the transportation system in both the short and long term.
Equity: Examining how the structure of the funding scheme impacts different socioeconomic groups, and how the benefits and burdens are distributed.
Feasibility: Considering the administrative costs, jurisdictional issues, technology for implementation, political popularity, and public support for the proposal.
Taking a closer look at a VMT tax and its implementation in Oregon
Among the options mentioned above, road pricing, or a tax on VMT, has emerged as a popular frontrunner among policymakers and thought leaders. A VMT tax would impact ICE cars and EVs equally, would include usage of all roads—not just interstates or toll roads—and would result in a precise user charge, especially if adjusted for vehicle weight, that drivers pay based on their wear and tear on the road system. However, the shortcomings of a VMT tax lie in the other four aspects—equity, outcomes, feasibility, and revenue stability.
A VMT tax would be regressive, penalizing people who need to drive the furthest—in other words, rural households and those who live farther from city centers—and already have to pay high transportation costs as a result. Additionally, a VMT tax only incentivizes mode shift for that same group of people, who are the most likely to not be able to shift away from driving due to a lack of transportation alternatives.
Furthermore, a simple VMT tax doesn’t incentivize EV adoption over ICE cars or even just more efficient vehicles over heavier ones that use more fuel, since all vehicles are treated the same. With regards to feasibility, VMT taxes have faced technology challenges, high administrative costs, and public opposition. And in terms of revenue stability, a VMT tax is sufficient only if we maintain high levels of driving in the long term.
Oregon, a state that has historically been especially reliant on the gas tax for transportation funding, has tested out a VMT tax. In 2001, Oregon created a Road User Fee Task Force (RUFTF) in order to evaluate possible alternatives as hybrid vehicles and EVs began to rise in popularity. RUFTF decided to try implementing a road usage charge and launched a VMT pilot program in 2012 that succeeded in four areas: policy and public acceptance, technology, operations, and cost. This led to the creation of the voluntary OReGO program in 2015 that now enables drivers of EVs and efficient vehicles to pay a per-mile charge in exchange for reduced vehicle registration fees or gas tax rebates.
It’s notable that one of the aspects that wasn’t considered was outcomes—how the funding scheme changes (or doesn’t change) the behavior of road users, incentivizing electrification or mode shift or neither. Oregon’s eventual vision is to have a dual tax system—VMT for EVs and efficient vehicles, and a gas tax for all other vehicles.
When asked whether a VMT tax for fuel-efficient vehicles punishes drivers trying to do the right thing environmentally, Jim Whitty, who led the implementation of these programs at Oregon’s DOT, said that “making the great choice to buy a less polluting vehicle doesn’t make it a great choice to let the road system crumble.” And when asked why people who will pay more under a VMT system would volunteer to participate in the program, Whitty didn’t have a clear answer.
Notably, as of 2020, only 701 drivers were actively participating—well under the 5,000 that the program had initially envisioned. Oregon is now considering making OReGO into a mandatory policy, but other states should still try out other options before rushing to commit to a VMT tax.
Reevaluating America’s transportation funding systems
It’s of course critical that we act now to resolve this growing funding gap in order to address pressing maintenance needs and invest in the future of America’s transportation systems. When choosing an alternative policy (or combination of policies) to replace the current gas tax, it will be important to consider these five aspects—outcomes, fairness, stability, equity, and feasibility.
However, federal and state leadership will be as critical as funding. Both levels of government have a crucial role in transportation funding. Much innovation is fostered in localities, but without an overarching vision and approach, this can result in a patchwork of approaches that can spur inequitable outcomes.
It’s also important that we consider the ultimate impacts of this transportation funding system: namely, how the money is actually used. In a foundational 2006 report on possible alternatives to the fuel tax, for example, the Transportation Research Board acknowledged that their analysis prioritized problems related to highway financing over public transit.
We can’t afford to pour money into expanding highways and worsening America’s transportation woes. Even if we achieve an optimal policy that maximizes revenue raised for transportation funding, we need to ensure that the money raised by any of these proposals is actually used for projects that prioritize maintenance and repair and make advancements towards reliable, affordable, and frequent transit systems that connect people to the places they need to go.
Electric vehicle (EV) carshare is an effective strategy in speeding the transition to zero emissions transportation, providing more affordable transportation options and syncing up with other smart growth solutions. This strategy is worthy of public investment.
Carshare is a model of car rental where people rent cars for short periods of time, such as by the hour or minute. Sometimes the car has a home base that the user brings it back to, and some carshare systems are “free-floating” so that the user can drive a car on a one-way trip, usually within a limited area such as a city, and leave it at the destination for the next user. Electric carshare simply means providing this kind of service with electric cars instead of gas-powered cars.
Why is EV carshare such a powerful strategy, and how does it help on both fronts of the battle to reduce emissions?
Supporting the transition to zero emissions
First, EV carshare moves more travel from gas-powered cars to EVs. Better than one person buying one EV, multiple people get to share the use of one EV car. Since most privately owned vehicles sit idle 95 percent of the time, a carshare vehicle delivers more bang for the buck if it is well-utilized.
In addition, giving more than one household access to each EV means more people getting real-world experience using these kinds of cars. People who are more familiar with EVs are more likely to buy one if and when they make a new car purchase.
One more benefit EV carshare can deliver to the EV transition is charging infrastructure. EV carshare programs are typically designed to provide charging infrastructure for the vehicles serving the program. Depending on how the program is designed, it can also provide charging options for nearby EV owners. For example, Evie Carshare in the Twin Cities (which has seen impressive growth in usage since we last wrote about it) has four-port charging locations where two spots are dedicated to the carshare program, and the other two are available to the public.
A transportation option that supports other travel modes
Besides being an effective strategy to support fleet transition, EV carshare is paradoxically a way to invest in cars to encourage less driving instead of more. For folks who rely primarily on walking, biking, and public transit day-to-day, every once in a while a car is useful for a particular trip. If you have access to a carshare when you need it, there is no need to waste money on purchasing, insuring, and storing a car you use infrequently.
A carshare car can replace anywhere from 5 to 15 cars that the users of the service would otherwise own. Since they pay per trip, carshare users are less likely to choose driving for a trip than car owners, resulting in less traffic. Carshare can save Americans thousands of dollars annually that they might otherwise spend on car ownership costs.
Advancing equity
Transitioning America’s car fleet to electric means encouraging the purchase of new EVs. Most new car owners are wealthier and whiter. It’s hard to get around the issue that programs that subsidize the purchase of a new car for individuals, even if it is an electric car, and focus government subsidy on an already privileged group of people.
EV carshare can flip this script, delivering benefits and electric mobility to people less likely to be able to afford a car, generally lower-income and often communities of color. For example, an EV carshare program in rural California supports farmworkers and raiteros, the drivers who help get them to their jobs and essential services.
Worthy of public investment
While carshare operates in a few well-off and densely populated areas with little-to-no public subsidy, it has become clear that the infrastructure and service just doesn’t pencil as a purely private enterprise in most of the U.S. – just like every other transportation option from driving to flying. This begs the question of whether and how we should invest in carshare as a transportation option. With the IRA and IIJA investing billions in EV charging infrastructure and subsidies for EV purchase, carshare’s multiple benefits make it look like a very attractive national investment.
The next transportation reauthorization is sure to include another tranche of funding and programs supporting the EV transition. For all the reasons outlined above, Congress should make sure EV carshare is a significant piece of the pie.
For more information on how to implement effective EV carshare programs (including insurance, procurement, pricing, tech barriers, payments & privacy, fleet management, host sites, timelines and utilization) check out Forth’s resources on the topic.
Many climate advocates and pro-climate decision-makers are focused on electrification as the primary, or even only, emissions reduction solution in the transportation sector. As smart growth advocates, we know that electrification is essential but insufficient to achieve our greenhouse gas reduction goals. How do we push transportation electrification forward in a way that supports essential smart growth goals?
Electric vehicles aren’t the only way to travel in the above photo, where a vehicle charges next to a wide sidewalk with bike parking. Photo by Andrew Roberts on Unsplash.
Transportation is the largest energy-related source (38 percent) of greenhouse gas emissions. Emissions reduction models consistently show that electrification is essential to eventually get us to zero emissions on transportation. These models also show that EVs don’t get us there fast enough. Cars last on average for 15-20 years, and that means it will take time for the fleet to turn over from internal combustion engine (ICE) vehicles to electric.
To draw emissions down quickly enough to meet targets, we need to remake our transportation and land use system to be less car-dominated at the same time that we electrify. Transportation for America stepped up to get involved in this intersection between the two big strategies for transportation emissions reduction—electrification and VMT reduction. Alongside the Clean Vehicles Campaign, we co-lead CHARGE, a broad-based coalition seeking to advance transportation in a way that achieves multiple goals, including advancing smart growth.
Considering embodied emissions and rebound effects, electrification typically reduces emissions by about 70 percent compared with comparable fossil fuel vehicles and takes decades to achieve significant results. Many vehicle travel reductions can be implemented quickly and provide large co-benefits by reducing vehicle traffic and sprawl. As a result, travel reductions generally achieve more percentage point years (PPYs) of emission reductions and more total benefits than electrification. Chart and analysis by Victoria Transport Policy Institute.
Cross-pollination
EVs are essential but insufficient to reach climate goals, and multimodal smart growth strategies reduce emissions while delivering other benefits like equitable access to opportunity, reduced urban footprint, and less need for battery minerals, which can relieve supply chain and global security pressures.
As smart growthers in the EV-charging space, we get the opportunity to take EV enthusiasts by the hand and keep educating and reminding them about the importance of the VMT side of the equation, the co-benefits, and the strategies to accomplish it. Here are a few of our top takeaways.
1. We need to be clear that it’s not either-or. It’s both-and!
Often, rationales for reducing car dependency are misconstrued by the media as a reason to oppose the EV transition, but this is not helpful. EVs are a valuable tool for reducing emissions—they simply can’t be the only tool.
2. Learning more about how each side is approaching their issues is critical.
At first blush, electrification looks simple—just get people into EVs—while VMT reduction seems more complicated, involving land use, parking policy, street design, and transit investment. The real truth is that electrification has its complexities too. Since getting more involved in these issues, we’ve learned a lot about electric utilities, interoperability standards, tax incentives, and more.
3. Smart growth solutions can help us reach our electrification goals.
The interactions between smart growth and transportation electrification get pretty interesting. There are a few areas where we need to protect smart growth goals from misguided electrification proposals. For example, we shouldn’t require transit agencies to transition to zero-emissions in a way that undercuts transit service, and we need to be careful about subsidies for EVs that encourage car ownership or primarily benefit wealthy new car purchasers. However, education across the EV-smart growth divide has helped us to surface many powerful synergistic solutions together.
US passenger rail was the envy of the world at the turn of the 20th century. As global temperatures rise, and with the growing need to enhance intercity mobility options to get to economic and civic opportunities, it’s high time to look to and emulate our international peers in developing passenger rail: iterate, innovate, and don’t fall for the immediacy trap.
Frequent, reliable, and attractive high speed intercity rail service in Madrid, ES. T4A photo by Benito Pérez.
What do you imagine when you think of passenger rail service in the United States? Slow service, long delays, and flash frozen high-sodium food? Amtrak passengers nationwide will recognize these hallmarks of the company’s poorly-regarded passenger rail service. Repair and operational issues, such as equipment failure, staff shortages, and the conditions of rail infrastructure, contribute to delays. The result is a frustrated traveling public more likely to get in their car than take even the most convenient of train rides, leading to more driving and more emissions.
But it doesn’t need to be this way. High speed rail operations in Asia (think Japan, China) or in Europe (think the TGV in France, AVE in Spain, and many other passenger rail operators), though imperfect, have made great strides where Amtrak still lags behind. Common across these systems is an enhanced state of repair, dedicated passenger rail lines, quality user experience on the trains, and traveling speeds that rival air travel and dwarf vehicle travel. These features are the result of constant iterative processes.
Approaching the rail service platform at Atocha station in Madrid, ES. T4A photo by Benito Pérez.
With strong government support, these systems are constantly improving and reinventing themselves to focus on the customer and move them in a safe and efficient manner. They are constantly exploring service expansions to new communities to enhance mobility choice beyond the car and plane, all while exploring technological advances and infrastructure improvements to continually speed up and improve their service.
This was my experience traveling in Spain several weeks ago, taking the train from Madrid to Málaga, an otherwise 6- to 7-hour car ride covered by AVE just north of 2 hours. When you factor in time waiting at the airport, this was even less time than a flight. Along the way, I had the opportunity to dine on board, getting a freshly made sandwich, while customers were able to explore other fresh food options available.
Why has Spain successfully developed high speed rail, while Amtrak’s quality of service continues to lag behind? Looking back on the Spanish history of their rail system, starting back in the 19th century, they reached their apex in the 1950s, with 19,000 km of rail lines serving passengers. The Spanish Civil War in the late 1930s did a number to the state of repair of the rail system, forcing the government to nationalize the system by 1941. But like the US, auto ownership started to take a toll on the Spanish rail system (RENFE) in the 1950s, leading to 8,000 km of rail line to be dismantled in the coming decades.
But unlike the U.S., which took the rise in car ownership as granted and let its rail system deteriorate, Spain empowered RENFE to explore heavy investments in higher speed and capacity passenger rail starting in the 1970s. That led to a systemwide increase of rail speed to 160 kmph (100 mph, compared to Amtrak’s typical 79 mph benchmark) by 1986, and the first high speed rail line opening in 1992, followed by many more lines that have come online and are still growing across the country.
Fresh Jamón Serrano sandwich aboard an AVE train. T4A photo by Benito Pérez.
Coming back stateside, I thought: why are we not emulating such a proactive iterative approach with our passenger rail system? At the dawn of railroad technology in the 1800s, the US was a world leader in passenger rail service, with frequent service along 31,000 miles of rail. But after World War II, rail companies abandoned huge segments of the rail system as the private sector turned its attention toward vehicles and aviation. Recognizing that passenger rail is a vital mobility option for many communities in the United States, Congress intervened in 1971 with the creation of Amtrak, intent on maintaining passenger rail service as an option in the United States.
Far from reversing the deterioration of national passenger rail service, the creation of Amtrak resulted in further funding cuts, which created a vicious cycle at Amtrak of poor policy and operational decisions focused solely on the bottom line versus customer experiences. As the federal government invested further into high-speed roadways for vehicles, support for passenger rail funds deteriorated, so much so that today, some members of Congress consider the mere existence of Amtrak as government waste. Detractors of passenger rail contend that millions of taxpayer dollars are pouring into passenger rail, yet are not achieving the same results as what we see with our peers abroad. Without needed funds, we see a deterioration of state of repair and safety, user experience, and eventually a loss of ridership that would help bring in needed funding.
Though the 2021 infrastructure law’s historic passenger rail funding and policy reorientation to the customer experience has the potential to interrupt that cycle, many members of Congress are intent on gutting it before those effects can take hold. The most extreme example is the House of Representatives’ 2024 Transportation Housing and Urban Development Appropriations bill, which recommended nearly 70 percent in funding cuts to Amtrak.
As threats to essential air service and rural mobility options abound, America can’t afford to also lose passenger rail service, which is a valuable transportation option for the 1 million rural residents that do not have access to a vehicle. And as transportation continues to contribute to U.S. climate emissions, every American needs better options for long-distance travel than hopping into a vehicle or onto a plane.
There needs to be a fundamental reset in our mindset when it comes to passenger rail. There is a culture of immediacy with results; an expectation that existing resources should be working harder, otherwise take more resources away. If we expect American passenger rail to be world class, like it was in the late 19th century, we need to be investing in a world class way, through constant and iterative funding and innovation, not throwing the towel and staying complacent with the status quo.
Policy Director Benito Pérez aboard an AVE passenger car.
Autonomous vehicles (AVs) have been dangled as a transportation “silver bullet” for decades. Now, they’re finally operating as robo-taxis in San Francisco. However, the Bay Area’s experience with these vehicles so far shows that it’s our reliance on cars—not who’s behind the wheel—that’s our most pressing problem.
On August 10, the California Public Utilities Commission (CPUC) voted to allow two autonomous vehicle (AV) companies to operate robo-taxis in San Francisco 24 hours a day and charge for the rides. This decision came despite significant, wide-ranging opposition, brought up before the hearing and highlighted during. As part of limited, fare-free pilots conducted by these companies, San Franciscans have experienced exactly the chaos that replacing imperfect humans with impartial computers was supposed to solve.
This decision by the CPUC is a continuation of the mistakes we’ve made with our transportation systems for the past century. AVs are assumed to be the solution to dangerous streets, traffic congestion, and transportation emissions. Unfortunately, as they’re set up right now, AVs are nothing more than a distraction from the policy changes that would make our transportation system safer, more equitable, and more sustainable.
The unmet promise of automating transportation
Automating transportation isn’t a bad idea. In fact, automated transportation has existed for decades, in the form of public transit. Automated metros in places like Tokyo, Vancouver, and now even Montreal and Honolulu move millions of people every day around the globe. At airports across the U.S. you can also find automated “people movers” helping people move between terminals and access local transportation options. These technologies are highly regulated and implemented with a clear purpose: they reduce operating costs while increasing the capacity of public transit, allowing more people to travel.
For nearly a century now, car-makers have been arguing that automation could similarly revolutionize car travel. As historian Peter Norton has described, the automobile industry has depicted self-driving cars as a generation away for the past several decades. For people who can’t drive due to a disability, people too old to drive, people too young to drive, and people who simply don’t want to drive, this technology would be transformative.
Unfortunately, even if this future were as close as it seems, it may not live up to its promise.According to an advertisementby Cruise—one of the two companies now operating robo-taxis in San Francisco—if their technology was behind the wheel instead of humans, we would have far fewer deaths on our roadways because their products are “designed to save lives.”
This contrasts with reporting and data collected by the National Highway Traffic Safety Administration (NHTSA) highlighting that AVs are certainly still involved in crashes, many of which result in serious injuries and fatalities. San Francisco’s experience as an AV-guinea pig provides some data on crashes and some insight into AVs’ current flaws. There are documented cases of AVs driving away from police, cruising down sidewalks, and coming to a dead halt when cell service is bad. While AV makers say these are anomalies, without data from the companies to disprove this we can only believe what we see plainly before us.
Beyond safety, AV proponents also promise less wasted time. With our cars driving themselves, we will be able to travel everywhere we need to go while still being able to work, catch up with friends and loved ones, or just relax from inside a car. However, this argument assumes that the amount we drive stays the same, an unlikely scenario when driving no longer requires anybody actually driving. In fact, researchreplicating an AV future and an analysis of data from existing partially automated driving technology show that AVs will lead people to spend significantly more time on car travel.
This additional time spent in a car also threatens to torpedo any hopes of a more sustainable transportation system. No matter whether AVs are electric or not, a future with more driving would still involve more extraction of natural resources and more pollution from tires and brakes. We will never reach ambitious climate targets with a transportation system that requires people to drive more, not less.
Promising a technological solution to a political problem—and then using political will to force their solution on society—is a consistent behavior of the auto-industry. In the 1920s, the industry knew that their products were killing children and congesting city streets. But instead of changing their products, they changed our communities. They created and supported the policies that have destroyed vibrant neighborhoods and displaced their residents, emitted huge amounts of carbon, and killed tens of thousands of us every year. That’s not innovation, it’s exploitation.
Selling us a bill of hoods
If AVs were being pursued because they were the most effective way to help people who will never be able to drive, maintain mobility for aging members of our communities, and save lives, we would all welcome them with open arms. That’s why the Advocates for Highway and Auto Safety have released a list of tenets, which Transportation for America has signed on to, to guide an introduction of AVs into our vehicle fleet.
These guardrails aren’t an attempt to stop us from getting to a self-driving future. These policies are what’s required to ensure that the future includes everybody, including those outside of a car. That’s why individuals and advocacy organizations who exist to make transportation safer have made it clear: without changes to transportation policy, AVs aren’t set up to solve our problems, just automate them.
Right now, AV-makers would have us believe that all of our transportation concerns will go away if we simply replace human drivers with computers. But we know this is not true. Automation that leads to more driving will not reduce congestion or emissions. It will not free people from increasingly long trips to reach their essential destinations. It will not relieve people of the financial burden of car ownership. And it will not change the dangerous design of our roadways, which encourages high vehicle speeds at the cost of pedestrian safety. If we continue to give AV-makers free reign, without government regulation and data collection to understand their impact on our roadways, we will not get any closer to solving the problems AVs are supposedly ready to solve.
AV-makers—including the robo taxi companies in San Francisco —aren’t trying to solve these problems. They’re just trying to sell us cars.
Our Transit Report Card analyzes how states compare on transit access and support. To understand how our figures match up in the context of other countries, we took a look at one of our peers: Australia.
In part 1 and part 2 of this series, we compared U.S. states’ support for transit based on funding and access. Those figures are hard to understand without context, so we found ourselves asking: how do U.S. states compare to similar jurisdictions in other countries when it comes to transit policy?
But “similar jurisdictions” don’t exist in many other countries. Most other industrialized countries either control all transit policy at the national level (think the United Kingdom, France, and Japan) or cede only limited power to sub-national governments (think Germany, Mexico, and India).
We were, however, able to find one country with sub-national governments that have primary control over transit policy. That country is Australia, which funds its transportation infrastructure much like the U.S. does. Their national government distributes transportation funding directly to states and territories in the form of block grants. States and territories, in turn, direct that funding to specific projects, including public transit. Though the Australian system is different from ours in meaningful ways (like their more streamlined federal investment approach), their structure is similar to our own, where state governments dictate the vast majority of transportation spending and policy.
So we partnered with Movement & Place Consulting, a Melbourne-based transport consulting firm, to rate Australia’s nine internal states and territories on some of the same metrics that we used to rate U.S. states.
To better understand this phenomenon, we measured how much Americans and Australians drive, measured in annual vehicle miles traveled (VMT) per capita in each U.S. and Australian state.
As we explained in part 2 of this series, most American states see over 10,000 miles per capita, with just a few exceptions. Washington, Oregon, Alaska, Hawaii, Illinois, New York, DC, Pennsylvania, and Rhode Island all had less than 8,500 VMT per capita in 2019, the year before the pandemic changed driving patterns around the country. But how does that compare to other countries?
Map is not drawn to scale. Based on 2019 VMT data.
Australia, despite being far more sparsely populated than the U.S., does not even come close to our VMT per capita. The highest VMT Australian state, Western Australia, drives about the same amount (6,430 miles per person per year) as the lowest VMT U.S. state, New York (6,373 miles per person per year). And every Australian state fits within the lowest category of our U.S. map. So the Australian map looks stark in comparison:
Australians are able to have a significantly reduced VMT per capita as residency is highly concentrated within a single point in each state. While in most U.S. states, 20 percent of the population lives in their largest city, approximately 67 percent of Australia’s population lives in each state’s capital city.
VMT per capita provides the most straightforward comparison between the U.S. and Australia, but what about access? For our U.S. analysis, we took a look at federal data to get a sense of how well transit was connecting people to their essential destinations. This gave us a transit access index, which we converted into state rankings.
Australia does not have a database equivalent to what we used in our U.S. access analysis. But we can learn a lot about Australians’ access to transit by examining its land use strategies. Land use is in fact so central to transit quality that the Federal Transit Administration (FTA) has made it a core priority.
Let’s compare two metro areas of roughly the same population: Greater Phoenix (pop. 5.01 million) and Greater Melbourne (pop. 5.03 million). Melbourne’s transit system, Public Transport Victoria, carries around 600 million riders per year. Even prior to the COVID-19 pandemic (which reduced transit ridership across the country), the Phoenix region’s transit system, Valley Metro, carried only about 66 million people per year.
Why do Melburnians ride public transit so much more than Phoenicians? Funding is certainly part of the equation, but perhaps more importantly, Melbourne’s land use is much denser and overall more conducive to transit access. Greater Melbourne has 1,305 people per square mile, compared to Phoenix’s 332 people per square mile. Melbourne’s denser population is much easier to connect by transit. In addition, Public Transport Victoria has constructed an interconnected system of heavy rail, trams, and buses in a way that connects even the most remote suburbs.
By comparison, Valley Metro operates only one light rail line, and while the city operates a bus network as well, frequent service is few and far between. Even the most frequent lines operate 15 minute headways during peak hours and 30 minute headways off-peak, not even close to the frequency or reliability of Melbourne’s transit network.
So the question of why Melburnians ride more public transit than Phoenicians becomes obvious: there’s more of it. Melbourne runs faster transit, of more variety, and with more frequency. And while Phoenix might be just one example, its story is all too familiar in cities across the United States.
Funding
Our funding analysis of U.S. states is much harder to compare to Australia’s, but that’s kind of the point. Australian states spend much more on transit overall, but it’s not because they have more money to work with.
The U.S. earns most of their funding for transportation through gas tax revenue. However, the vast majority of U.S. states restrict the amount of funding that their legislatures can allocate to transit systems. This creates a counterintuitive cycle. Without efficient and convenient public transit service, Americans are forced to drive more, leading to more money spent on gas taxes that then cannot be invested in alternative forms of transportation.
Map is not drawn to scale.
In comparison, Australia’s constitution does not explicitly discuss transportation funding—states are able to fund public transport as they deem appropriate. Furthermore, funding for Australian transport infrastructure is supported mainly by general taxation revenue and council rates rather than depending largely on gas tax.
The result: Australian states devote much more of their resources to public transit than U.S. states. Even Australia’s most remote and sparsely populated territory, the Northern Territory, spends more on public transit per capita per year ($183.48) than every U.S. state except for New York ($255.90), Massachusetts ($238.76), Hawaii ($220.98), and Maryland ($198.72).
Lessons learned
Even the best U.S. states have a long way to go in comparison to their international peers. This point became clear in our conversations with Australian experts while doing this research.
It’s easy to dismiss international transit comparisons as “apples to oranges.” But that excuse crumbles when the comparison is being made to a true peer like Australia. Both countries are large, developed, constitutional republics with low national population densities and strong sub-national governments.
While Australia’s transit system is far from perfect, the United States can learn a lot from our friends across the Pacific. We can have suburbs while still increasing density to support transit. We can have a robust highway system while still giving people other high-quality options. And we can do it by integrating transit systems to create a convenient user experience.
We can, and we must.
Learn more about our state-by-state analysis of transit support and availability, and see a full table of results. Click here >>
To check the ever-increasing danger on our nation’s roadways, Transportation for America joined a coalition of advocates to call for stronger federal assessments of large vehicles. Read our comment letter.
More than 6,500 people walking were struck and killed in 2020, and the Governors Highway Safety Association projects that even more were killed in 2021, a sign that our streets continue to be dangerous for people traveling outside of a vehicle. As we wrote in Dangerous by Design, deadly street design, which prioritizes vehicle speed over pedestrian safety, is a key factor to these deaths, and people of color, particularly Black and Native Americans, face the worst consequences of dangerous design.
In a contributing essay, America Walks explained how vehicle size also plays a role in the likelihood that a pedestrian will die when struck by a vehicle. Ever-larger vehicles, and increasingly aggressive drivers, have an impact on the safety on our nation’s roadways. However, federal safety ratings have long ignored how vehicle designs impact the safety of people outside of the vehicle. That will soon change.
The National Highway Traffic Safety Administration (NHTSA) has proposed an update to the New Car Assessment Program (NCAP) that would aim to acknowledge the danger the vehicle could pose to pedestrians and other road users outside of the car. The current five-star safety rankings, which evaluate the safety of only the people inside the vehicle, will remain in effect. However, NHTSA proposed adding a “pass” or “fail” symbol to represent danger for people outside of a vehicle.
We joined a coalition of advocates, led by the National Association of City Transportation Officials (NACTO), to submit comments on this proposed update, which highlighted the following suggestions to strengthen NHTSA’s update:
Any vehicle that receives a failing grade for pedestrian crashworthiness should be ineligible for a 5-star rating.
Adopt a 5-star scoring system for pedestrian crashworthiness, rather than a pass/fail system.
Consider evaluating pedestrian crashworthiness at speeds higher than 25 mph in addition to at or below 25 mph.
Incorporate information about other vehicle safety features that are proven to protect people outside of vehicles into the rating system, and ensure no vehicle receives a 5-star rating if it doesn’t include those features.
This update is a start, but with an ever-increasing number of traffic fatalities each year, the current proposal fails to properly communicate the danger large vehicles pose to people walking and rolling. We’ll continue to call for safer streets for all travelers, whether they’re in or out of a car.
Spurred on by COVID-19 disruptions, leaders of the Puget Sound Regional Council found a new way to allocate federal transit formula dollars. Their equity-focused distribution could help the most vulnerable communities while also adapting to new travel trends.
The COVID-19 pandemic was, and remains, one of the most influential shocks to transit systems across the country. Transit agencies struggled with lost revenue and ridership paired with escalating operating costs. The federal government intervened during the height of the pandemic by investing billions in stimulus and relief through Federal Transit Administration (FTA) formula funding. But when those funds arrived in Puget Sound, it became apparent to some leaders in the Puget Sound Regional Council (PSRC) that this funding was not flowing to disadvantaged communities that needed it most.
Rather than continuing on as is, members of the PSRC’s Transportation Policy Board (TPB) and local transit agency leadership came together to rethink how the region uses federal formula dollars to prioritize equity and build up service for disadvantaged communities.
Traditional distributions
The FTA apportions formula funds to regions around the country based on the services and operational data provided by transit agencies in the National Transit Database. Using that data, the FTA then applies the titular “formulas” of formula funds, distributing dollars to urbanized areas (UZAs) across the country.
PSRC serves three UZAs: the Bremerton, Marysville, and Seattle-Tacoma-Everett UZAs. As the Bremerton and Marysville UZAs are each served by a single transportation agency, the local UZA apportionment is simply distributed to those agencies. In the case of the Seattle-Tacoma-Everett UZA, the FTA distributes a lump sum of funds for the PSRC to allocate to eleven transit agencies.
In PSRC’s old distribution strategy, 86 to 88 percent of funds are distributed to each local transit agency in line with the FTA’s standard earned share formulas. The remaining percentage of formula funds was then doled out through regional competitions and preservation set-asides. In practice and in line with historical transportation priorities, this method tended to award agencies and services focused on moving commuters from suburbs to downtowns.
Equity first
For people who cannot afford the high cost of car ownership, access to high-quality transit remains a valuable method to access jobs and services.
Proposing a new, revised distribution policy, several members of the TPB, including Pierce County Councilman Ryan Mello and Tacoma Deputy Mayor Kristina Walker, pushed for a policy that would prioritize funding to equity focus areas, places where disadvantaged groups are concentrated and would benefit from better transit service. This change would allow PSRC to align their funding allocations with the region’s priorities, using a demographic lens to identify communities most in need of transit access.
Under the new methodology, PSRC would use federal census data to identify where people in equity focus populations are located, with an emphasis on serving people with disabilities, youth, the elderly, people with low incomes, people of color, and people with limited English proficiency.
After calculating the number of people in equity focus areas within half a mile from bus stops and a mile from rail stops, and with an adjustment to reflect the nuanced service provided by state and county ferries, the PSRC would proportionally distribute funds to the transit agencies that serve the underserved.
Funding for the new distribution formula comes out of what had previously been used for regional competitions and preservation set-asides. It represents about 14 percent of total funding, seriously boosting agencies serving equity focus areas. For Pierce Transit, the formula change resulted in a funding increase of approximately $9.8 million annually.
Preservation Set Aside Funding (in millions)
Percentage of Regional Total*
Equity Formula Distribution (in millions)**
Percentage of Regional Total
Community Transit
$2.20
2.90%
$11.70
15.00%
Everett Transit
$0.20
0.30%
$2.80
3.60%
King County Metro
$15.90
21.00%
$33.60
43.10%
Pierce County Ferries
$0.20
0.30%
$0.20
0.30%
Pierce Transit
$1.20
1.60%
$11.00
14.10%
City of Seattle
$0.10
0.10%
$2.50
3.20%
Sound Transit
$11.20
14.80%
$12.90
16.60%
Washington State Ferries
$3.10
4.10%
$3.20
4.10%
TOTAL
$34.10
$77.90
* Not including regional competition funding** Includes preservation set asides and former regional competition funding
Seattle-Tacoma-Everett UZA funding distributions changed significantly under the Equity Formula Distribution. Table developed using data provided by Puget Sound Regional Council.
Because these funding changes came out of a limited budget, the council had to make compromises. Since the new formula distributions came out of what had been money for regional competitions, some agencies and projects received less funding than before.
“Working through the exercise was of great value for folks to actually see, numerically and through mapping, where the equity focus areas are and where they are or are not being served by transit,” reflected Councilmember Ryan Mello, who helped lead the change.
In the post-pandemic “new normal,” local-level transit that connects people to everyday services maintains vital access for disadvantaged communities.
“We had the ability to have a conversation with the region. We say racial equity is a value—well, here’s an opportunity to put money into it. I had to rustle feathers to make the effort, but it pushed people hard to put the money where your values are, even at the expense of other things.”
By reorienting funding to prioritize transit equity, while also remaining adaptive to new travel trends, the PSRC’s Equity Funding Distribution can serve as an example for governments and agencies that claim to hold equity at the core of their mission.
Thanks to Grant DuVall for contributing to this post.
In a conversation with CBS Sunday Morning, T4A’s executive director Beth Osborne explains that our roads are dangerous by design.
If you watch CBS on Sunday mornings, you might have caught our own Beth Osborne talking about dangerous street design. She was joined by John Barth, who’s working on Complete Streets implementation in Indianapolis, and Latanya Byrd, a safe streets advocate in Philadelphia.
In the clip, Beth explained why more people are being hit and killed on our nation’s roadways. She noted that vehicles have gotten bigger, and streets continue to be designed for speed over safety. As we explained in our report Dangerous by Design, the combination of speed and size leads to deadly consequences for people walking, particularly people of color.
“It turns out when we build things unsafe for pedestrians, we build them unsafe for everybody. There’s really nobody winning in this system,” said Beth.
Our newest video, part of Divided by Design, helps explain how federal guidance known as value of time gets used every day to justify the cost of building incredibly expensive highways (or additional highway lanes) that divide our communities, produce more congestion and pollution, and ultimately make it harder to get around in nearly every way.
Our new Divided by Design report examines how the transportation models, policies, and practices we use today took root in the highway era, and they continue to inflict the most harm on people of color. Value of time is just one example of the outdated tools transportation planners and engineers use today that perpetuate harm.
When moving vehicles quickly on all roads is the number one goal for transportation agencies, agencies focus on time savings to drivers at the expense of nearly every other type of user or activity. Value of time encourages agencies to increase speeds and eliminate congestion at all costs, but its emphasis on vehicle speed alone ultimately leads to longer trip times and divided communities.
With federal transportation funding set to be reauthorized in three years, the congressional Future of Transportation Caucus met with advocates to discuss the country’s most pressing funding priorities.
Representative Jesús “Chuy” García speaks at the Future of Transportation Caucus, with Representatives Ayanna Pressley and Mark Takano seated on either side of him.
A crucial conversation about our transportation priorities
With every passing day, reauthorization for federal surface transportation funding grows closer and closer. Our current framework, the Infrastructure Investment and Jobs Act (IIJA), expires in 2026, and it’s critical that the country gets its funding priorities right by then. If our dollars don’t go towards the right initiatives and objectives, spending more money on transportation and infrastructure will only result in the same poor outcomes. With many competing priorities, discussion between policymakers and advocates about the current state—and future of—our national transportation system remains essential.
Last Wednesday, July 12th, the Future of Transportation Caucus, led by Representatives Ayanna Pressley (MA-07), Jesús “Chuy” García (IL-04), and Mark Takano (CA-39), led a roundtable discussion with advocates on transportation electrification, public transit, active transportation, public health, and road safety. These leaders met to talk through transportation priorities and find common ground.
What does our transportation funding need to focus on?
Advocates covered a wide range of issues, including transportation electrification, operations funding for public transit, and road safety. Advocates discussed the need to electrify public transit and medium/heavy-duty vehicles as well as affordable, safe, and equitable charging for electric vehicles (EVs). Regarding operations funding, advocates spoke about expanding and supporting operations in the face of transit fiscal cliffs, increasing service frequency, and exploring solutions to reduce barriers and increase transit ridership. Finally, road safety advocates discussed improvements for bicyclist and pedestrian safety as well as the dangers of poorly thought-out autonomous vehicle (AV) rollouts in cities.
One point in particular proved to be an underlying thread throughout the conversation: a need for the basics—the baseline infrastructure essential for cities—to be focused on people, at the very minimum. Advocates emphasized the importance of good bus systems and facilities, functional sidewalks, and more, recounting how much of a difference that investing in these essentials made in their communities and socioeconomic outcomes.
It’s essential that Congress gets the right transportation funding priorities in line before the next reauthorization cycle rolls around in 2026. With a massive rise in pedestrian fatalities, a focus on expansion that leaves , and a climate crisis that has only begun, America can’t afford to continue with more of the same. Instead, we need to rethink what our current funding dollars are going towards. T4A’s three key principles for transportation infrastructure investment—prioritize maintenance, design for safety over speed, and connect people to jobs and services—can serve as a guiding framework for a plan that brings the country towards safe, convenient, affordable transportation for all.
We need to move past the outdated “80/20” highway/transit funding split and resist getting distracted by fantasies that promote car dependence like smart cities dominated by AVs. Rather, our federal funding needs to prioritize the maintenance and repair of existing infrastructure, advance safer streetscapes centered on people first, and prioritize access to goods and services, including increasing operations funding for public transit so agencies can expand the crucial services that people rely on.
At the end of the day, we need to commit to investing in our vision of an accessible and equitable transportation system that strengthens communities—one that focuses on moving people, not just vehicles.
Our new report examines the racist roots of our current transportation system. Most importantly, it demonstrates how today’s policies and practices were shaped by the past, leading to racial disparities today. Without a fundamental change to the overall approach to transportation, today’s leaders and transportation professionals, no matter their intent, will perpetuate and exacerbate the damage.
Beginning in the 1950s, highways devastated communities of color and changed our cities forever. But the consequences continue, even as we begin to acknowledge our past mistakes.
To create a better system, we can’t settle for small changes. We need a total shift in approach.To learn more about the report and our analysis, join our webinar on July 25 at 2 p.m. ET.
Part I examines the damage and inequities deliberately created by and in the federal transportation program from ~1950 onward. It concludes with a unique analysis of both an unbuilt and built highway segment within Atlanta and Washington, DC to quantify what was lost, who bore the brunt of the damage, and what could have been lost with highways that were never built.
Part II examines our current transportation program to demonstrate how the programs, standards, models, and measures have their roots in the previous era and exacerbate inequities—whether intentional or not.
Part IIIoutlines what needs to change—concrete steps we can take to fundamentally reorient the program around unwinding those inequities.
Two cities divided
Divided by Design also quantifies the damage caused by highways in two U.S. cities: Atlanta, GA and Washington, DC. Like hundreds of others in the U.S., these cities are forever scarred by highways that demolished communities of color, robbing them of opportunity and potential.
Atlanta’s I-20 displaced over 7,500 people and destroyed 1,400 occupied homes. In DC, I-395/695 displaced over 5,000 people and demolished 2,200 homes. These numbers only scratch the surface of the full damage and dislocation.
More significant damage was also avoided in these cities. To understand what might exist in these communities if they hadn’t been disrupted by highways, we looked at two planned highway segments that were never built and the hundreds of businesses, office buildings, and homes that wouldn’t exist today. Click to read these stories:
The damage continues
The models, policies, and practices we use today took root in the highway era, and they continue to inflict the most harm on people of color. Our approach leads to worse health outcomes, greater congestion, and deadlier roadways. It leaves millions of Americans without access to reliable transportation options to get where they need to go. We can’t build a better system on a rotten foundation. It’s time for a paradigm shift.
We need a new approach.
Read Divided by Design
Explore the report’s full content—jump to one of the three parts with the graphics below.
The predicted traffic levels on which transportation planners base their decisions are erroneous and rooted in obsolete methods. Here’s how transportation models fail to accurately predict future traffic, and how you can call out their misuse.
The 26-lane Katy Freeway in Houston had worse traffic after its widening than before. Were the traffic models wrong? Photo: Wikimedia Commons
You’ve seen it before. A state DOT claims they must widen a highway through your community to reduce congestion and accommodate future traffic. The transportation agency points to traffic projections that we all take at face value. They might even claim that widening the highway will improve traffic flow thereby reducing emissions. You don’t want the highway widening in your community, but what can you do in the face of experts saying it is necessary and pointing to data that “proves” their case?
Transportation agencies use transportation models to predict future traffic and plan the roadway system accordingly. But the underlying algorithm for these models was developed in the 1980s when the computers in use were less powerful than today’s smartphones. Due to this past limitation in computing power, travel demand models use a simplified approach that doesn’t accurately represent how people make travel decisions.
T4America experts collaborated with our partners to look inside the black box of transportation models (also sometimes called travel demand models or traffic models). We submitted a memo to the US Department of Transportation asking them to apply more accountability to agencies using these models to correct them.
Some of the transportation models’ specific flaws
The proof that transportation models are failing us is plain to see in the long term trends. Over the last 20 years, congestion has increased in every single U.S. metropolitan area regardless of how much they’ve expanded their highways and regardless of whether their population grew or shrank.
In what way have transportation models misled us? It largely has to do with the underlying approach which is too simple, chosen because of limited 1980s computing power. Transportation models use a Static Traffic Assignment (STA) algorithm which is a sort of snapshot in time of how much traffic is on each roadway in a region at a given moment. This static algorithm is problematic, since people make decisions on different factors every day, often in the moment. People are dynamic not static.
What’s more, STAs do not properly account for bottlenecks, or constrain forecasts based on roadway capacity. No roadway can ever carry more cars than its maximum capacity, any more than a coffee mug can hold 110% of its coffee capacity. Yet agencies routinely and confidently make claims like, “without this expansion, the roadway will be at 110% capacity.” If you point out that a roadway can’t handle more cars than it has capacity for, they say that extra 10 percent is “latent demand.” In other words, they are certain that there’s exactly 10 percent more cars and trips out there that must be served.
We call this induced demand—demand created by the new road itself—a concept those same agencies often claim doesn’t exist. (But which the public absolutely understands, as our brand new national polling shows.) By trying to sell the project on all that “latent” demand, they can claim a traffic nightmare if nothing is done without admitting that the project will actually create more traffic—and more greenhouse gas emissions, fine particulates, etc. [USDOT and the Environmental Protection Agency support that approach for some unfathomable reason, never asking if the models used to justify federally funded projects have been right.]
In reality, as congestion increases toward that 100% capacity mark, people make different travel decisions, change their routes, choose to travel at a different time, use a different mode or choose a closer destination to fulfill the same need. If there is a crash, people delay their trip or consult Google maps and choose a different route. But transportation models using the STA approach unrealistically assume people will blindly keep driving a congested roadway, no matter what is happening or how long their trip will take.
Not only does the model assume no changes in behavior, but it will also output results that show drivers stuck at one bottleneck, while simultaneously allowing them to magically pass through that one to also be stuck at another bottleneck downstream.
Compounding these issues, planners rarely, if ever, look back at their past work to see if their predictions were correct. Did the traffic materialize? We’re stuck with decades-old models that are never tested or upgraded to reflect reality, as shown here:
This graphic from the Frontier Group combines past federal projections of future growth in vehicle miles traveled. Every year a new optimistic projection was made that ultimately didn’t pan out, but they kept on predicting the same thing.
How to question your region’s model
We’re hopeful that USDOT will eventually provide accountability to upgrade the state of practice on transportation modeling, but you can also ask questions about the transportation models used to promote road widenings in your community. Here are some things you can ask your local transportation planners to illustrate the flaws of using transportation model results to justify road widenings:
Does your model use Static Traffic Assignment?
What is the maximum volume to capacity in your model runs, and how is that realistic? (If they give a volume over 100%, ask how a road can carry more than its capacity. And ask if latent demand will fill the new capacity they are building then what good will this investment do?)
How does your model account for dynamic changes in commuting patterns, responses to crashes, or the threshold at which people shift to other modes?
What is your protocol for evaluating the accuracy of your past traffic projections and using that to improve upon the model? Where is it published?
Getting our transportation models to better reflect reality will help planners make better decisions about where to invest our tax dollars. Calling on USDOT to upgrade standards for transportation models, and calling out their misuse locally in the meantime will help us turn the corner to more sensible improvements to transportation in our nation.
The EPA’s proposed tailpipe regulations could reduce carbon emissions across all types of vehicles over the coming decades. While reducing emissions produced on the road can only be part of our national climate strategy, the EPA’s rule could be a boon for communities thanks to the benefits of zero emissions vehicles. However, recent opposition means this rule’s future could be at risk.
On April 12th, 2023, the Environmental Protection Agency (EPA) announced an update to federal vehicle emissions standards that could accelerate the ongoing transition to a clean vehicle future. While these new measures are an essential step forward, addressing vehicle emissions at the exhaust pipe alone is no silver bullet. As we found in our Driving Down Emissions report, we need to combine vehicle electrification strategies with transportation alternatives, like transit, walking, and biking, to make the most of the clean vehicle switch. The EPA has since released the text of the proposed rule, with comments closing soon—July 5, 2023.
When combined with another proposed rule that closed comments in mid-June, this rule would require that by 2032, two-thirds of cars and light trucks, 46 percent of medium-duty vehicles (such as delivery vans), half of all buses, and a quarter of all heavy-duty trucks sold would need to be zero-emission vehicles. The rule does not specify the fuel source to reach zero emissions, leaving the industry room to experiment with new solutions.
The EPA estimates that just the new light-duty tailpipe regulations alone could cut down the U.S.’s carbon emissions by 15.5 percent. These sweeping regulations on new vehicles would take effect in 2027 and build off a decade of standards implemented by the EPA.
The third and final phase
This recent regulation is the last phase of a three-step strategy to support the United States’ international commitments to limit emissions and slow the progress of climate change. The first two phases of the EPA’s tailpipe emission standards focused specifically on medium- and heavy-duty vehicles. Phase One (2011) of the greenhouse gas emission standards targeted medium- and heavy-duty vehicle (MHDVs) models to be made in the years 2014-2018 and set fuel efficiency and emissions standards for manufacturers, while Phase Two (2016) set even stricter standards for MHDVs for the model years 2019-2027.
With the years of lead time provided, these regulations gave automotive manufacturers adequate time to slowly ramp up the production of cleaner vehicles. At the same time, they introduced standards that reduced both CO2 emissions and consumers’ fuel costs by increasing efficiency within the physical limits of traditional internal combustion engines.
Understanding the impact
Phase Three standards are heavily influenced by the rapid uptake of electric vehicles. Recent innovations in electric vehicle technology and the record federal investments in EV infrastructure in the 2021 infrastructure law and Inflation Reduction Act make the ambitious new standards a viable goal.
The EPA estimates that Phase Three standards could save 7.3 billion tons of CO2 emissions from light duty vehicles between 2027 and 2055 and avoid 1.8 billion tons of CO2 from heavy-duty vehicles through 2055. That’s the equivalent of eliminating all greenhouse gas emissions from the entire current U.S. transportation sector for an entire year. Overall, the EPA estimates that the value of benefits, such as improved health outcomes and mitigated emissions, would exceed total costs by at least $1 trillion over the course of its existence. These improvements could only be made possible through widespread adoption and production of electric and other zero-emission vehicles, which the rule functionally requires.
The ongoing electrification transition is an opportunity to make equitable investments across all communities. You can take a look at our vision for America’s electric future in Sparking Progress, our report produced in collaboration with the Coalition Helping America Rebuild and Go Electric (CHARGE).
Let EPA know if you support cleaner vehicles
Despite the benefits these changes could bring to the nation’s overall health, air quality, climate, and communities disadvantaged by heavy-duty vehicle emissions, some powerful interests oppose the new rule. In May, 151 members of the majority party in the US House of Representatives signed on to a letter to denounce the new standards. Later, on June 7, 2023, Florida Senator Marco Rubio sent a letter to the U.S. Securities and Exchange Commission referencing the rule and arguing, contrary to the evidence, that EVs could pose a threat to the electric grid.
These attacks on clean air come at a crucial time, as the EPA is seeking comment on the rule through July 5, 2023. A strong tailpipe emissions rule, coupled with our recommendations to reduce vehicle miles traveled in the Driving Down Emissions report, could be a powerful force to combat climate change and increase the efficiency of the transportation system.
New nationwide survey shows that prioritizing road repair, improving transit, and reducing driving are more popular options for spending transportation dollars
WASHINGTON, D.C. (June 29) — A new nationwide survey of American voters’ attitudes reveals a significant divide between voters’ attitudes about the best short-and long-term solutions for reducing traffic, versus the actual priorities of their state and local transportation agencies.
In 2021 The Washington Post estimated that highway widening and expansion consumed more than a third of states’ capital spending on roads (over $19 billion). These projects were backed by promises to reduce congestion. The public isn’t buying it. The results of a national survey of 2,001 registered U.S. voters—90 percent of whom own a car they drive regularly—underscores a widely shared belief that highway expansion doesn’t work as a short- or long-term strategy for reducing traffic and that we should invest more in other options.
70 percent of respondents agree that “providing people with more transportation options is better for our health, safety, and economy than building more highways.”
67 percent of respondents agreed that “expanding highways takes years, causes delays, and costs billions of dollars.” The same percentage believes that “widening highways attracts more people to drive, which creates more traffic in the long run.” Only 11 percent felt state DOTs actually deliver congestion relief with highway expansions. In other words, the public understands the concept of “induced demand,” which is widely ignored by state legislatures, DOTs, Congress, and federal agencies.
69 percent of respondents agree that “it’s more important to protect our quality of life than to spend billions of tax dollars on expanding highways. By removing a few miles of highway and adding more transportation options, like trains, buses, bike lanes, and sidewalks, we can have healthier communities.”
71 percent of respondents agree that “no matter where you live, you should have the freedom to easily get where you need to go. Almost all government spending on transportation goes to highways. Instead, states should fund more options, like trains, buses, bike lanes, and sidewalks.”
The survey revealed a deep dissatisfaction with the overall status quo of state and local transportation spending which overwhelmingly prioritizes spending on new roads, often at the expense of keeping roads and bridges in good condition, investing in transit and safe streets for walking or biking, or reducing the need to drive overall. Given seven choices for the best short- and long-term solutions for reducing traffic, the least popular option was “building new freeways and highways,” even as states are poised to spend tens of billions on new highways thanks to the 2021 federal infrastructure law.
“Our country remains on a highway spending spree while requests for basic investments in walkability and transit are given low priority. I hope this survey serves as a wake-up call to politicians that the public is clamoring for reasonable investments in our health, climate and quality of life, not traffic-inducing polluting highways,” said Mike McGinn, Executive Director of America Walks.
Prioritizing the repair of existing roads and bridges first was the top option for how states should be investing their transportation funding (selected by 22 percent of respondents), though Congress has long agreed—in a strong bipartisan fashion—not to institute any binding requirements to prioritize repair first.
“We’re repeatedly told by leaders on Capitol Hill that requiring states to prioritize maintenance first is just too controversial,” said Beth Osborne, director of Transportation for America. “But this survey shows yet again that there’s no controversy among the people they serve—they’re beyond ready to retire the last generation’s playbook when it comes to improving mobility and getting them where they need to go.”
While “reducing congestion” is the top policy goal that shapes the spending decisions of most state DOTs, traffic is not a huge stumbling block for most people to access what they need. Just one in four said they find it difficult to get around.
Survey respondents expressed positive feelings about a range of messages about spending transportation money differently, demonstrating that voters are looking for new ideas, policies, and/or investments that address their problems and deliver meaningful benefits to people and communities—instead of just doing the same old things over and over again. (See attached PDF for full results on pages 19-22, all of which were supported by over 60 percent of respondents.)
“These results are clear: Americans are eager to see the transportation investments that can connect and repair their communities,” said Rabi Abonour, a transportation advocate at NRDC (Natural Resources Defense Council). “Federal, state and local leaders should follow the lead of the public and invest in the public transit and related projects that will really improve mobility, clean the air, and address climate pollution.”
Hattaway Communications, a strategic communications firm based in Washington D.C., was retained to conduct this survey of 2,001 registered voters and assess their awareness of relevant issues, attitudes toward transportation projects, and aspirations for their communities. The survey was fielded online, between February 23–March 7, 2023, and reflects the demographic and geographic composition of the United States.
This survey was supported by the Natural Resources Defense Council and a grant from the Summit Foundation.
###
Transportation for America is an advocacy organization made up of local, regional, and state leaders who envision a transportation system that safely, affordably, and conveniently connects people of all means and ability to jobs, services, and opportunity through multiple modes of travel. T4America is a program of Smart Growth America. Learn more at t4america.org
America Walks is leading the way in advancing walkable, equitable, connected, and accessible places in every community across the U.S. We are the national voice for public spaces that allow people to safely walk and move. At the regional, state, and neighborhood levels, America Walks provides critical strategic support, training, and technical assistance to partner organizations and individuals to effectively advocate for change. https://americawalks.org/
The Natural Resources Defense Council (NRDC) works to safeguard the earth—its people, its plants and animals, and the natural systems on which all life depends. https://www.nrdc.org/about
Despite a binding requirement to release an updated version more than a month ago, the Federal Highway Administration missed the deadline to release a new edition of a federal handbook with national influence on street design. There were many positive changes proposed for this edition, but unless this delay comes because further improvements are underway, this new edition might ultimately be another green light for increasing traffic fatalities.
Edit 6/30: Language in an earlier version of this post overstated the power of the MUTCD in shaping street design. While this manual is influential, other important resources inform street design, including the Green Book. This language has been changed.
A cyclist waits to cross as cars zip past. Source: Flickr
As Smart Growth America wrote in their 2022 report Dangerous by Design, the number of people struck and killed while walking reached yet another new high in 2020. More than 6,500 people were struck and killed while walking in 2020, an average of nearly 18 per day, and a 4.5 percent increase over 2019. This epidemic continues growing worse because our nation’s streets are designed primarily to move cars quickly at the expense of keeping everyone safe, but change can be made on every level to reorient toward protecting the most vulnerable rather than prioritizing the speed of a few.
There’s one Dangerous by Design recommendation that the federal government can take action on right away: an update to the little-known but highly influential Manual on Uniform Traffic Control Devices (MUTCD), defines standards for traffic control devices, which includes pedestrian crossings and lane markings like green bike lanes and red bus-only lanes. Though the current MUTCD prioritizes vehicle speed over pedestrian safety, the 11th edition MUTCD is an opportunity for the FHWA to make changes that benefit all road users—if they incorporate advocate feedback. Some proposed changes with potential include an update to the notorious 85th percentile speed standard, a decision on colorful crosswalks, and improvements for pedestrian crossing times. However, although these proposed changes might look good on paper, the revised MUTCD will likely leave most existing road networks as dangerous as ever.
85th percentile standard
While there’s no shortage of examples of the MUTCD placing the high-speed movement of cars at the top of the transportation hierarchy, there’s perhaps no greater example than that of the 85th-percentile speed standard. This standard sets what the National Transportation Safety Board calls a dangerous precedent for determining speeds: out of 100 drivers, the 15th fastest driver sets the speed limit.
The intent behind this is to lower the difference in speed between the fastest drivers and the slowest, with the idea being that the cause of crashes is the difference in speed, not speed itself. But this flawed logic ignores that as speed increases, the probability of fatalities for vulnerable road users increases exponentially. Blanket application of the 85th-percentile speed to arterials across the country has helped create the current crisis of pedestrian injuries and deaths—the majority of which now occur on state DOT-owned roads.
In the proposed edits for the new MUTCD, the 85th-percentile standard would be redesignated to a “guidance.” While that sounds better, this does not address the fact that unsafe roads in compliance with the new guidance would still be dangerous by design. Without providing engineers with safe design standards (like standards for road diets, raised crosswalks, chicanes, and narrower lanes), it would be impossible for this minor change to undo the speed status quo. The existence of the 85th-percentile rule is proof we know people will drive as fast as they feel comfortable. By softening the standard to a guidance, the MUTCD still fails to address design. State DOTs would still be responsible for choosing where to implement the rule on their roads, and without a change in standard practice or culture, it’s unclear what effect this change could actually have.
Pedestrian crossings
There are plenty of other standards in the MUTCD that foster dangerous design. Pedestrian volume per hour during “peak hours” is a main determining metric of what warrants a pedestrian signal at an intersection or midblock crossing. But peak hours focus on peak times for vehicular traffic, and what might be peak hours for a driver can be the worst, most uncomfortable time for a person to attempt to cross a busy roadway. Worse still, the National Highway Traffic Safety Administration’s FARS data has consistently shown that the deadliest hours for pedestrians are often well outside of what’s considered “peak.”
A graph from the FHWA describing pedestrian fatalities by hour from 2006-2020. Credit: FHWA
This leads to a deadly feedback loop that works against the most vulnerable—if the road feels unsafe or inconvenient to cross, no one will attempt to use it except for those with the fewest options. Hostile design makes it nearly impossible to safely walk the span of a roadway to reach services when you have to contend with multiple lanes of high-speed traffic.
Just as people are more likely to drive on a wide, comfortable roadway, they’re more likely to walk on a sidewalk that feels safe. However, some MUTCD-compliant designs are so dangerous that cities feel the need to give their pedestrians bright red flags just for them to cross the road—an ineffective solution to a design problem.
Like with the 85th percentile standard, the 11th edition shifts pedestrian volume per hour warrants from a standard to a guidance, and tinkers with other technicalities. Some changes are good, and could even result in longer, safer crossing times or more flashing pedestrian crossing beacons. But even if the proposed changes are adopted, they lack teeth. DOTs would be left to their own devices to enact the changes, and they could still point to the guidance as reason to not install a crossing.
MUTCD compliant crossing in Knoxville, Tennessee. Would you feel safe crossing here? Source: Google Maps
Colored crosswalks
Research has shown that bright, colorful crosswalks and intersections make streets safer by drawing drivers’ eyes to the pedestrian crossing with the added benefit of creating more vibrant streets. However, since 2001, the FHWA has officially discouraged communities from using art at crosswalks and has consistently sent letters to cities ordering them to remove their art, or lose federal funding. FHWA justified their requests by claiming colorful crosswalks do not enhance safety, despite the fact that the agency has yet to conclude research on the topic. There is no apparent plan for public access to the research underlying the next edition’s ruling.
Colored crosswalks, like the rainbow crosswalk above, can be an attractive way to signal for drivers to stop and look for pedestrians. The right design can also signify community and belonging. Photo source: Long Beach Public Works
If text in other sections of the proposed changes is any indication, the FHWA has an interest in maintaining total uniformity in crosswalks for the benefit of automated vehicles. Automated vehicles (AVs) see the world through artificial intelligence-based machine vision and have difficulty adapting to the dynamic scenarios common to urban environments, even if these are the same scenarios that are more likely to draw the attention of human drivers.
AVs benefit from road environments with minimal variety and maximum contrast, and the 11th edition will likely propose prescriptive changes that would require road markings to be wider, brighter, and more frequent, explicitly for AVs. It is unclear why the FHWA seems willing to offer new concessions for vehicles that have so far failed to provide a proven safety benefit, but remain unwilling to allow changes that are proving to make vulnerable road users safer.
The bottom line
With speed and throughput of cars as the leading success metric, the so-called best practices outlined in previous editions of the MUTCD have increased the viability of cars at the expense of all other road users, including public transit, pedestrians, and cyclists. We are glad to see changes that allow for safer street design, but in the face of rising pedestrian fatalities, the 11th edition of the MUTCD doesn’t go far enough.
FHWA has made some progress on prioritizing safety over speed in other recent guidance. However, when it comes to the definitive guide to traffic control, making minor revisions in the midst of a crisis of fatalities that seem to increase year after year is a failure to meet the moment. We hope the extra time spent on the new edition has gone toward creating a safer MUTCD.
Residents of Fowler, CA assess current conditions along State Highway 99 and Golden Street Corridor, which did not receive a Reconnecting Communities grant in the first round of funding. Photo credit: CalWalks and safeTREC
In March 2023, USDOT announced the initial 45 awardees for the opening round of the Reconnecting Communities Pilot Program. This first-of-its-kind program represents the start of a new series of initiatives that confronts the legacy of inequitable infrastructure projects in the US and will (un)pave the way for the Neighborhood Access and Equity Grant program created in the Inflation Reduction Act. But to meet the needs of communities, the USDOT needs to expand its vision and scope of funds available.
This illustration was produced for T4America by visual artist Jean Wei. IG/@weisanboo
435 communities applied for the first round of the Reconnecting Communities Pilot Program (RCP), despite the fact that only $195 million in funding was available. To put this in perspective, the Multimodal Project Discretionary Grants (MPDG) program received about the same number of applications for nearly 15 times the funding ($2.85 billion). If those numbers are anything to go by, we can see that the demand from communities to fix divisive transportation infrastructure far outstrips what even the largest discretionary grant programs could garner. This is especially true when formula funding, which dwarves discretionary funding, continues to perpetuate the very issues the Reconnecting Communities Pilot seeks to resolve.
That demand comes from a diverse array of applicants. The Reconnecting Communities Pilot program received applications from 51 states and territories, from smaller communities like Phenix City, Alabama, home to less than 40,000 people, to large cities with millions of residents like Philadelphia and Los Angeles.
With that variation in size came variations in resources. We know some of these project applicants, like the grant-winning recipient Reconnect Rondo, hosted accompanying websites and social media pages managed by activist community partners, boosting the strength of application narratives. On the other end of the spectrum, two individuals applying to the program accidentally gave their own names instead of the name of the city that the grant would apply for, a sign of the difference in preparedness for the competitiveness of this grant program.
Who were these applicants? USDOT has done great work releasing outcome information in this first year of the program, and we acknowledge their efforts to release the name and state of aspiring applicants. However, we are still missing crucial information to assess how funding has been distributed and lack information on 21 applicants. T4A has requested more data from USDOT, including the individual census tracts used to assess each community as disadvantaged according to the Justice40 initiative.
In the meantime, we conducted an analysis of every applicant at the county level using data from EJScreen, the EPA’s Environmental Justice Screening tool. Though this method has limitations, it allowed us to learn more about the applicants, even those who did not receive awards and a profile from USDOT, across a variety of environmental and social measures. See the below map of applicants, with successful applicants marked in green and unsuccessful ones marked in red:
While it may be difficult to quantify the social costs of divisive infrastructure, the costs to physical health remain apparent. Including those who did not receive an award, RCP applicants had on average lower air quality, higher risk for cancer, lower income, and higher rates of unemployment than the typical American community according to EJScreen data. Many of these communities are severely marginalized, and may only be able to heal if we increase RCP funding to meet demand.
Among these many applicants was Stillwater. Stillwater is a smaller city in Oklahoma, and like many communities in the United States, highway infrastructure has left its mark on the community. Two state highways cut through the city’s downtown, creating dangerous barriers to people walking or biking in the city. In an attempt to undo the damage and support its status as a growing active transportation hub, Stillwater applied for an RCP grant to plan for a new pedestrian bridge over State Highway 51 and create a new active transportation map to connect the city and increase protections for vulnerable road users.
Current conditions along State Highway 51 place pedestrians dangerously close to fast car travel. Source: Stillwater, OK Corridor Plan
Further west, Fowler is a small agricultural city in California. CA State Highway 99 and Golden State Boulevard cuts diagonally across Fowler, preventing access to almost half of the city. The community applied for an RCP grant to better connect the community across the highway. Fowler is located in Fresno county, which has some of the worst air quality and pollution in the nation.
Edinburg, Texas applied for a planning grant to convert a high-speed, arterial-style road into a Complete Street. The road, which requires children to walk across a nearly 80-foot-wide unsignalized crossing, runs adjacent to neighborhoods, a playground, and an elementary school. According to EJscreen data, Edinburg’s county has some of the country’s worst cancer-causing air pollution and has a higher proportion of people earning under the federal poverty line than 84 percent of the country. 101 of 113 census tracts in the county were identified as disadvantaged according to Justice40 metrics.
The outsized demand for the Reconnecting Communities Pilot and widespread community interest in the program’s unique mission is a sign that the pilot has been a resounding success. But with current levels of funding, the RCP will not be able to meet the massive scale of community need. Instead, USDOT should increase funding for the Reconnecting Communities Pilot and the Neighborhood Access and Equity Program to meet this historic demand.
But competitive grant programs cannot be communities’ only recourse to restore community links. Funding for the Reconnecting Communities program would have to expand by an order of magnitude to meet the demand from hundreds of qualified communities. The approach to funding these types of projects needs to change on a system-wide level, and there’s no better way to fund these projects than through formula dollars. Almost 90 percent of Highway Trust Fund funding goes to formula programs, and states have vast flexibility in how formula dollars could be used. Most, if not all, reconnecting communities projects would already be eligible under existing formula programs. States should take the opportunity to use formula dollars to reconcile the legacy of damaging transportation infrastructure, rather than repeat past mistakes.
Eligible communities have an opportunity to apply to Smart Growth America’s Community Connectors program to help prepare for the next round of competitive Reconnecting Communities grants and other funding opportunities.
California’s transit agencies are bracing for a fiscal cliff, a real threat facing communities nationwide. If left unresolved, it could lead to drastically reduced service, cutting people off from jobs and services. But California’s legislature is preparing to vote on a budget that will do nothing to stop it.
Update 6/14: Governor Gavin Newsom has released a new budget, whichwill keep CA transit agencies solvent in the short term.
Transit riders wait to board a Bay Area Rapid Transit (BART) train. Wait times and crowding will likely skyrocket if Governor Gavin Newsom’s budget passes unchanged. (Wikimedia Commons)
What is a “fiscal cliff”?
We wrote about the transit fiscal cliff issue back in January, but here’s the gist. When the COVID-19 pandemic started in 2020, many people stopped riding transit, so transit agencies saw a massive drop in their fare revenues. Transit operations depend on fare revenue to operate essential services, so Congress approved two rounds of emergency funding to keep agencies operating through the pandemic. The plan worked—agency operating funds remained solvent.
But over the past couple years, as that emergency funding dried up, fare revenue has not recovered enough to replace it. Ridership has increased, but not at a fast enough pace to cover all the costs involved with transit operations. For many agencies, it’s only a matter of time before they run out of money and need to cut their services.
The fight to save transit in California
According to a survey done by the California Transit Association (CTA), 72 percent of CA agencies face fiscal cliffs. Earlier this year, hundreds of transit agencies and allied organizations asked for $6 billion over the next five years to prevent major service cuts and regrow their ridership base by improving service. They also suggested several ways that the state could fund such an investment.
The governor’s budget disregarded all of their recommendations, instead shifting only $2 billion away from transit capital projects to cover operating costs. Lawmakers have pointed out that this move is the worst of both worlds—it will force service cuts by short-changing operating support and it will defund major construction projects, forfeiting federal support.
The consequences of this proposal would be catastrophic. San Francisco’s Muni system would need to cut at least 20 bus lines. Bay Area Rapid Transit (BART) would see “trains only once an hour, no trains on weekends, no trains after 9 p.m. on weeknights, reduced service to San Francisco International and Oakland International airports, some stations closed, and entire lines potentially shuttered.”
72 percent of transit agencies statewide would face similar cuts. Unless the state acts soon to rescue its transit agencies, millions of Californians will be left stranded, disconnected from education, medical care, food, and jobs—especially low-income people and marginalized communities.
Highway-transit double standard
Let’s take a step back from this debate to examine its premise. California spends around $21 billion a year on roads while providing a paltry $2.6 billion to the state’s transit agencies—a more highway-slanted ratio even than what the federal government allocates. There is a transit fiscal cliff, but no “highway fiscal cliff.”
So while California hems and haws over $6 billion in transit funding over 5 years, it is more than happy to spend tens of billions per year expanding highways, contradicting its own policy that acknowledges the futility of highway expansions and aims to reduce driving. Governor Newsom’s current plan would not only short-change transit operations, but also leave up to $6 billion in federal transit capital dollars on the table. Highways are rarely forced to make such choices.
California could temporarily transfer some of these highway dollars from highway expansion projects to patch this temporary gap in transit funding. The federal government makes it really easy to transfer highway dollars to transit projects, so why isn’t California doing this? Why are they making transit agencies choose between capital and operations when highways get both, carte blanche?
Promises broken
California Governor Gavin Newsom has sworn up and down that he is a champion of climate action and equity, but words are cheap. His decision to gut transit service betrays those values.
Gutting transit is especially contradictory to commitments on equity. Americans who are lower-income, Black or Hispanic, immigrants, or under 50 are especially likely to use public transportation on a regular basis, Pew Research Center data shows. Gutting transit hurts California’s most vulnerable communities. And at a time of historically high cost of living in California, this is particularly harmful and puzzling.
Transportation for America is intent on holding leaders accountable for the promises they make about transportation decisions. Minnesota is keeping their promises. California is not. Governor Newsom cannot credibly call himself a climate champion or claim to be addressing equity or cost of living challenges while continuing to defund transit. It is up to all of us to call him out for it.
T4A Director Beth Osborne joined Nick Josefowitz of SPUR to discuss California’s transit crisis on Volts. Listen to the podcast.
Minnesota made waves last week by passing a landmark transportation spending bill that will fund transit expansions and passenger rail service while reducing transportation emissions. The law, which was passed by razor-thin margin, serves as a blueprint for transformative transportation legislation.
Master class in political will
Minnesota passed ambitious climate goals in 2007, as many states were doing during that era. But as with other states, Minnesota had a difficult time following through with concrete actions to meet those goals.
But far from giving up or taking half-measures, Minnesota legislators are willing to risk their seats to make big moves. For example, Speaker of the House Melissa Hortman and Senate Majority Leader Kari Dziedzic prepared and executed an extensive legislative agenda that included a law to move Minnesota to 100 percent clean energy by 2040. That bill provided transportation champions enough momentum to pass other transformational changes, including a new transportation funding agreement passed last week.
This rare, fast-moving legislative push was made possible by the work of advocacy groups like Move Minnesota. Even when there was no hope of passing things like transit funding and limits on vehicle miles traveled (VMT), they worked with climate-forward legislators to draft, refine, and advocate for the provisions that eventually made their way into this law. They encouraged legislators to start from a vision for what the future of transportation can look like and work from there, rather than start from a dollar figure. Then during the 2023 legislative session, they organized a diverse group of transit users and supporters to testify at Transit Equity Day-themed hearings in both the House and the Senate. This was a crucial move in building momentum for this law, bringing in the voices of educators, students, cultural and faith leaders, economic development advocates, transit service providers and union leaders, mobility and disability justice advocates, bikers, elected officials, and both local and national environmental and transportation policy experts.
Not only did Minnesota legislators lap other states that call climate a priority, but they did it with the slimmest of majorities: one seat in the Senate and six in the House. There was strong opposition from the minority, which panned the bill as “regressive taxes that hurt lower-income Minnesotans the most.”
The passage of this legislation is a perfect example of why building capacity and investing in champions is a critical step in sparking change.
What’s in the law?
At a glance, the new law passed by the Minnesota legislature provides:
The authority for Metro Transit to deploy non-police personnel to check fares and issue administrative citations.
$195 million to design and build the Northern Lights Express, a new passenger rail route that will operate between the Twin Cities and Duluth.
$150 million to erase a transit funding deficit in the Twin Cities region.
$300 million annually to build out and improve the Twin Cities region’s Bus Rapid Transit (BRT) system.
Means-tested tax credits for up to 75 percent of the cost on an electric-assisted bicycle.
$2 million for a pilot program to connect people experiencing homelessness or mental health and addiction issues to social services.
These provisions are funded by:
Increasing Minnesota’s gas tax by 5 cents/gallon by 2027 by indexing it to inflation. This provision will provide stable funding not only to transit and passenger rail, but the entirety of Minnesota’s transportation system.
Increasing the statewide sales tax by 0.25 percent to fund housing programs and projects.
Increasing the sales tax in the Twin Cities region by an additional 0.75 percent.
Imposing a $0.50 fee on deliveries over $100 in value.
It also requires that the Minnesota Department of Transportation (MnDOT) assess proposed highway expansion projects for consistency with their established greenhouse gas reduction goals, specifically by reducing the VMT on Minnesota’s roads. If MnDOT authorizes a project that increases VMT, they will need to offset the increased emissions by linking the project with a portfolio of other projects that reduce VMT by the same amount or more.
While the transit and passenger rail funding provisions are exciting, this portion of the law may have an even greater effect. Many states have passed climate laws, goals, policies, and mandates, but few get at the real drivers of transportation emissions like this new law. In fact, Minnesota and Colorado are now the only two states to enact such rigorous processes to reduce transportation emissions. Some states enact ambitious goals, but fail to follow through.
The actions of Minnesota’s slim majority stand in stark contrast with the 117th congress and Biden administration, who have taken a ham-handed approach to curtailing transportation emissions. Despite passing historic transportation investments through the IIJA, nationwide transportation emissions could still be poised to drastically rise in coming years. And when the Biden administration released a memo that merely suggested transformational change to transportation spending, they quickly cowed to Republican pressure and rescinded it.
Perhaps climate forward legislators in the states, federal government, and even the Biden administration could learn from MN legislators and move forward with transformative climate action.

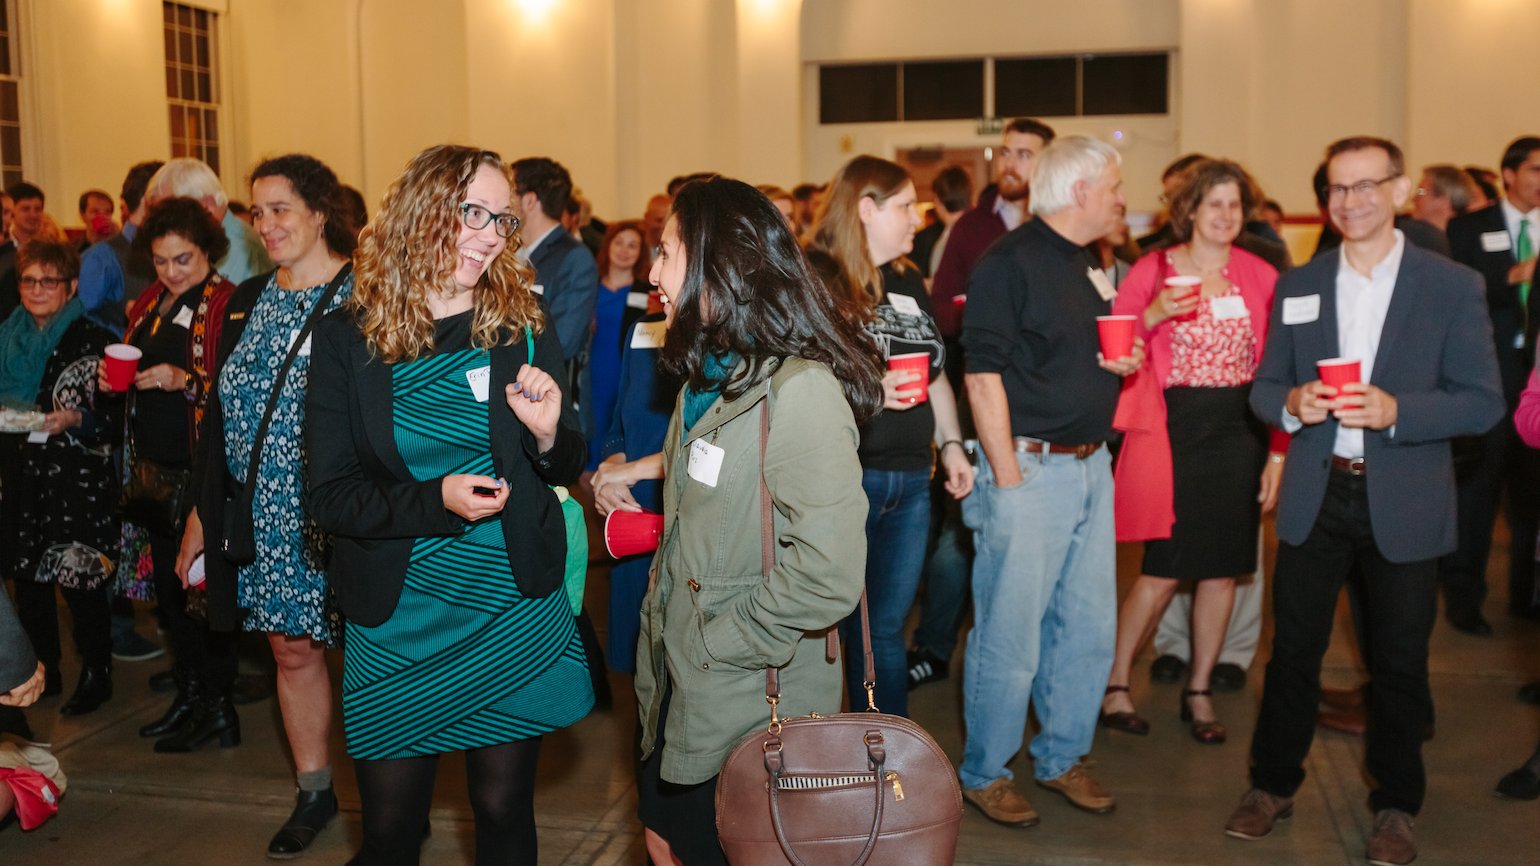
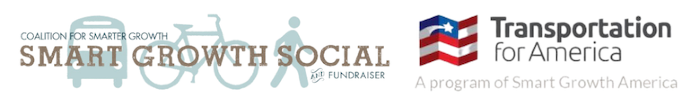


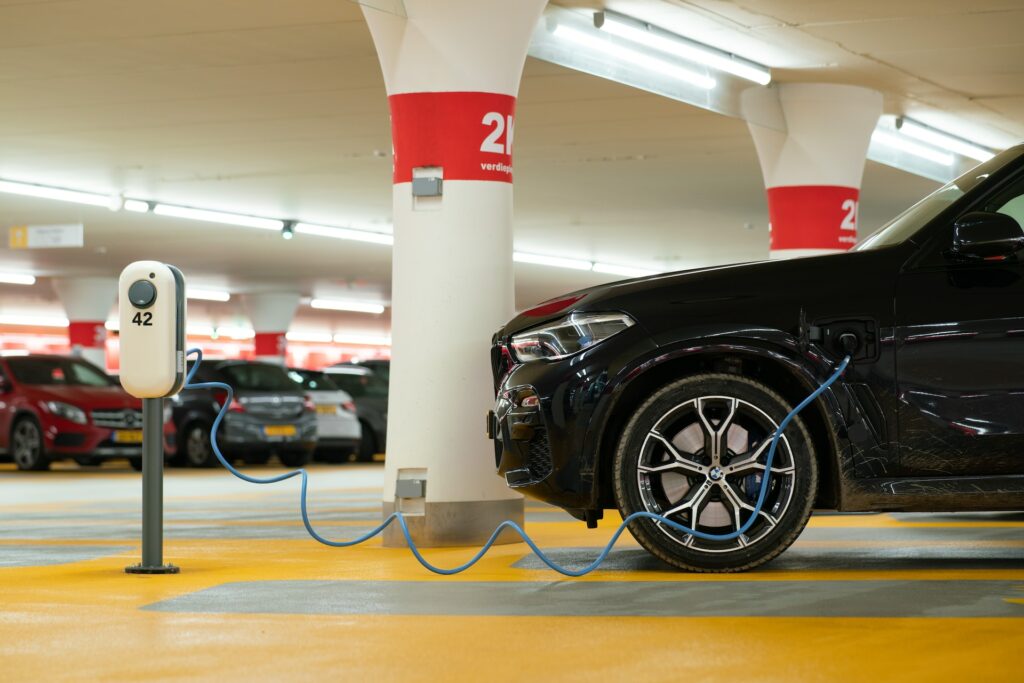
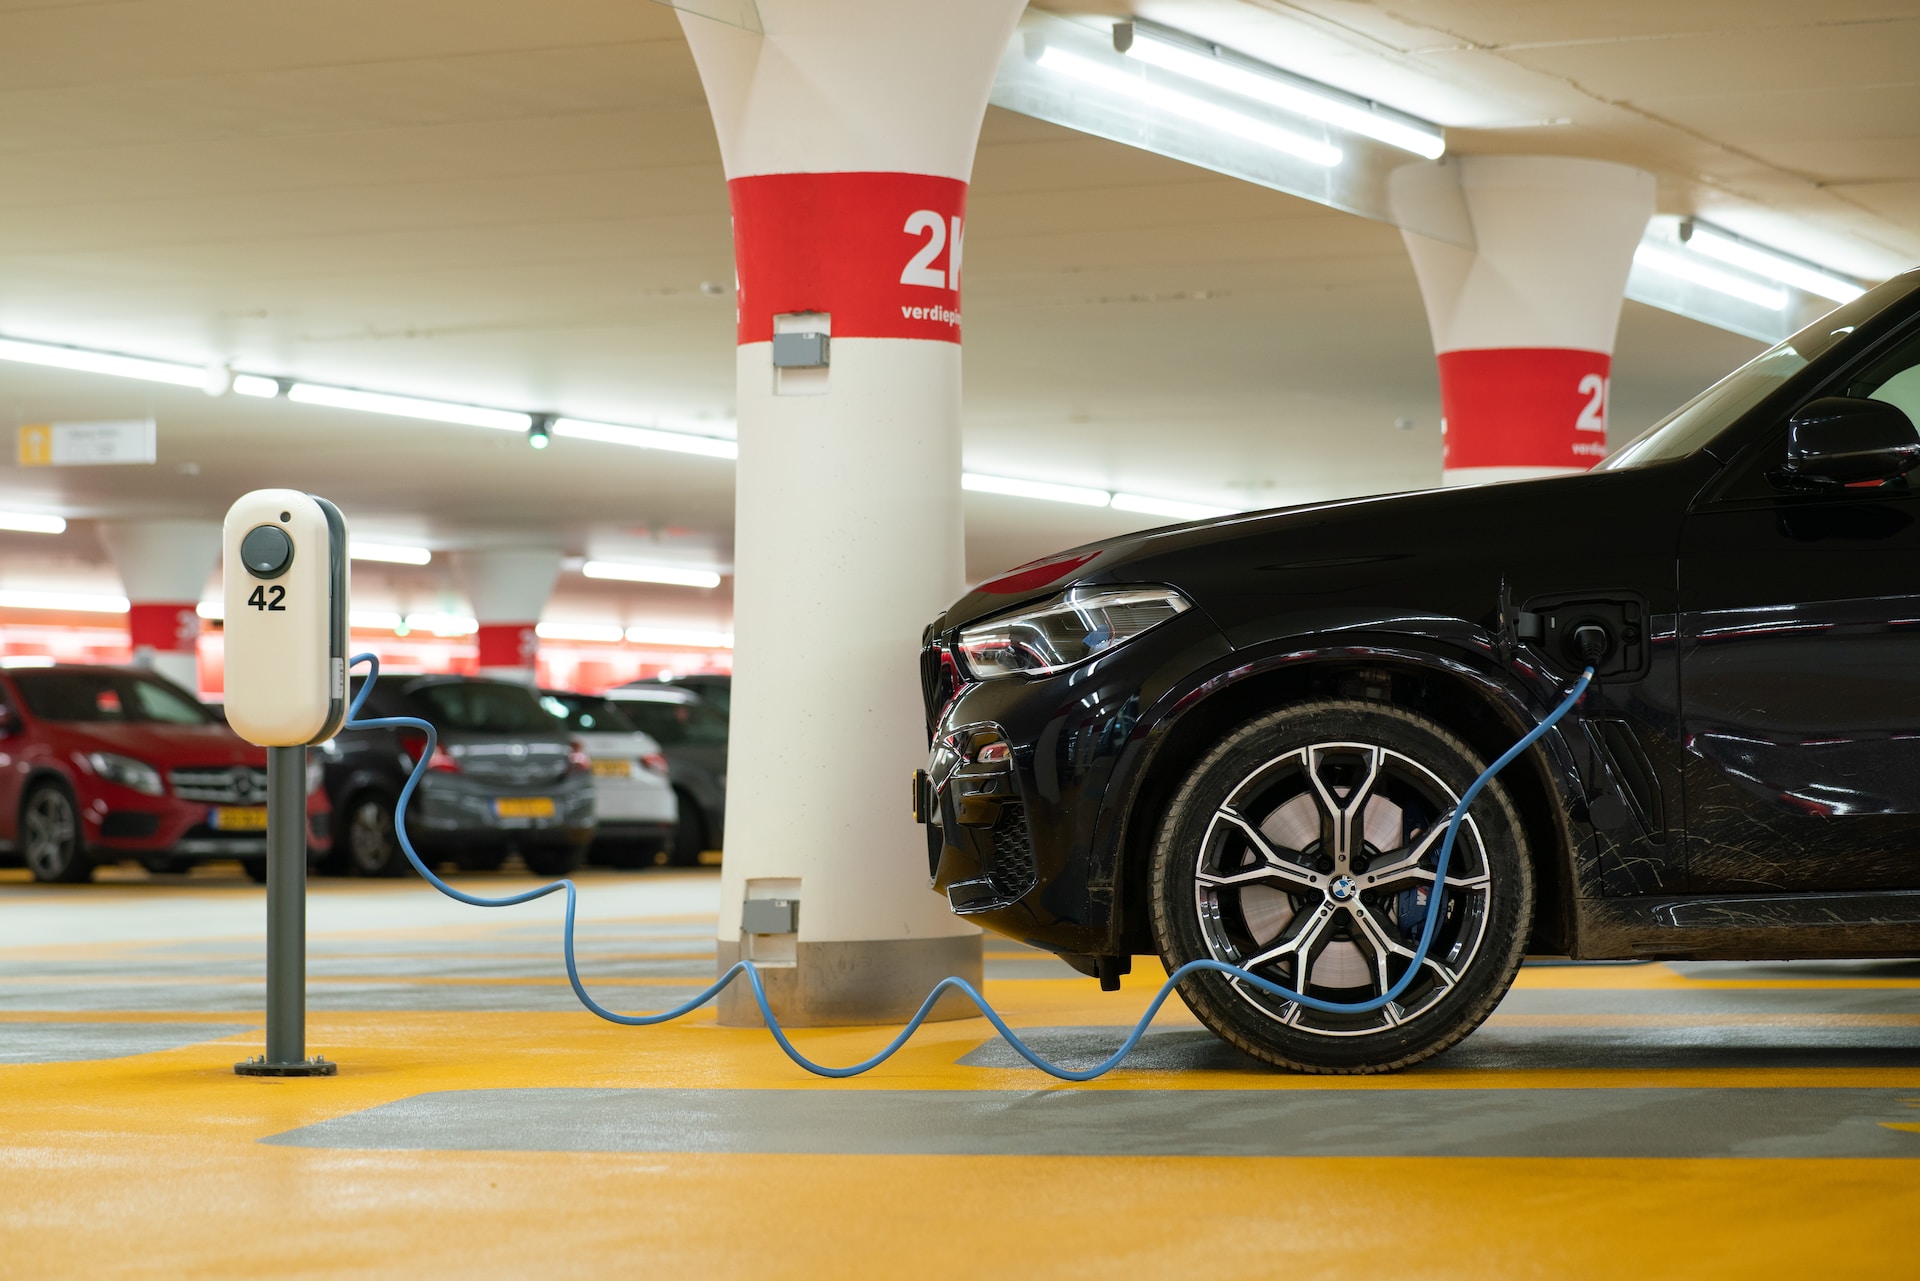

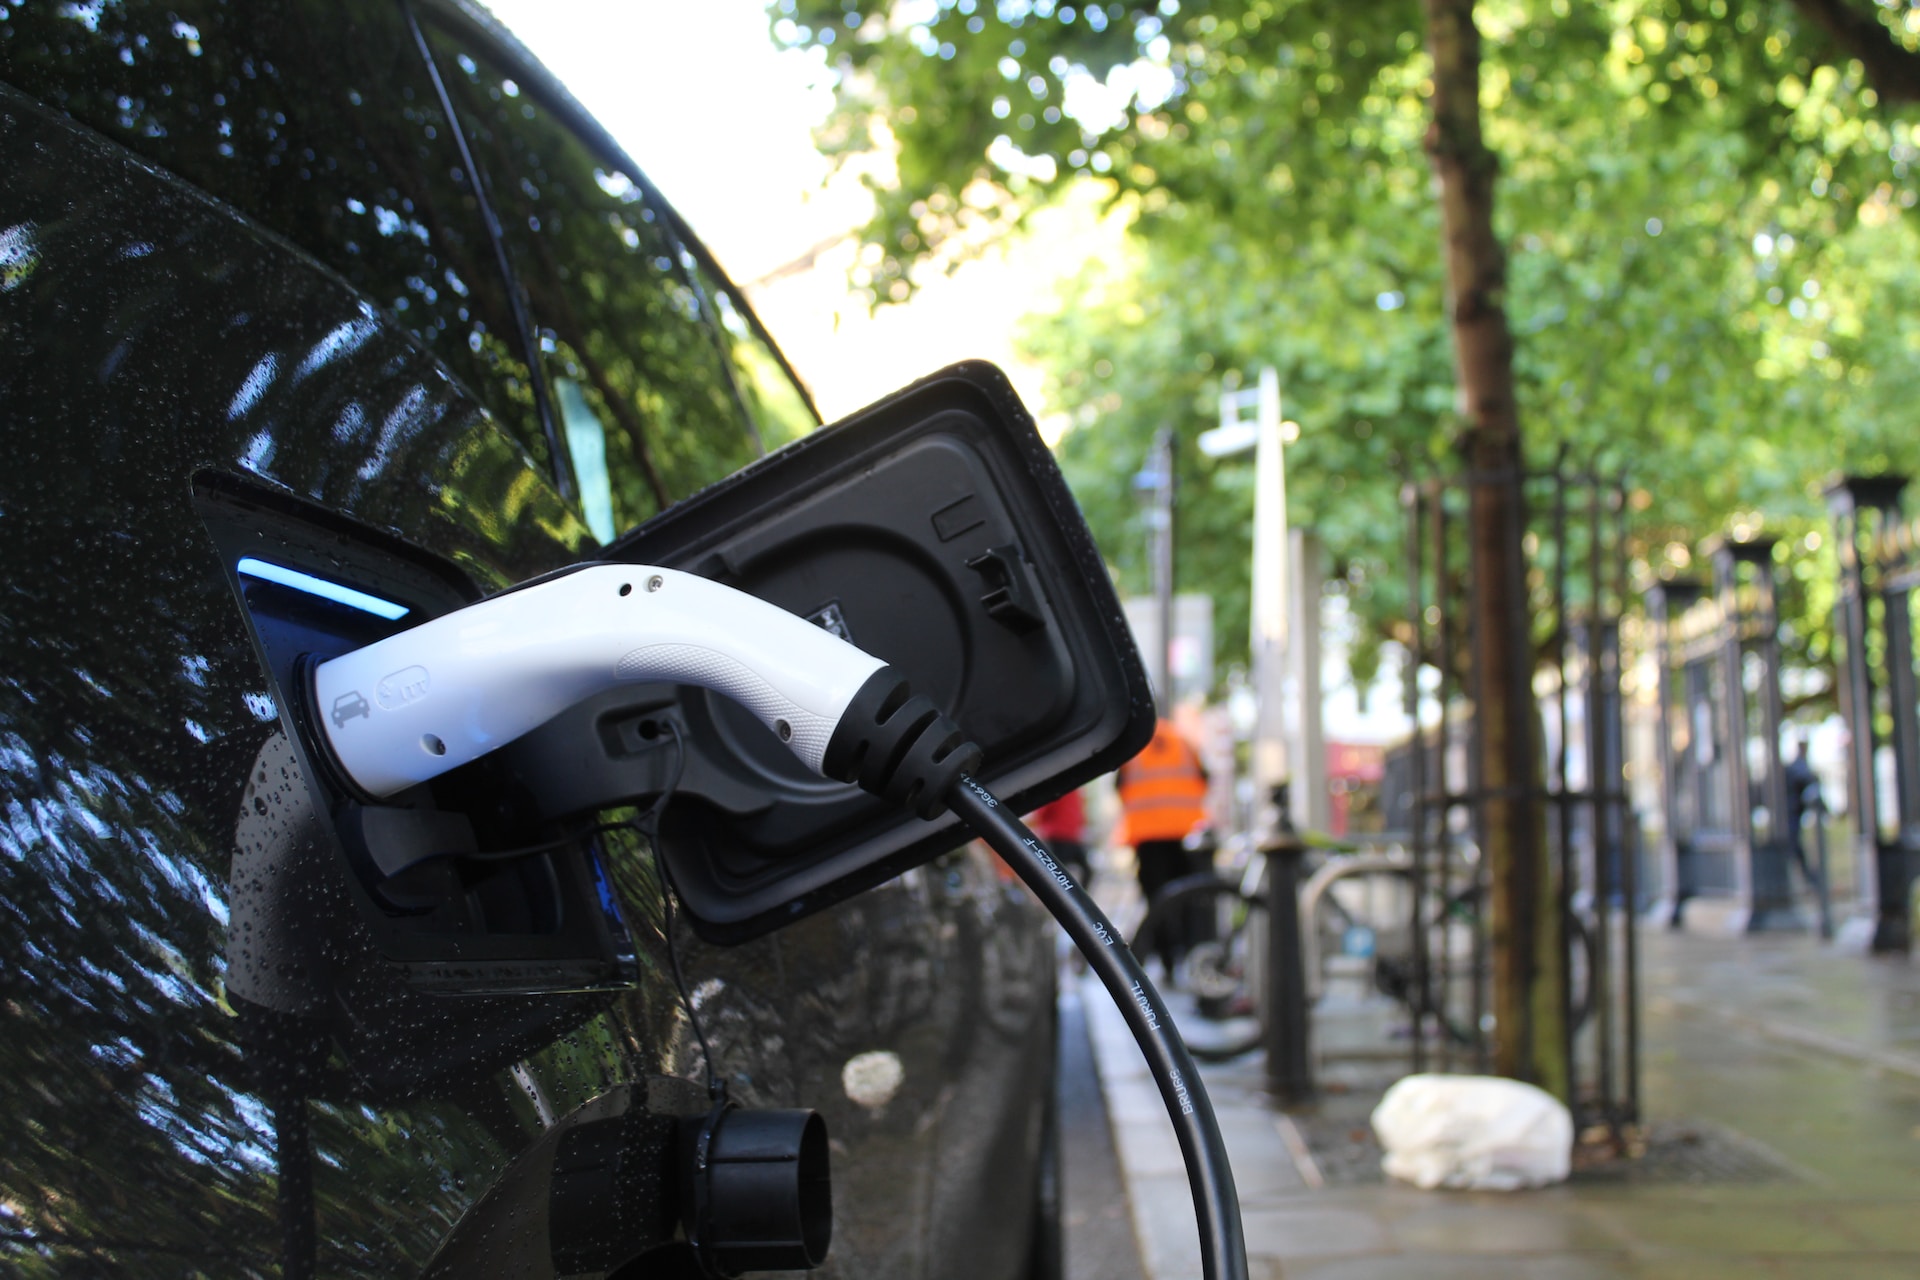
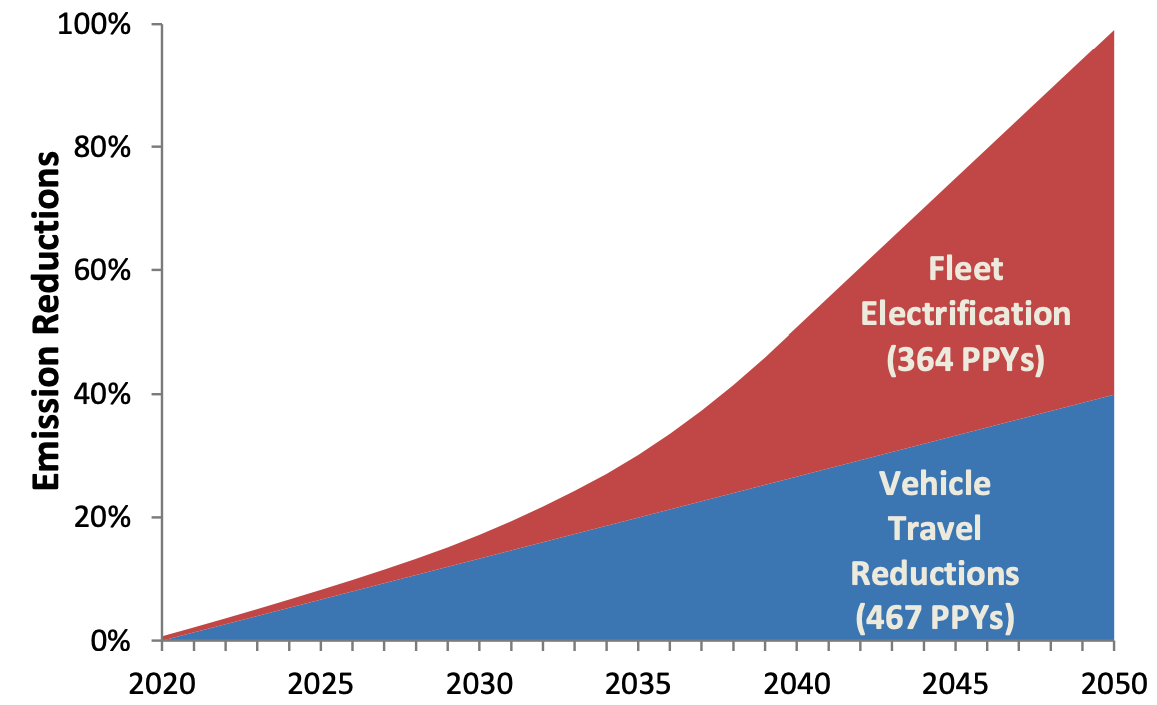
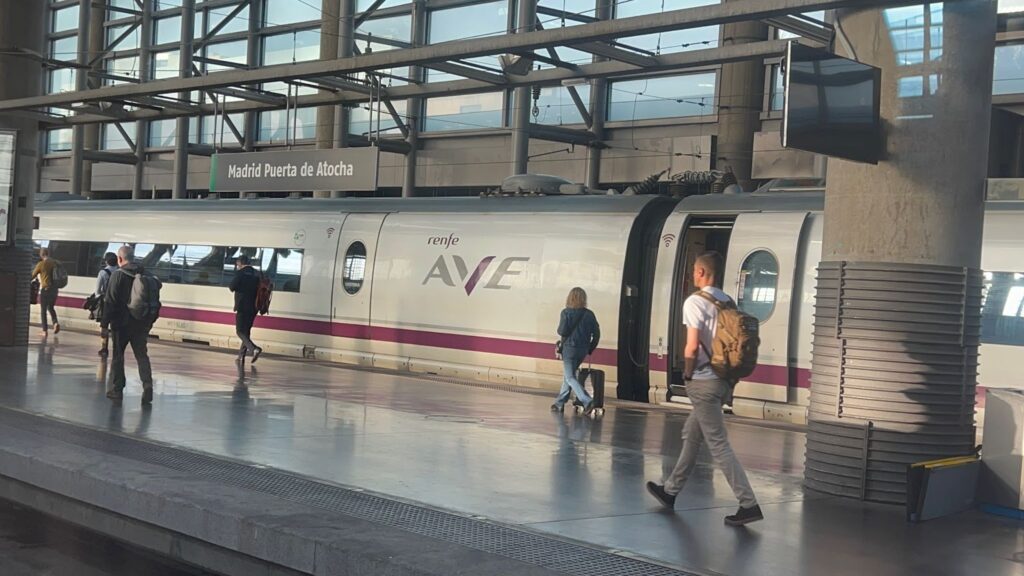
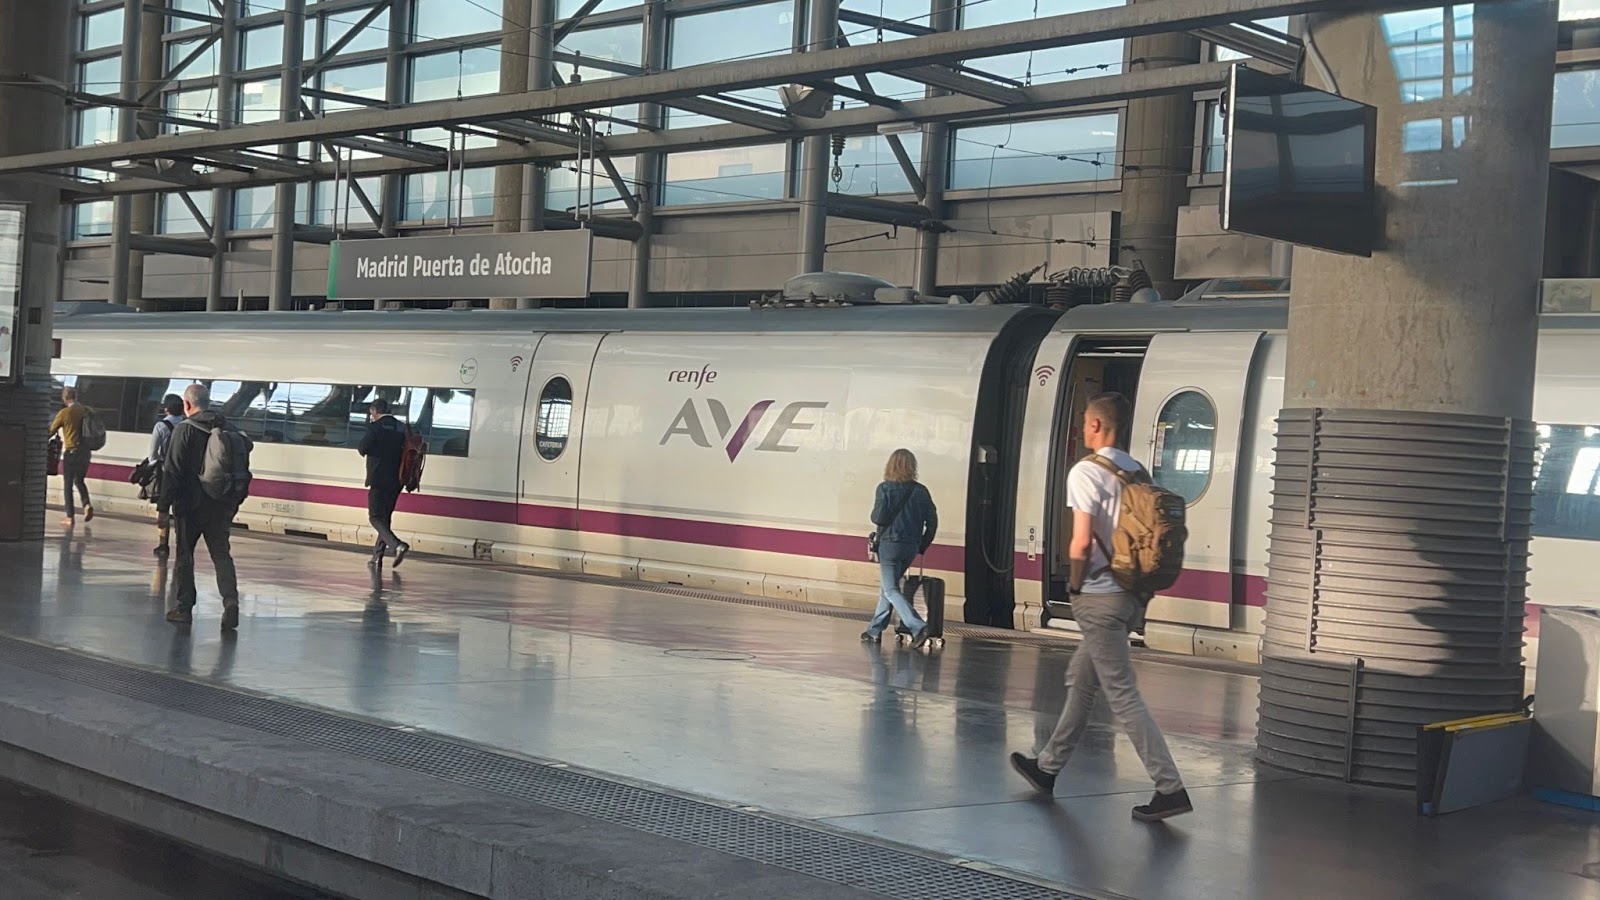
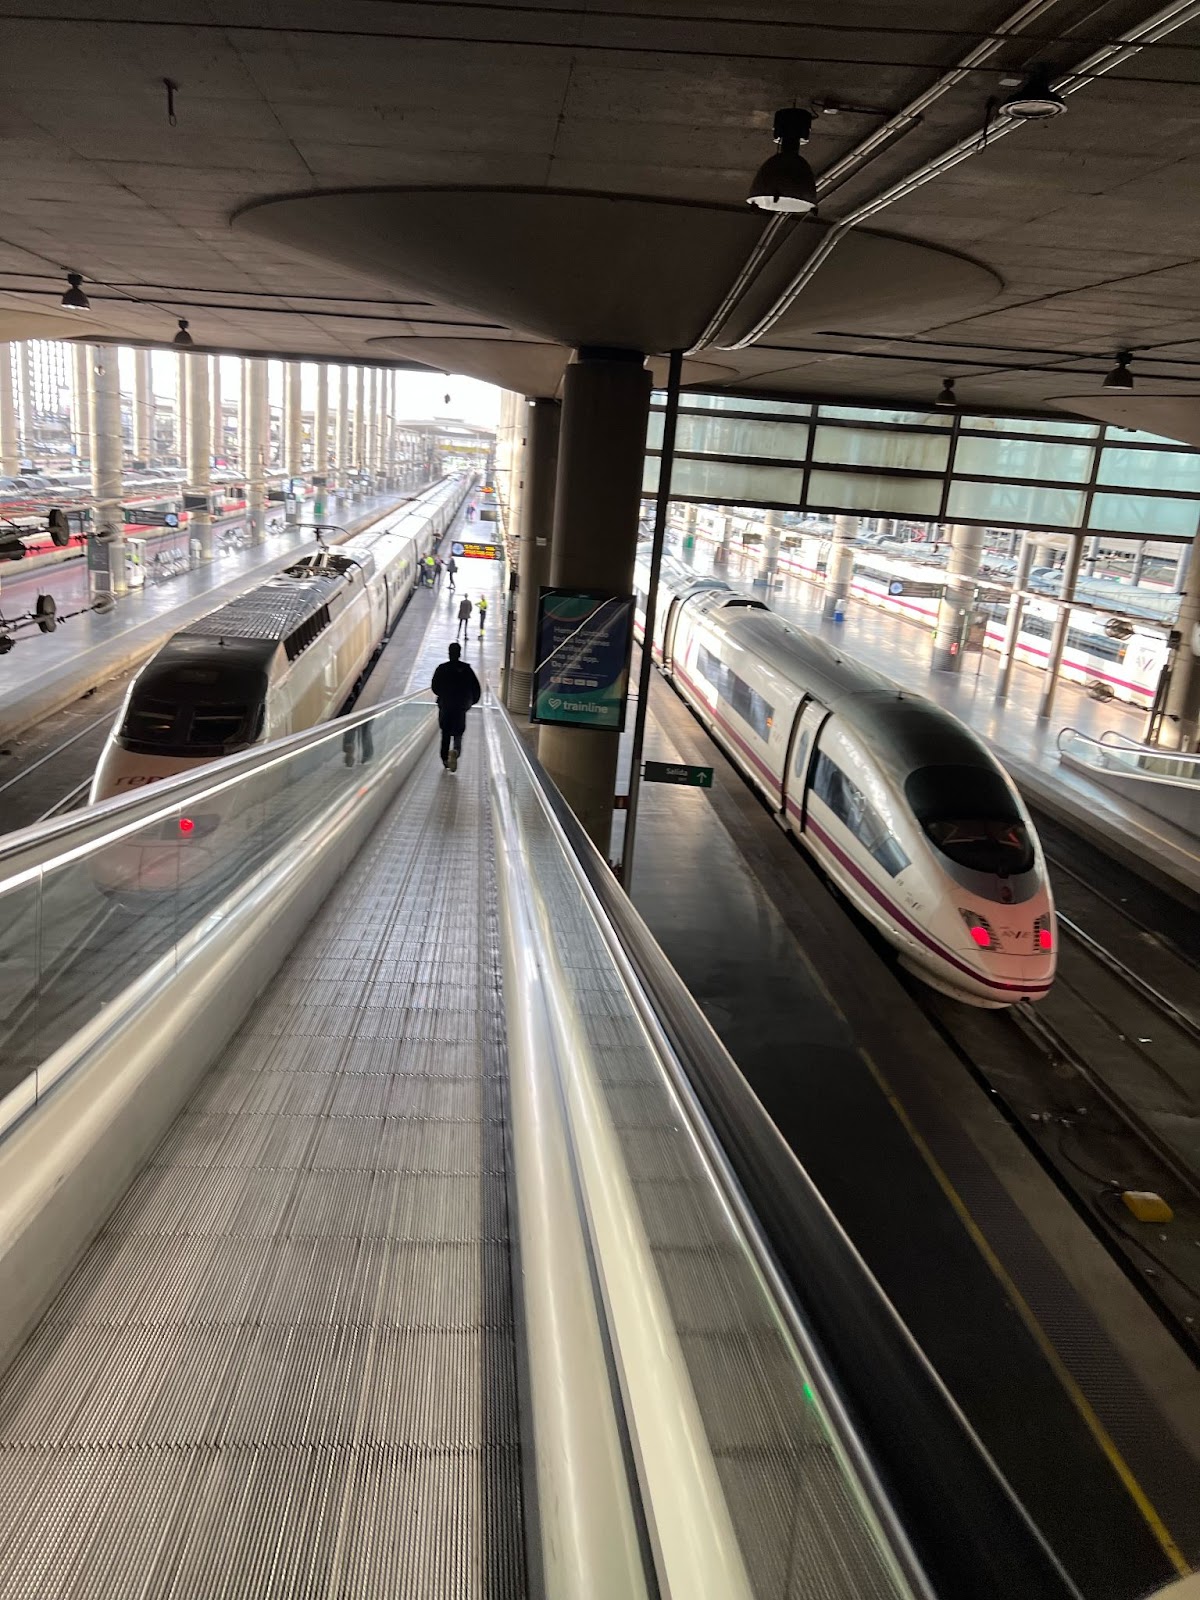
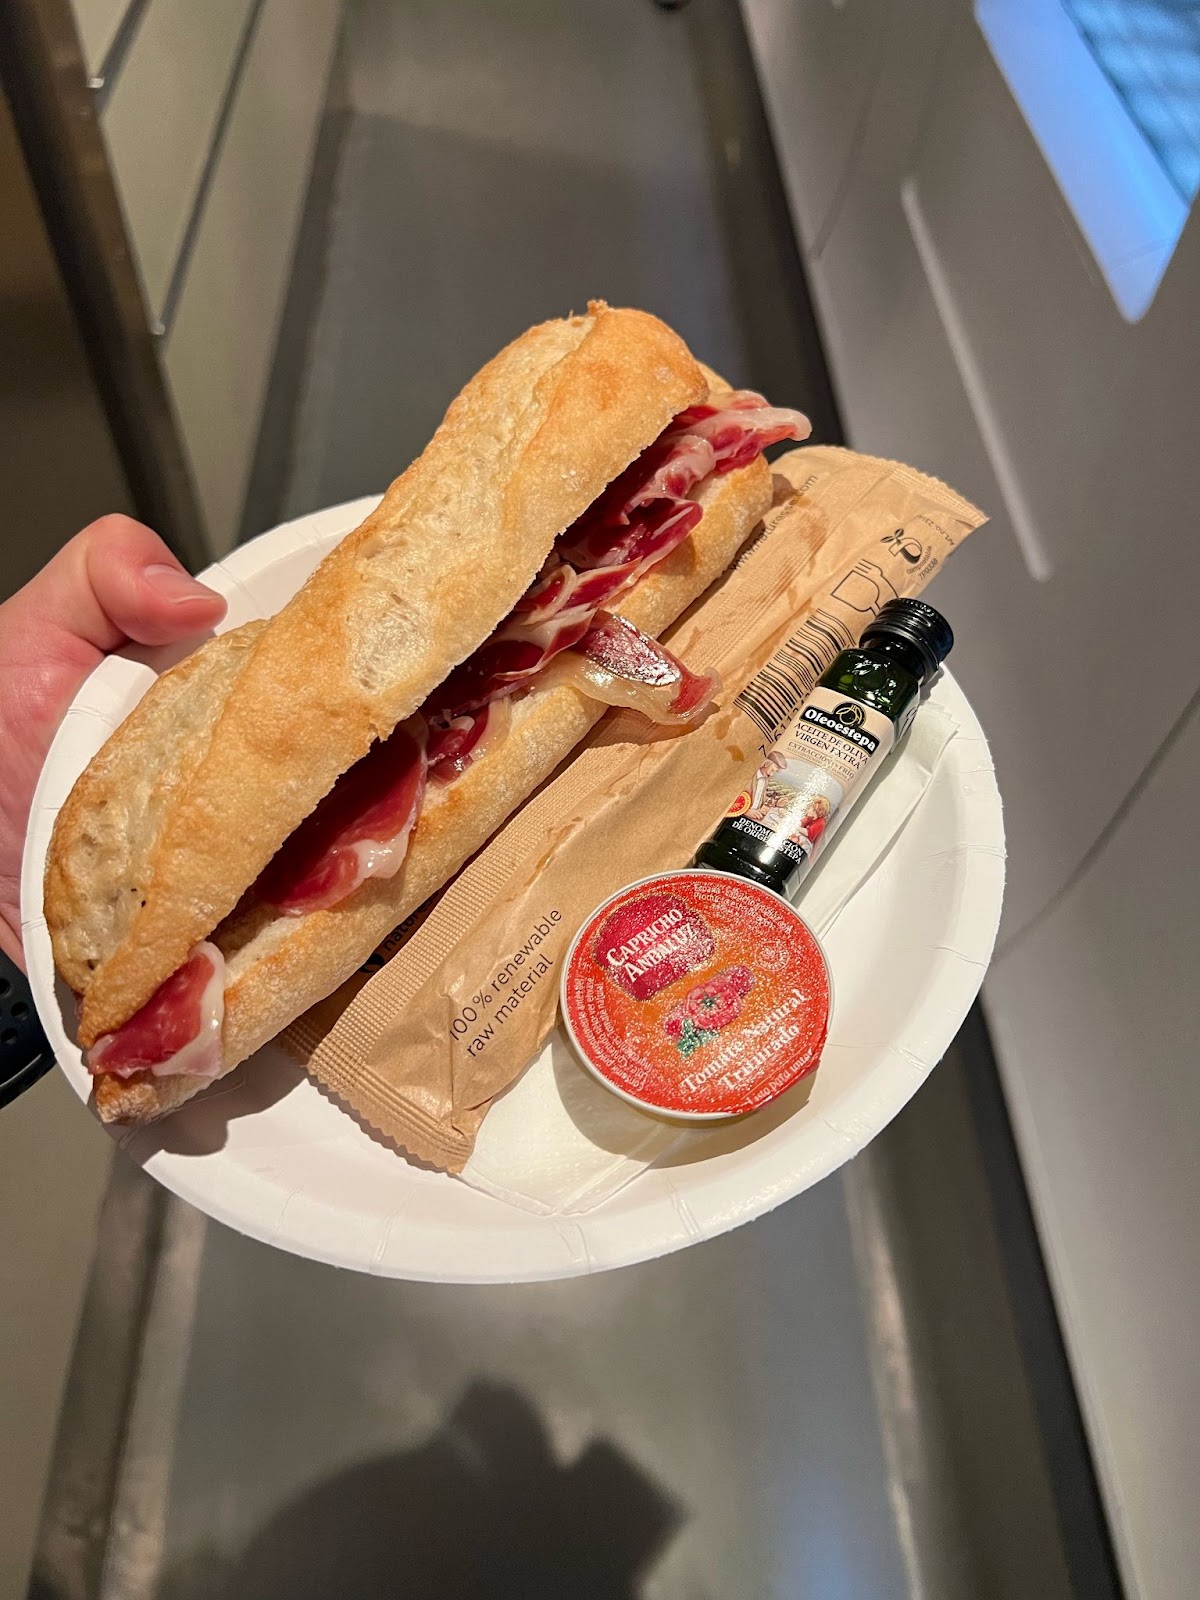
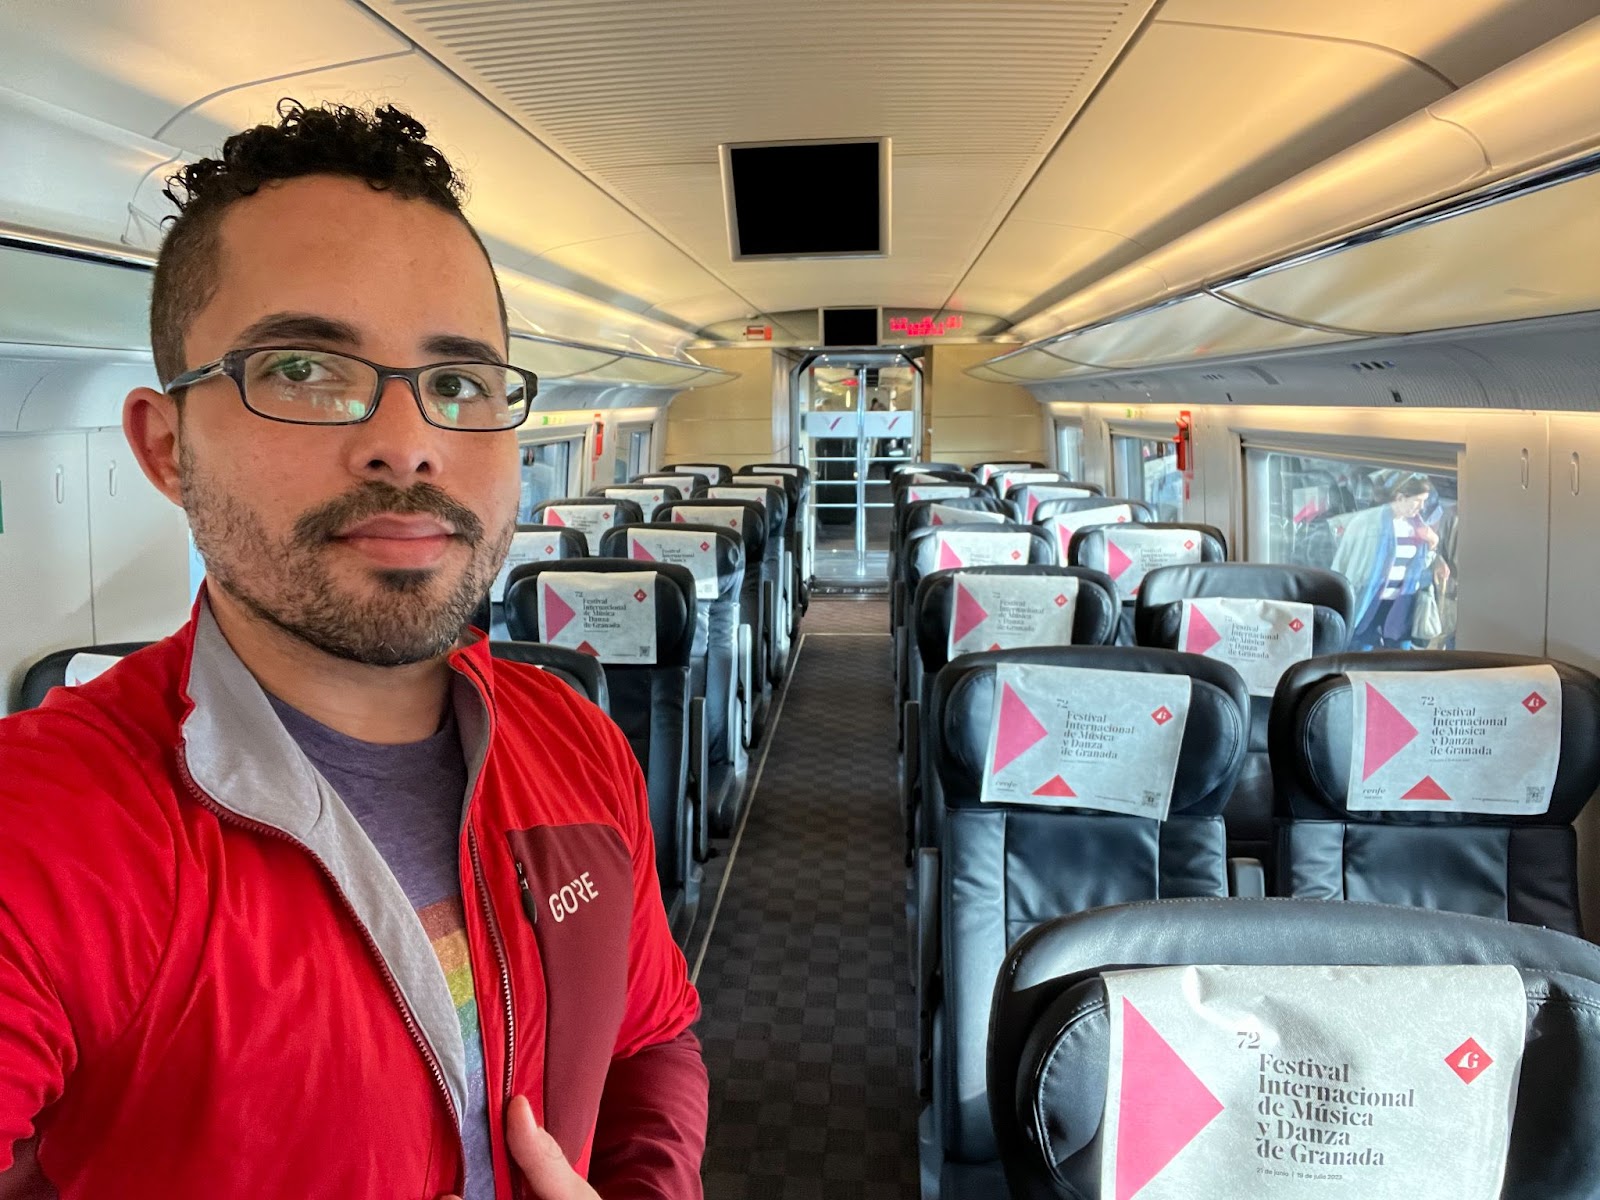

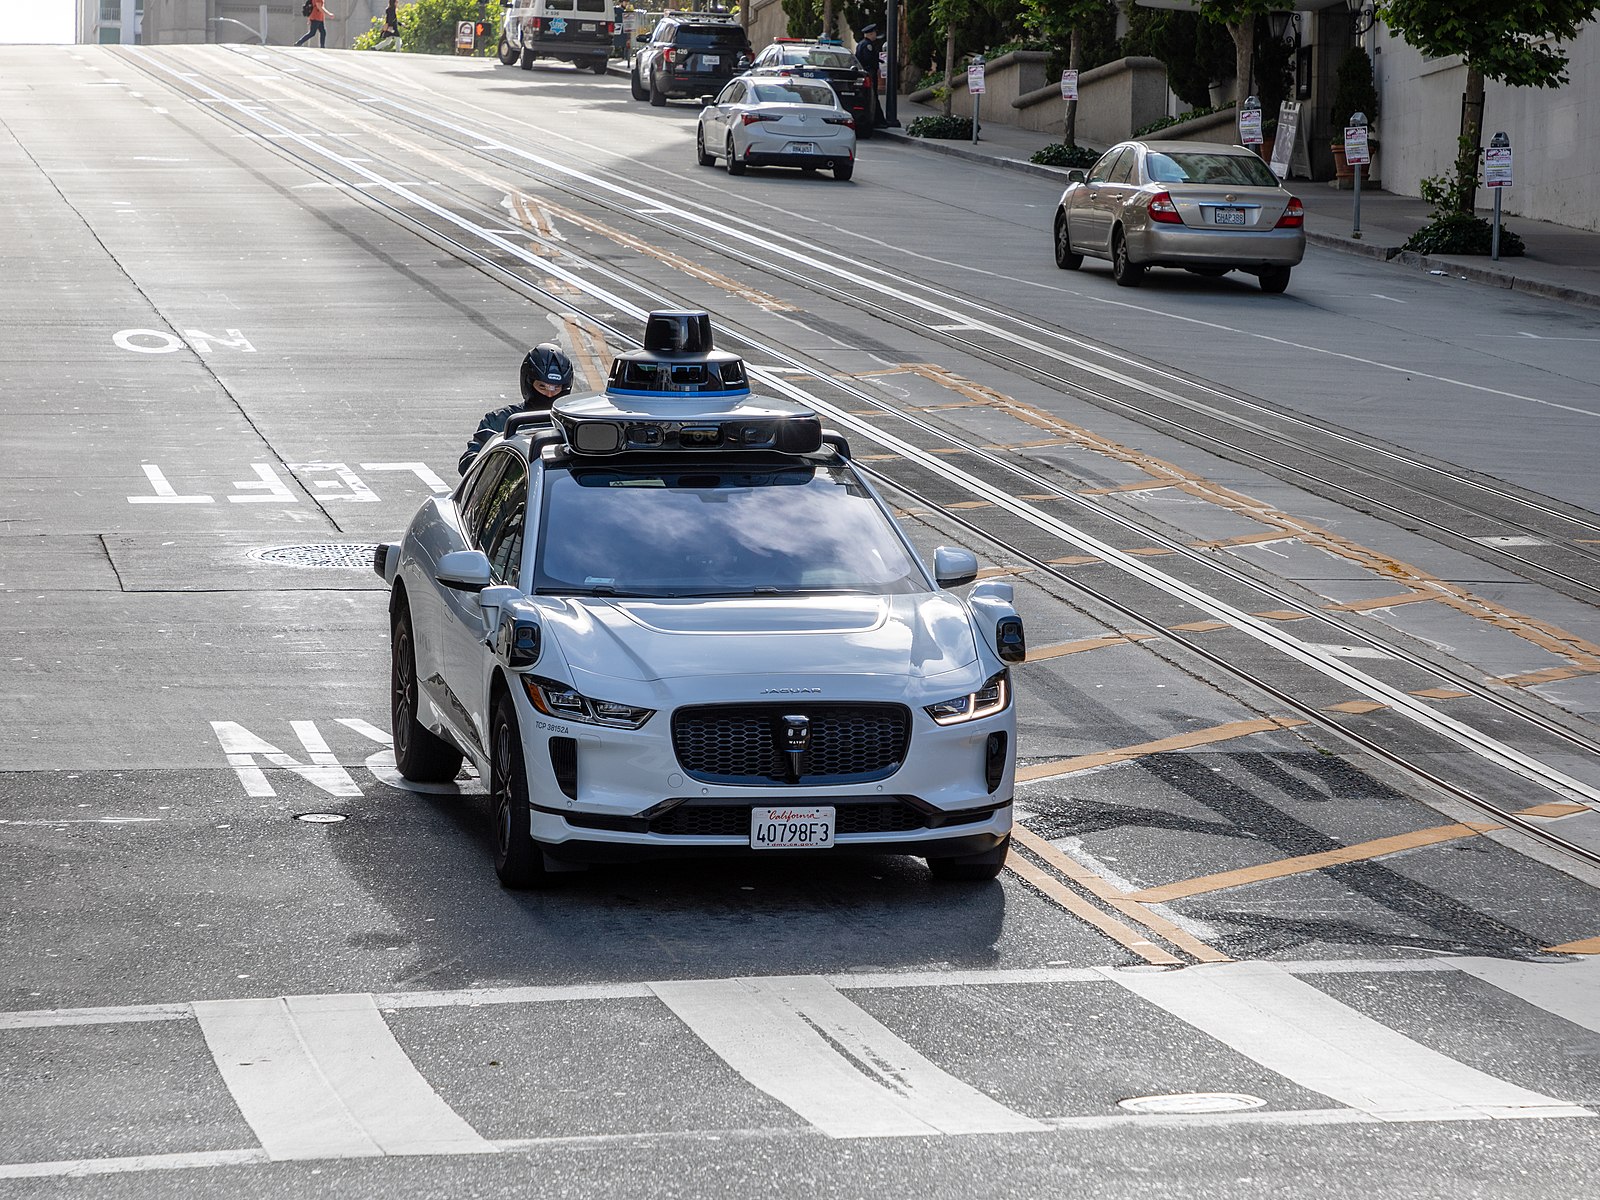

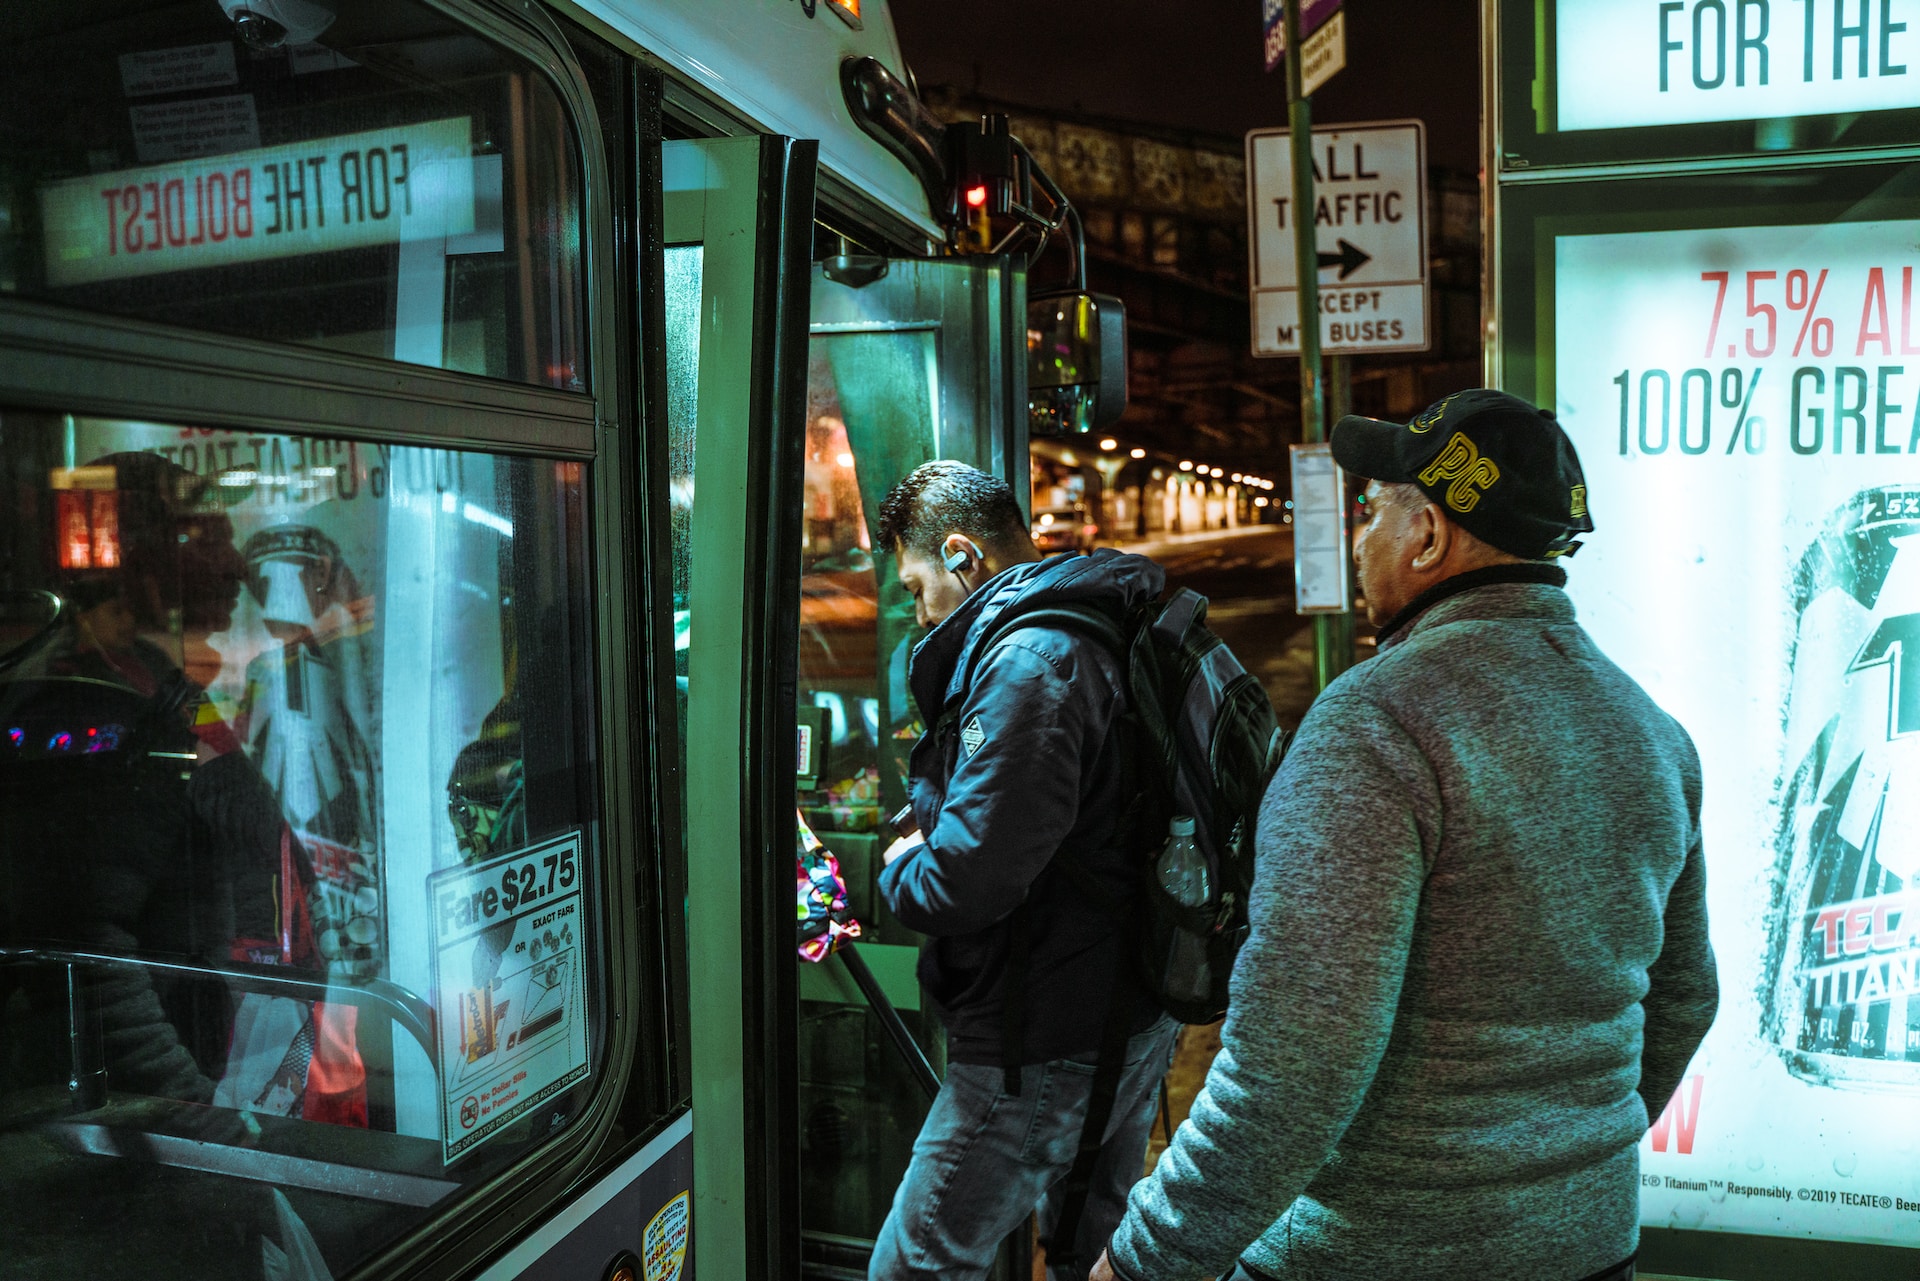
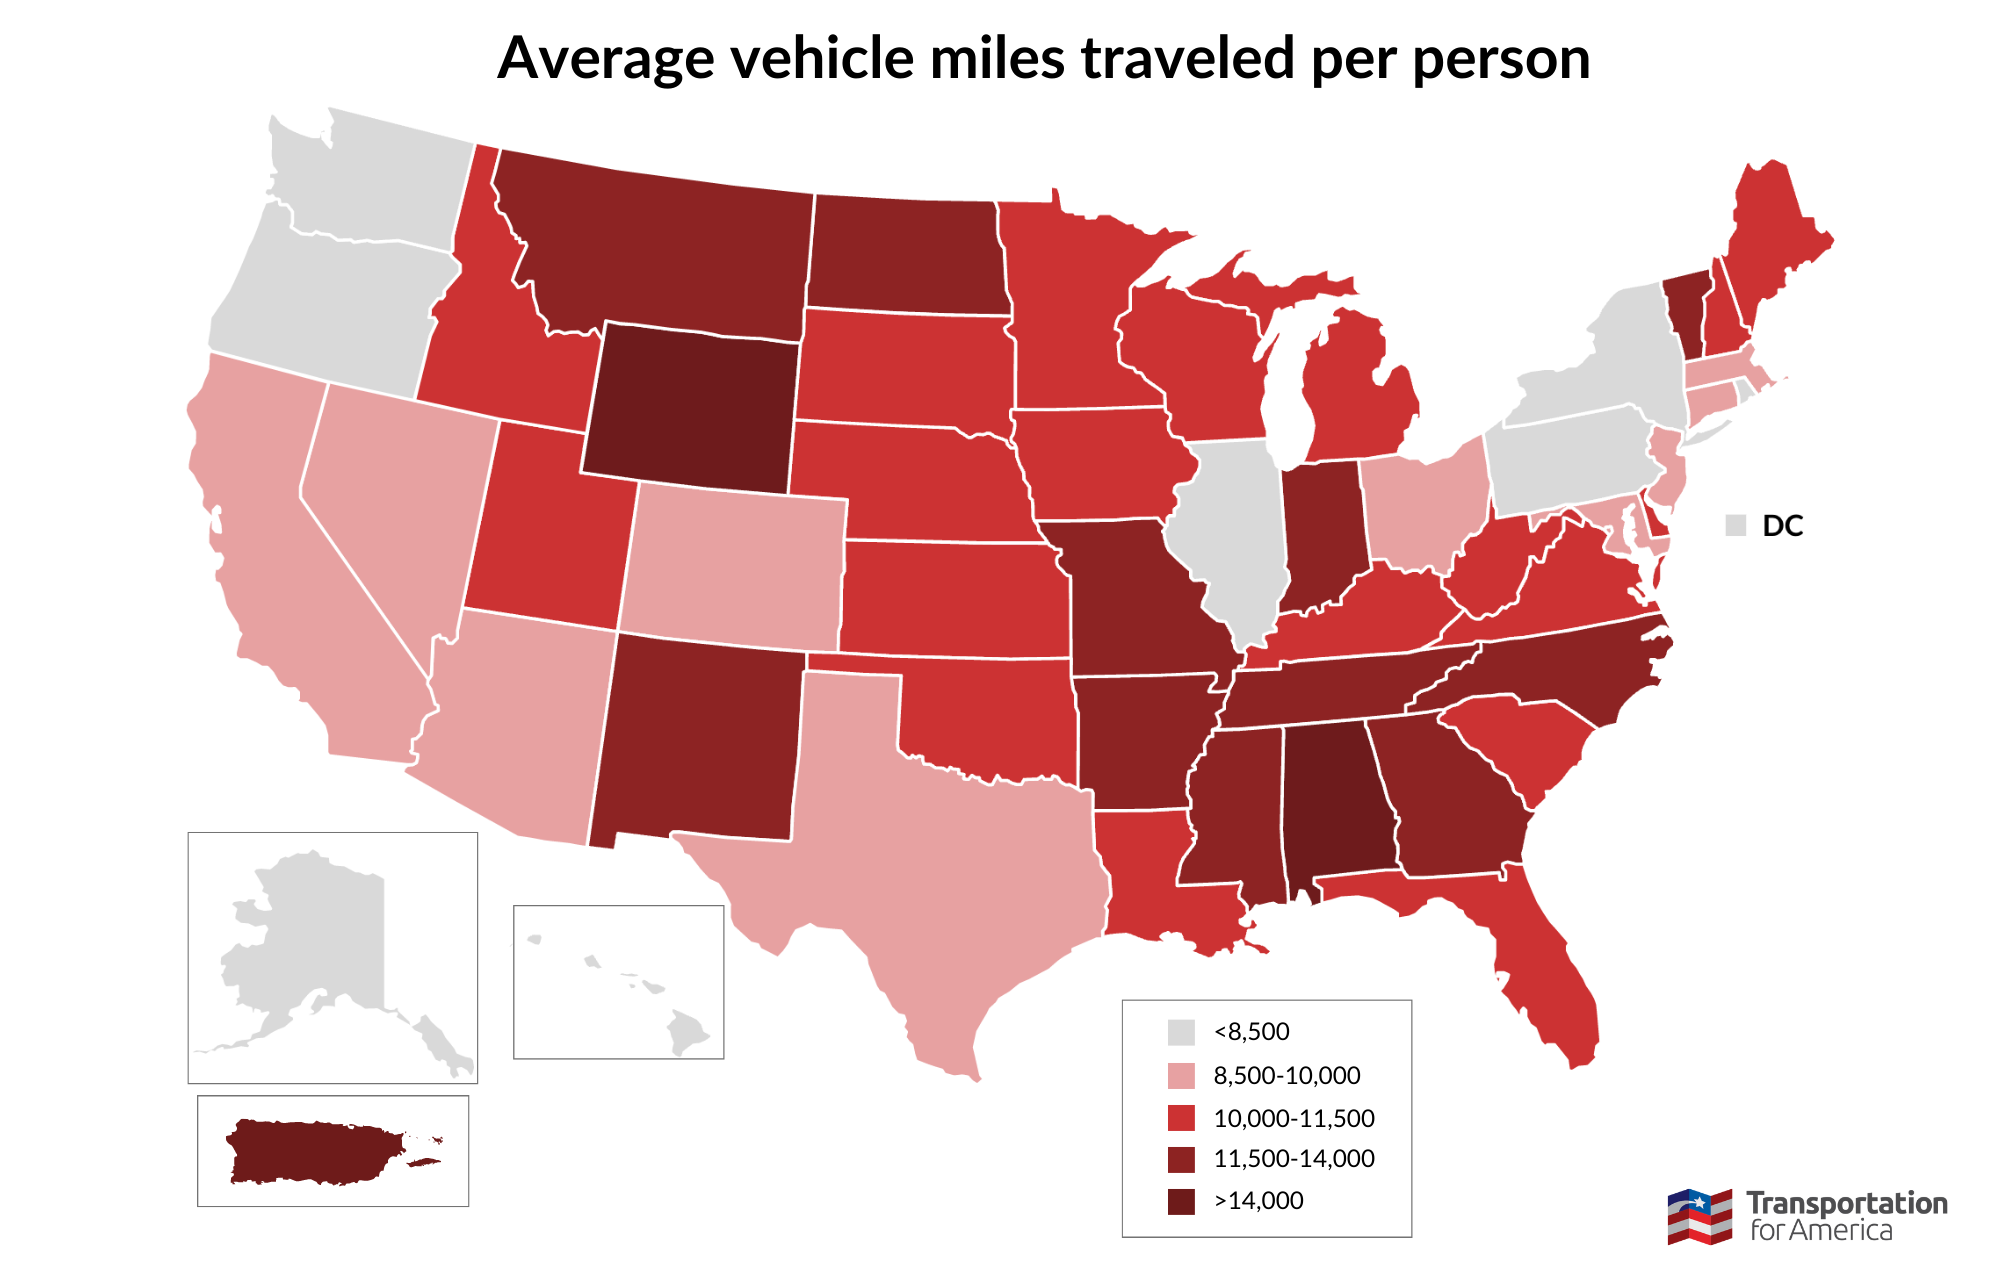
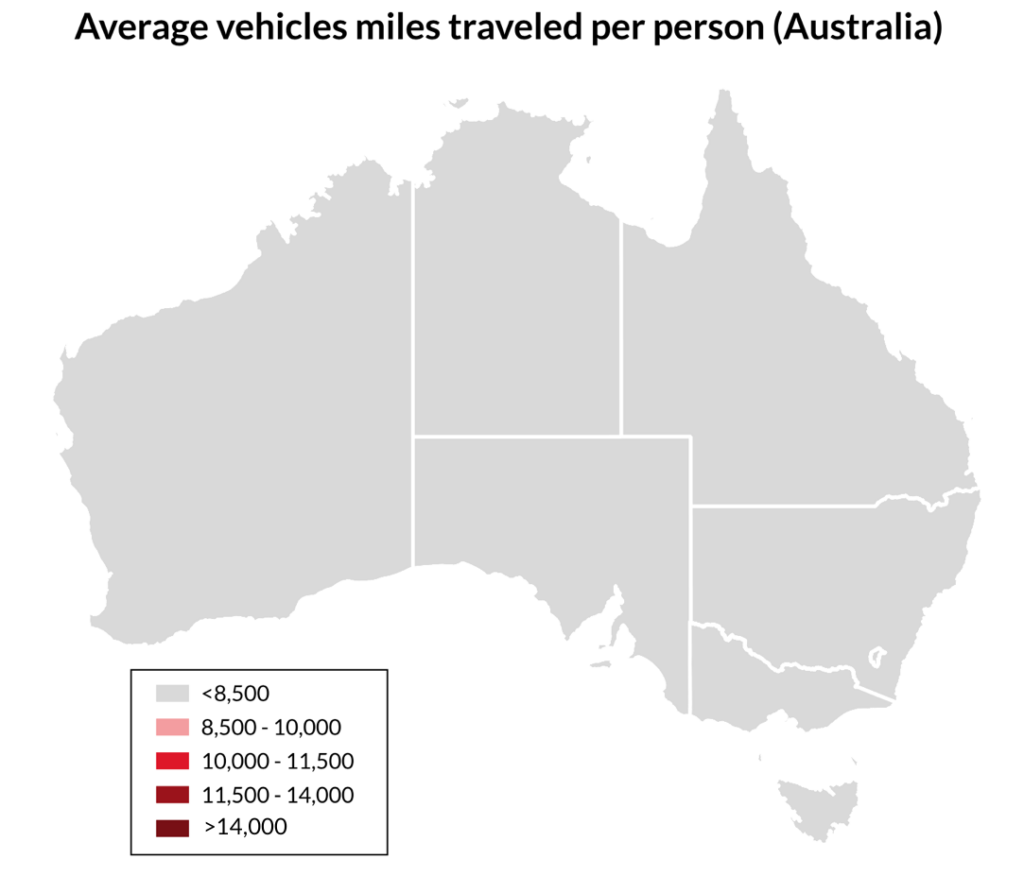
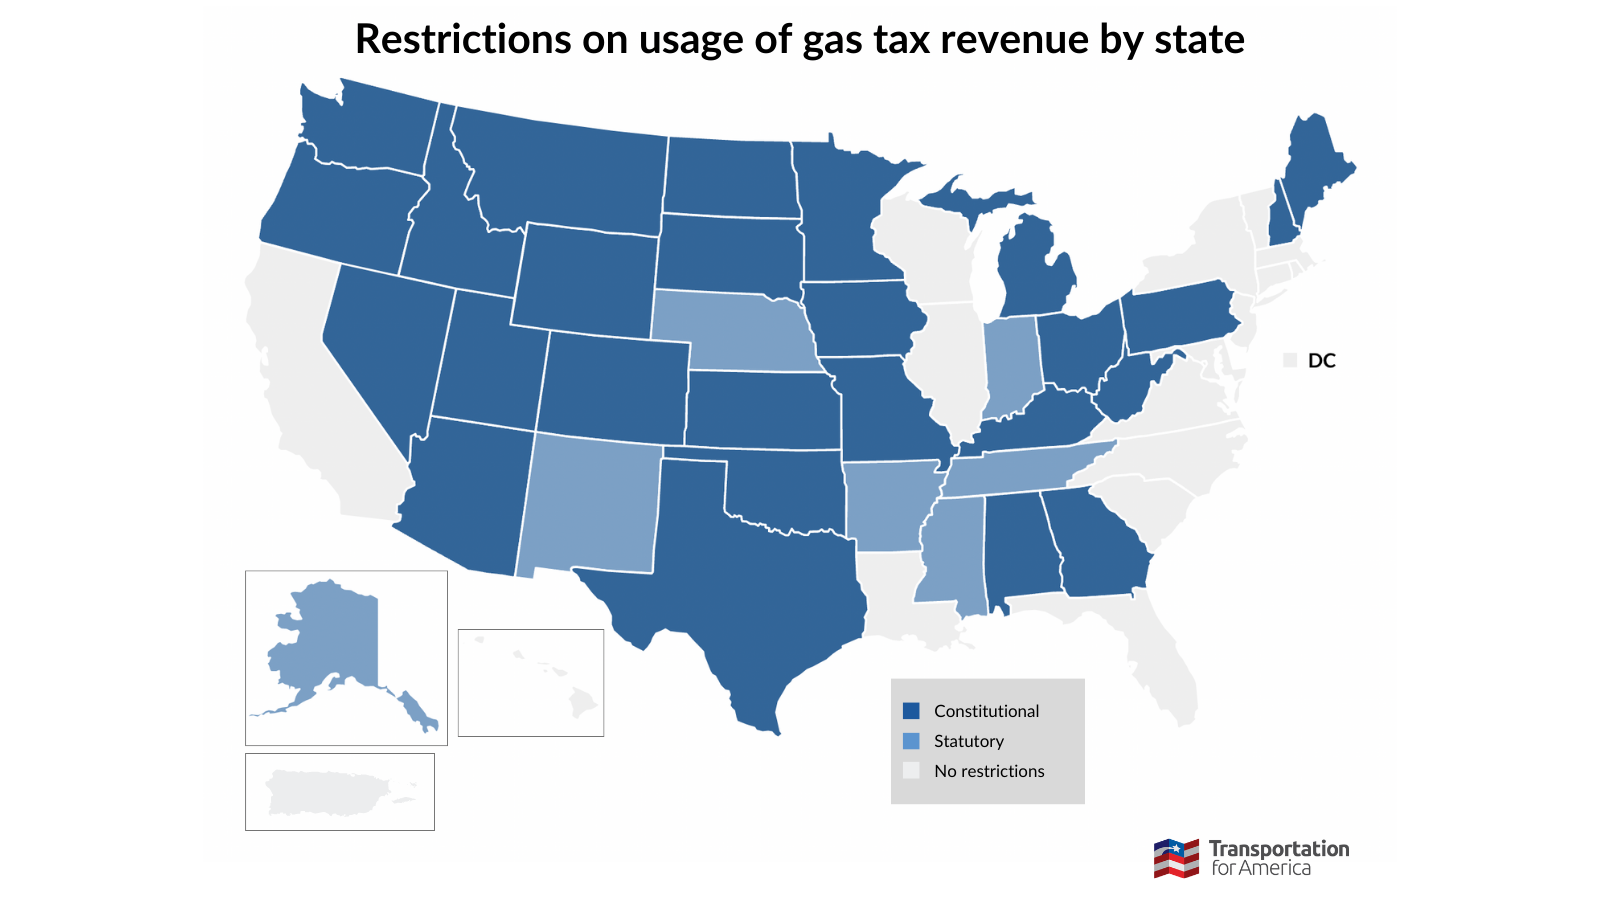
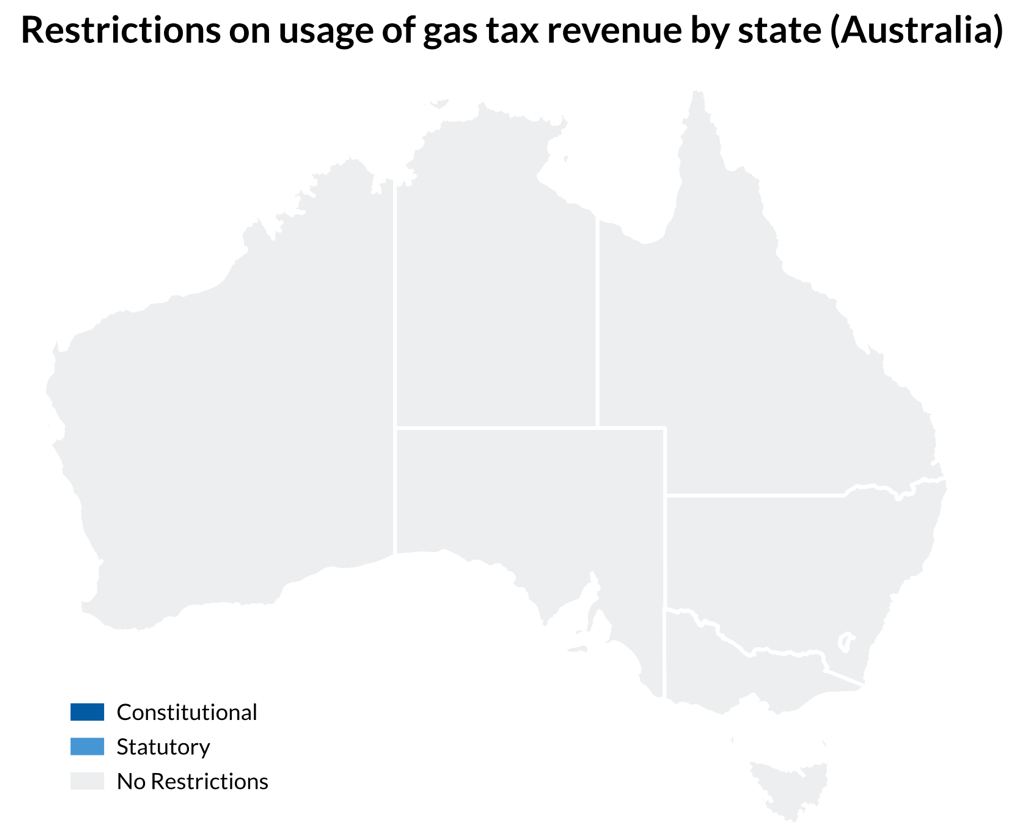

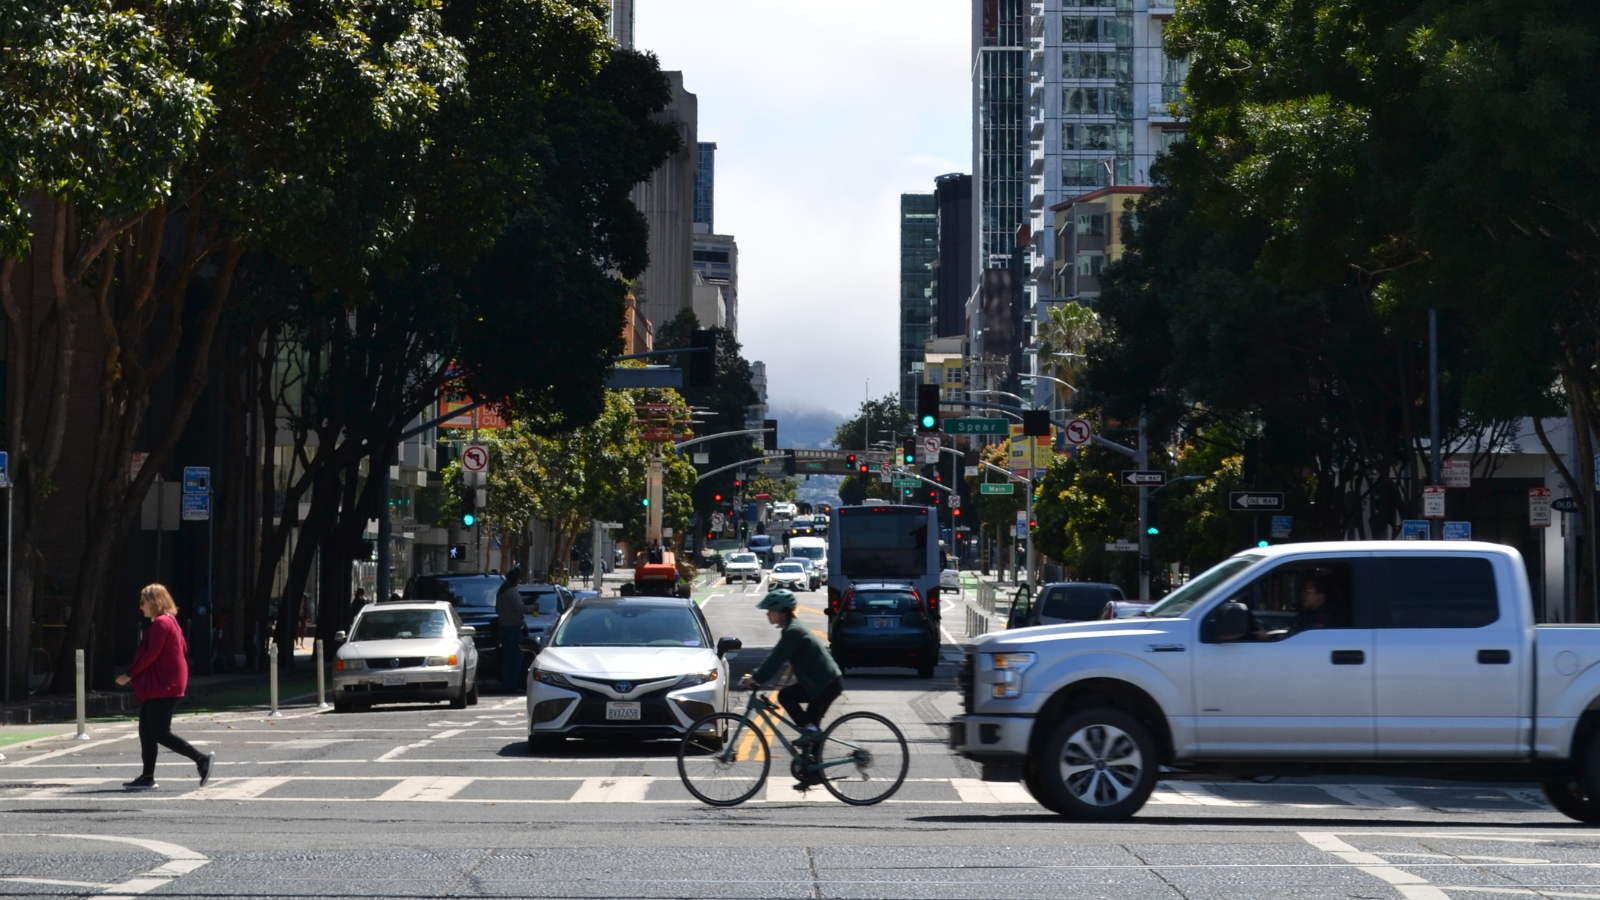
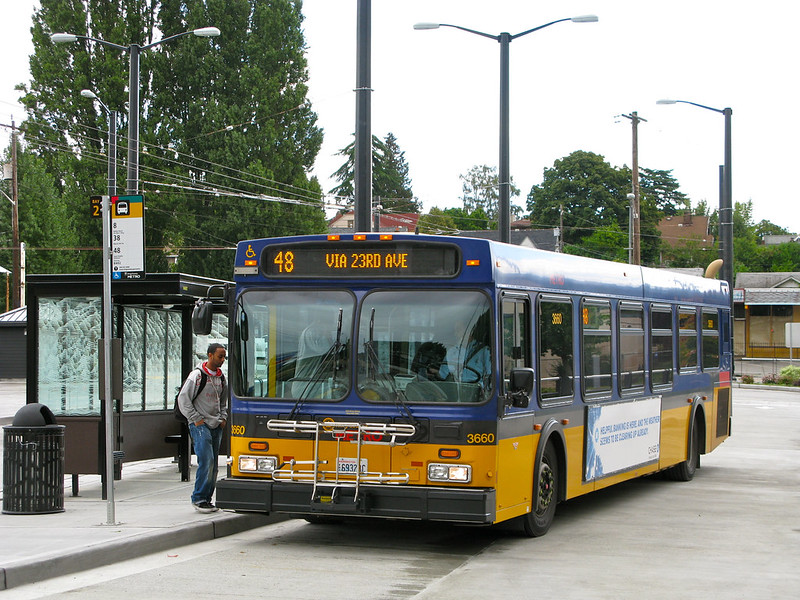
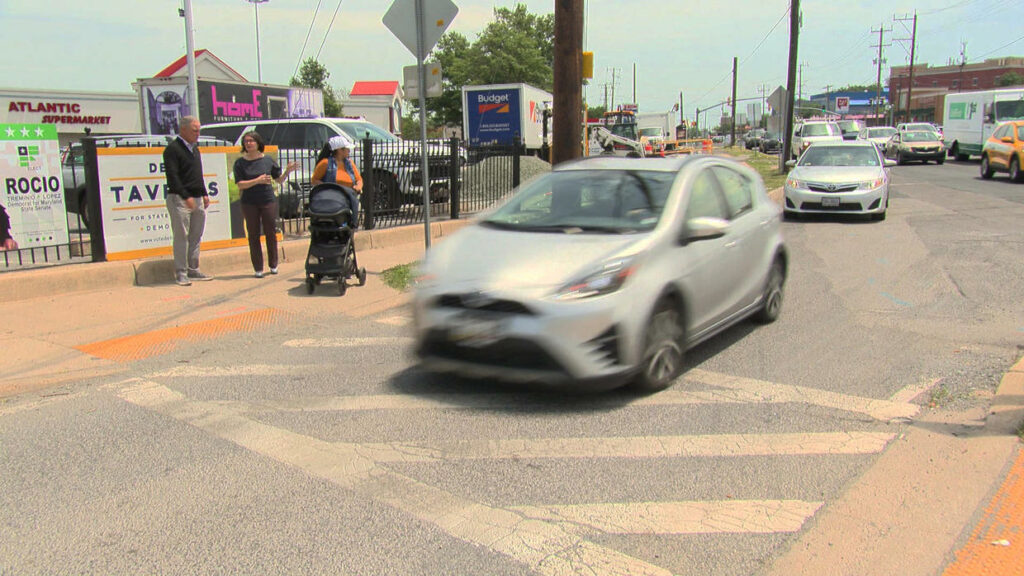
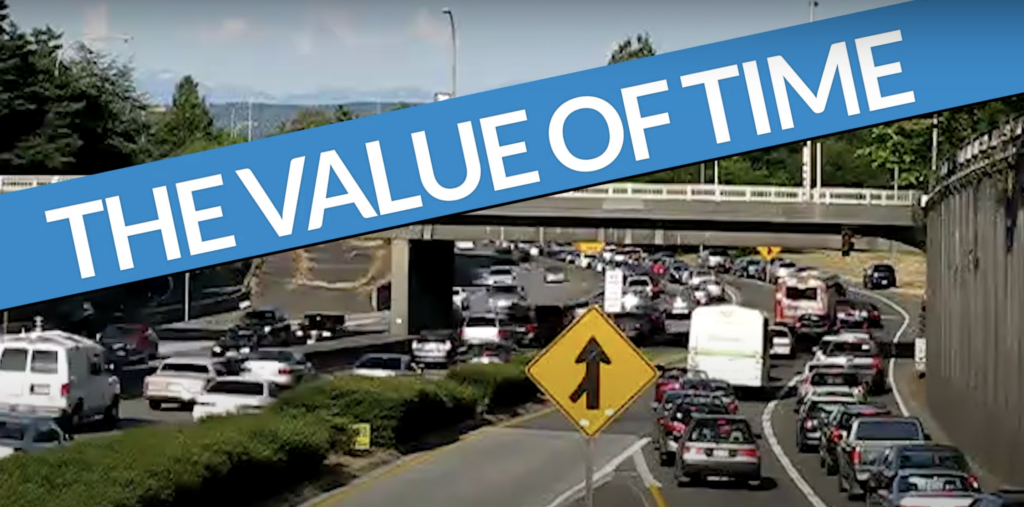

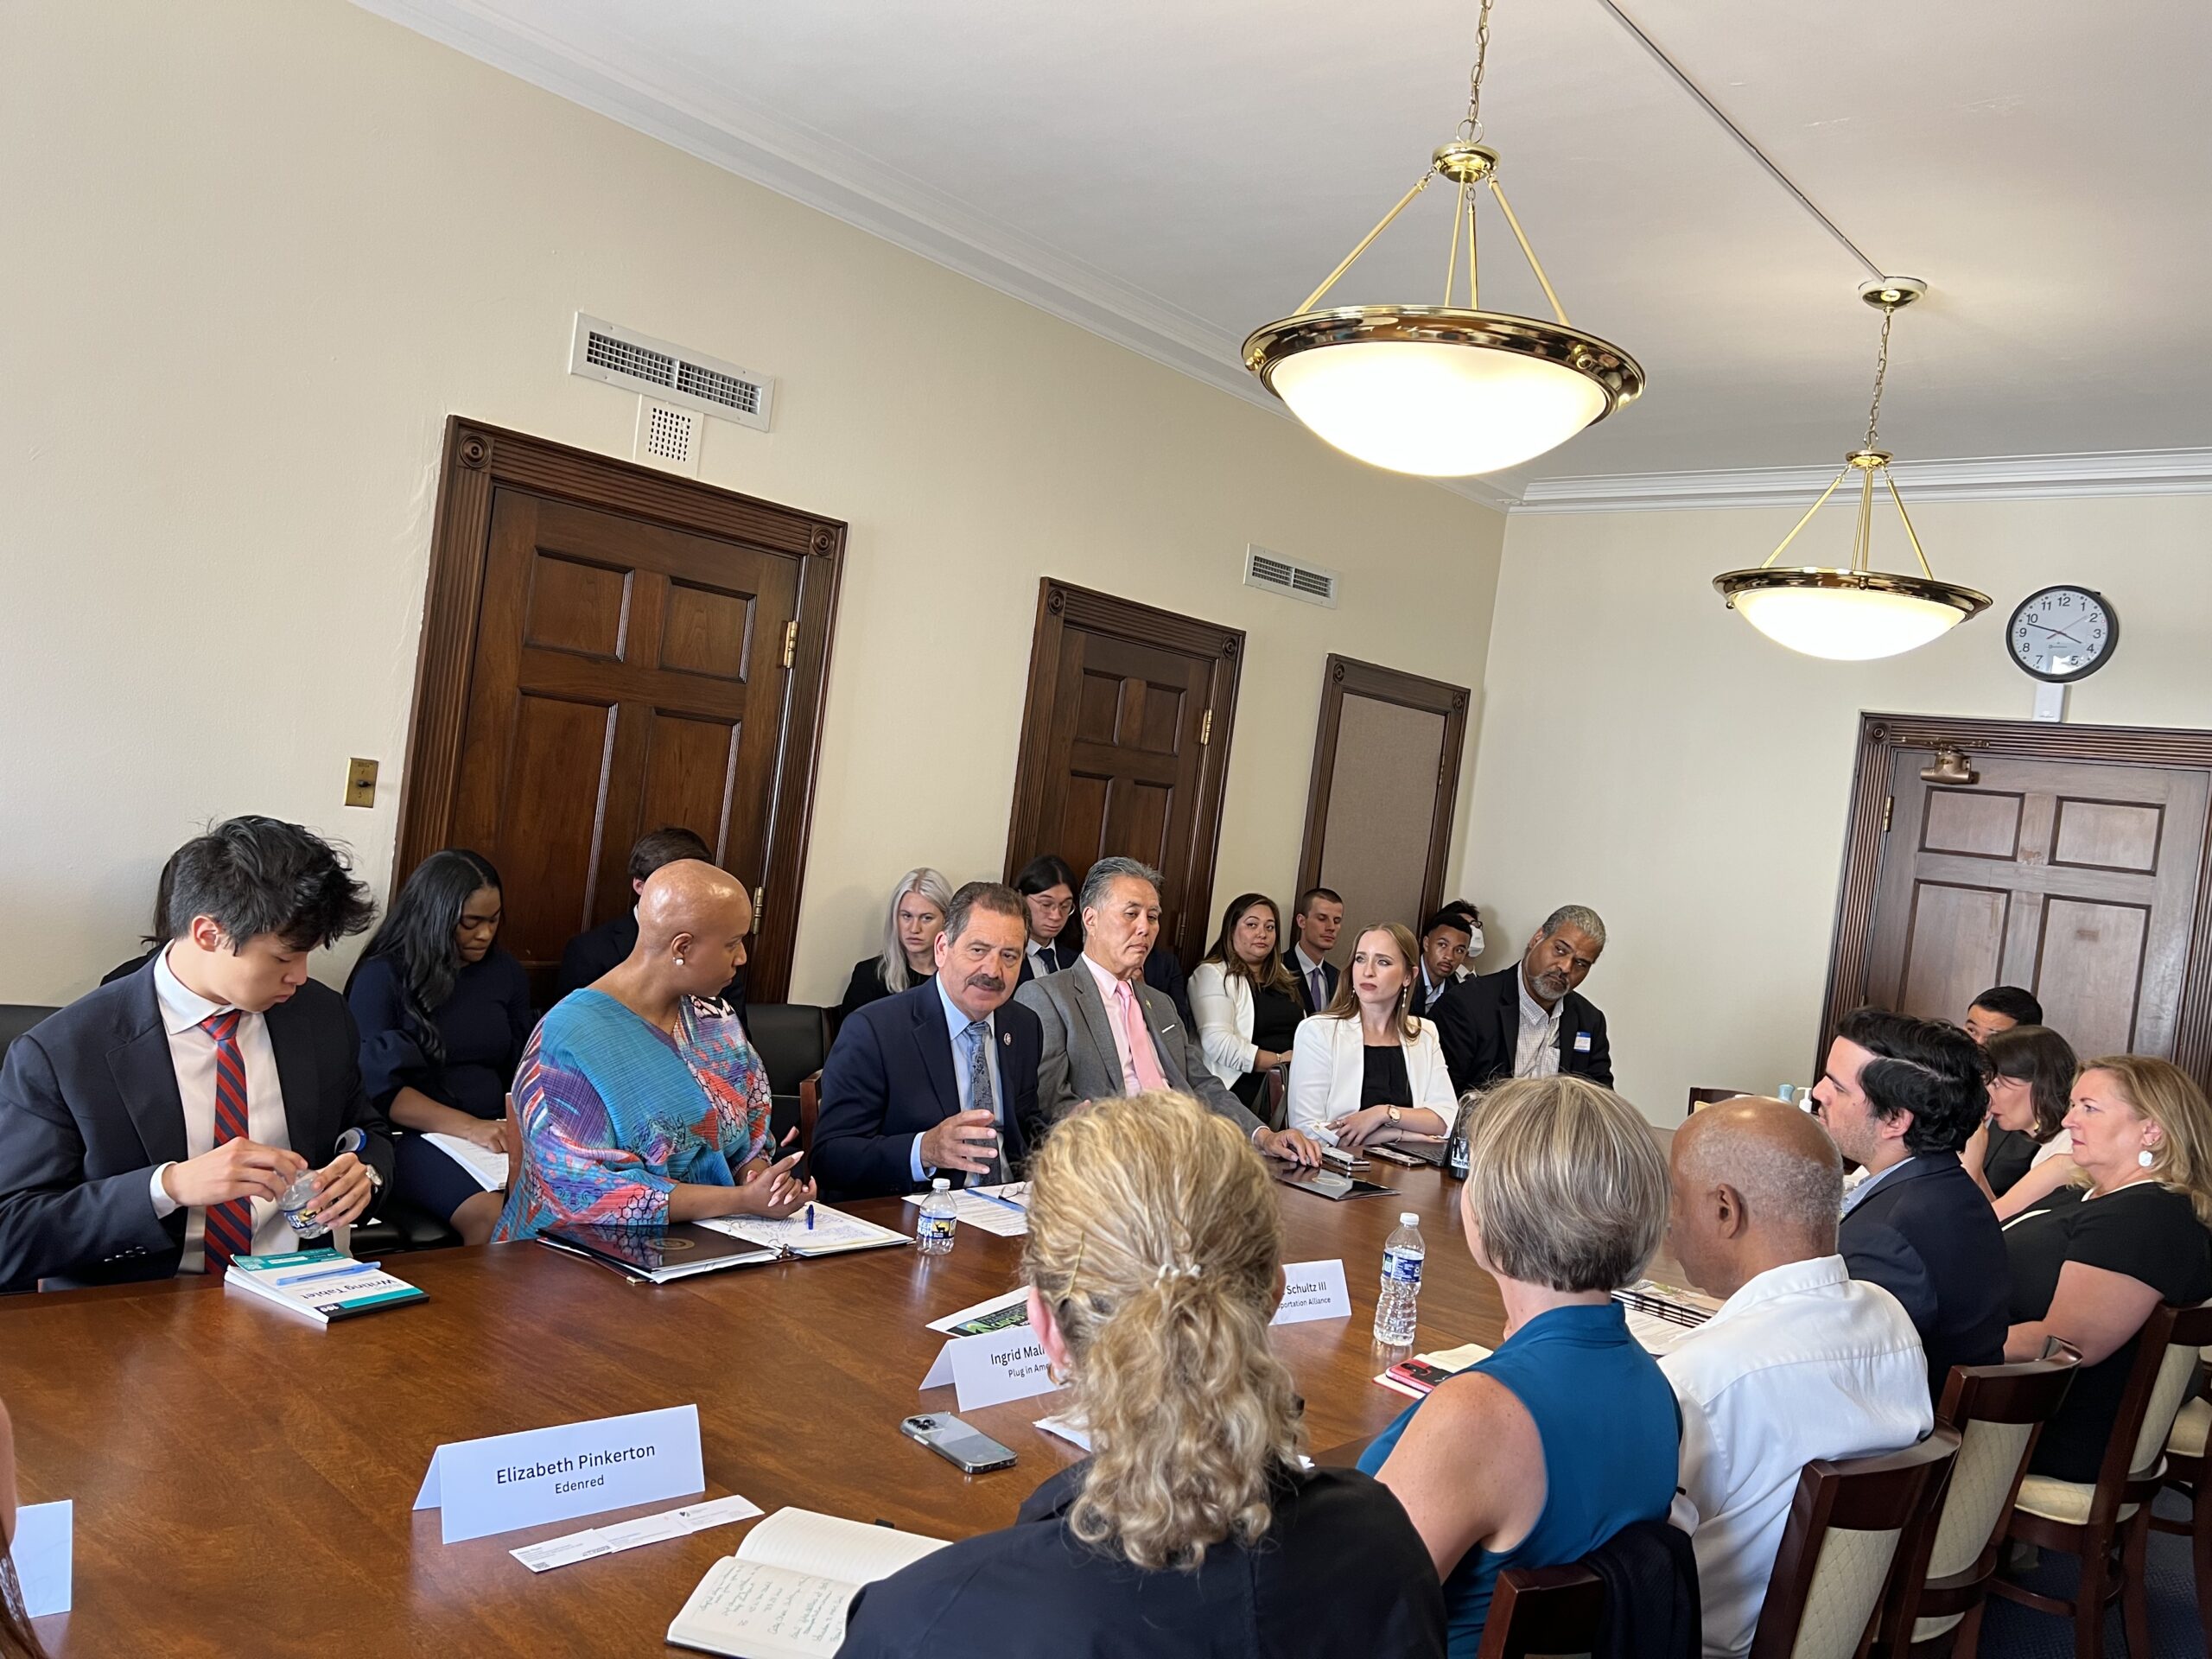
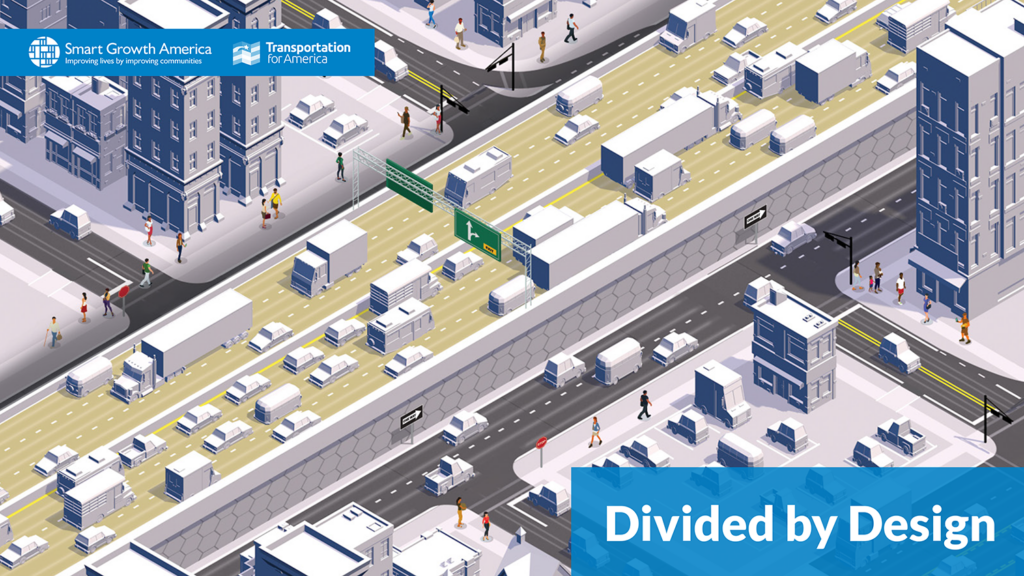

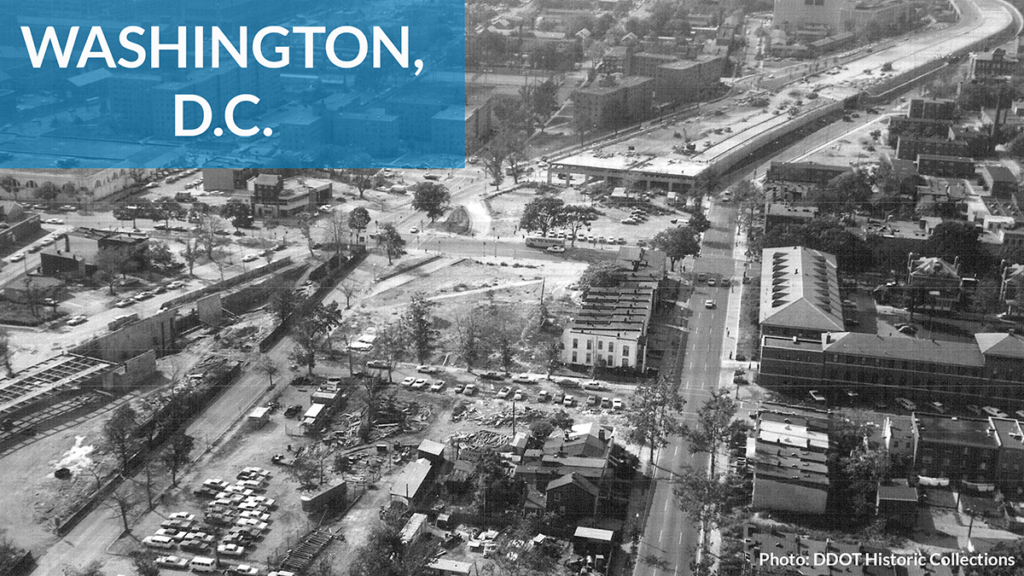
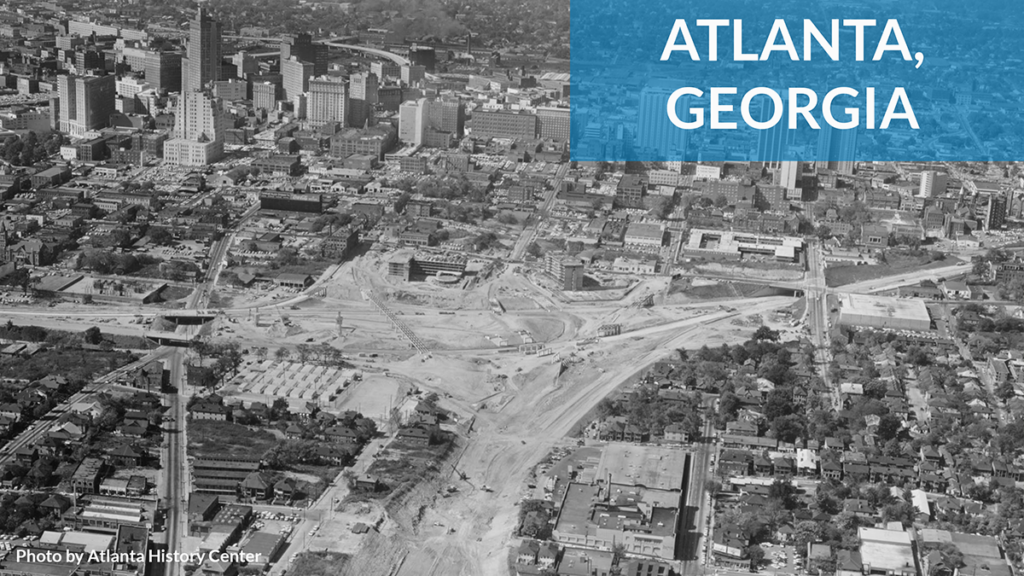
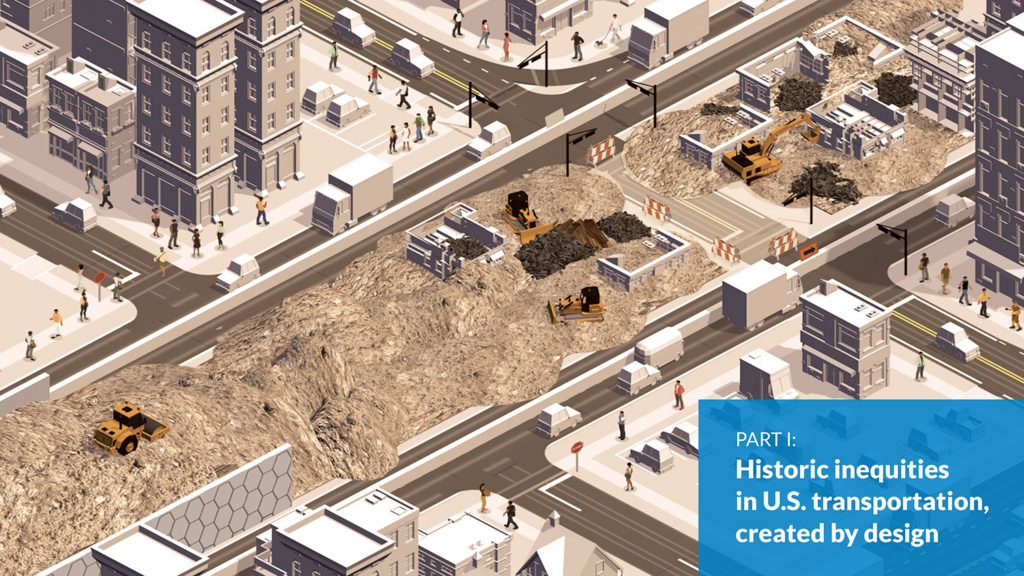
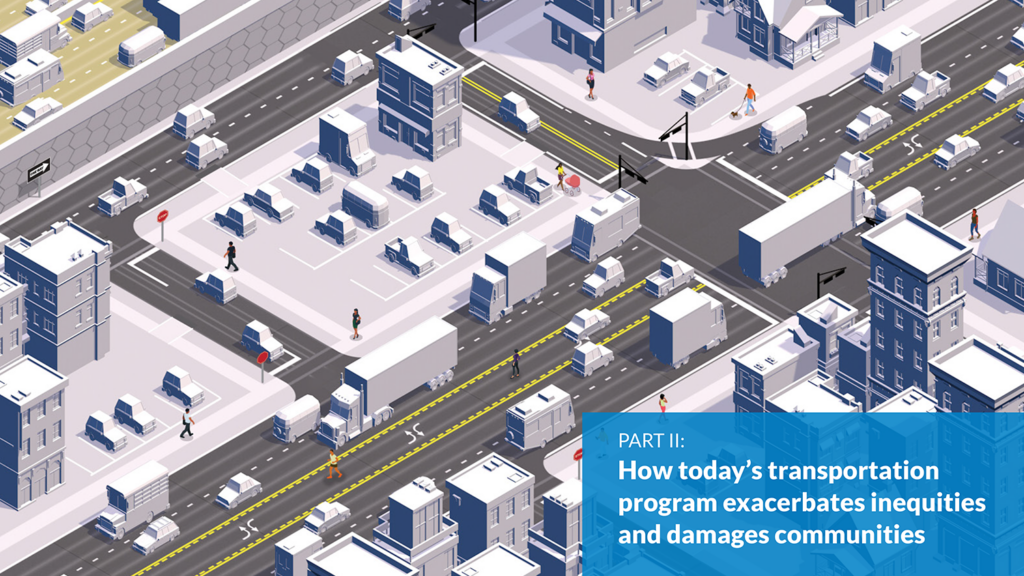
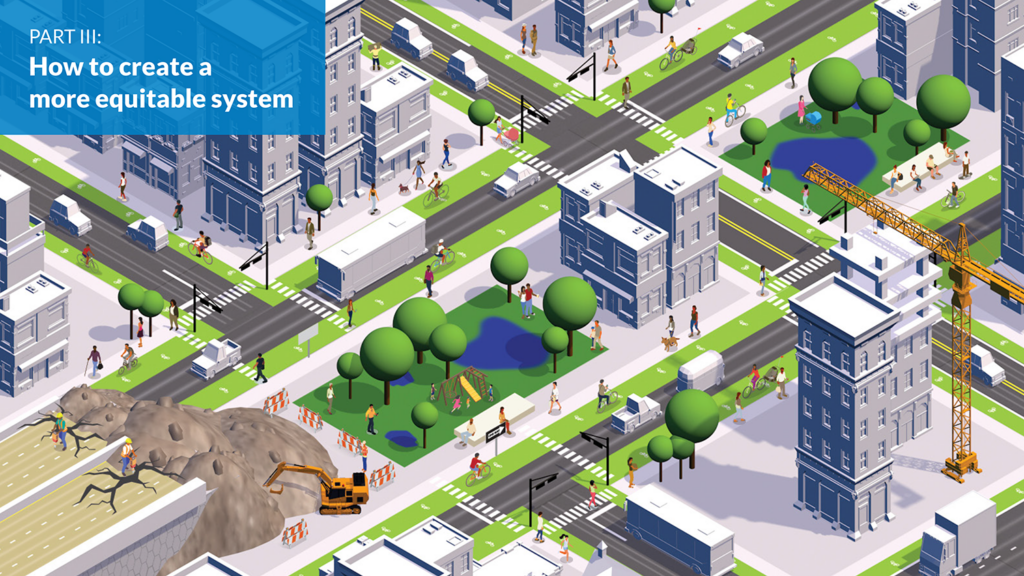
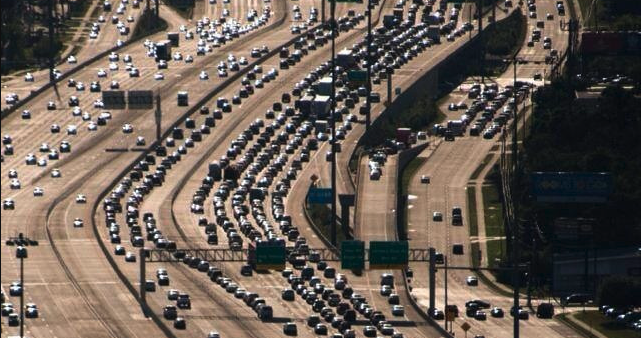
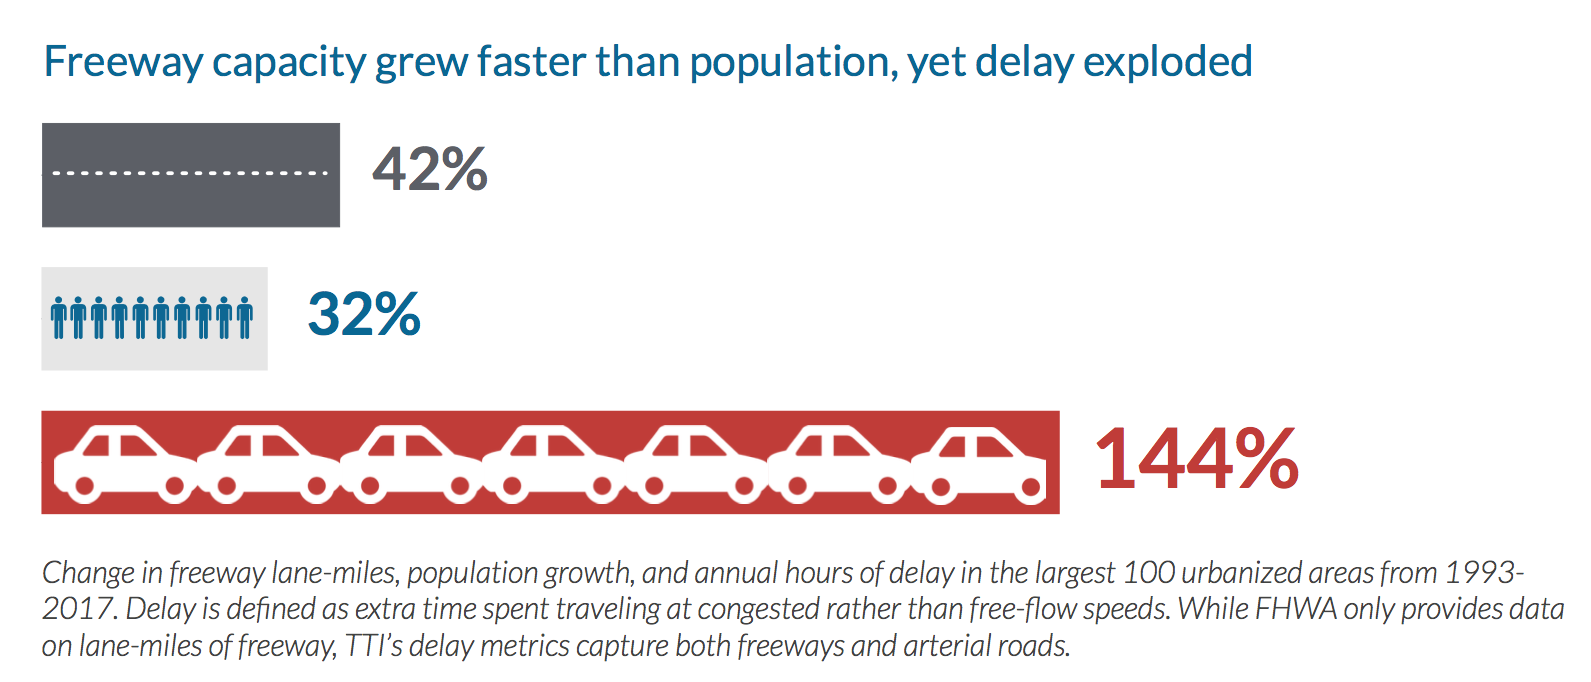
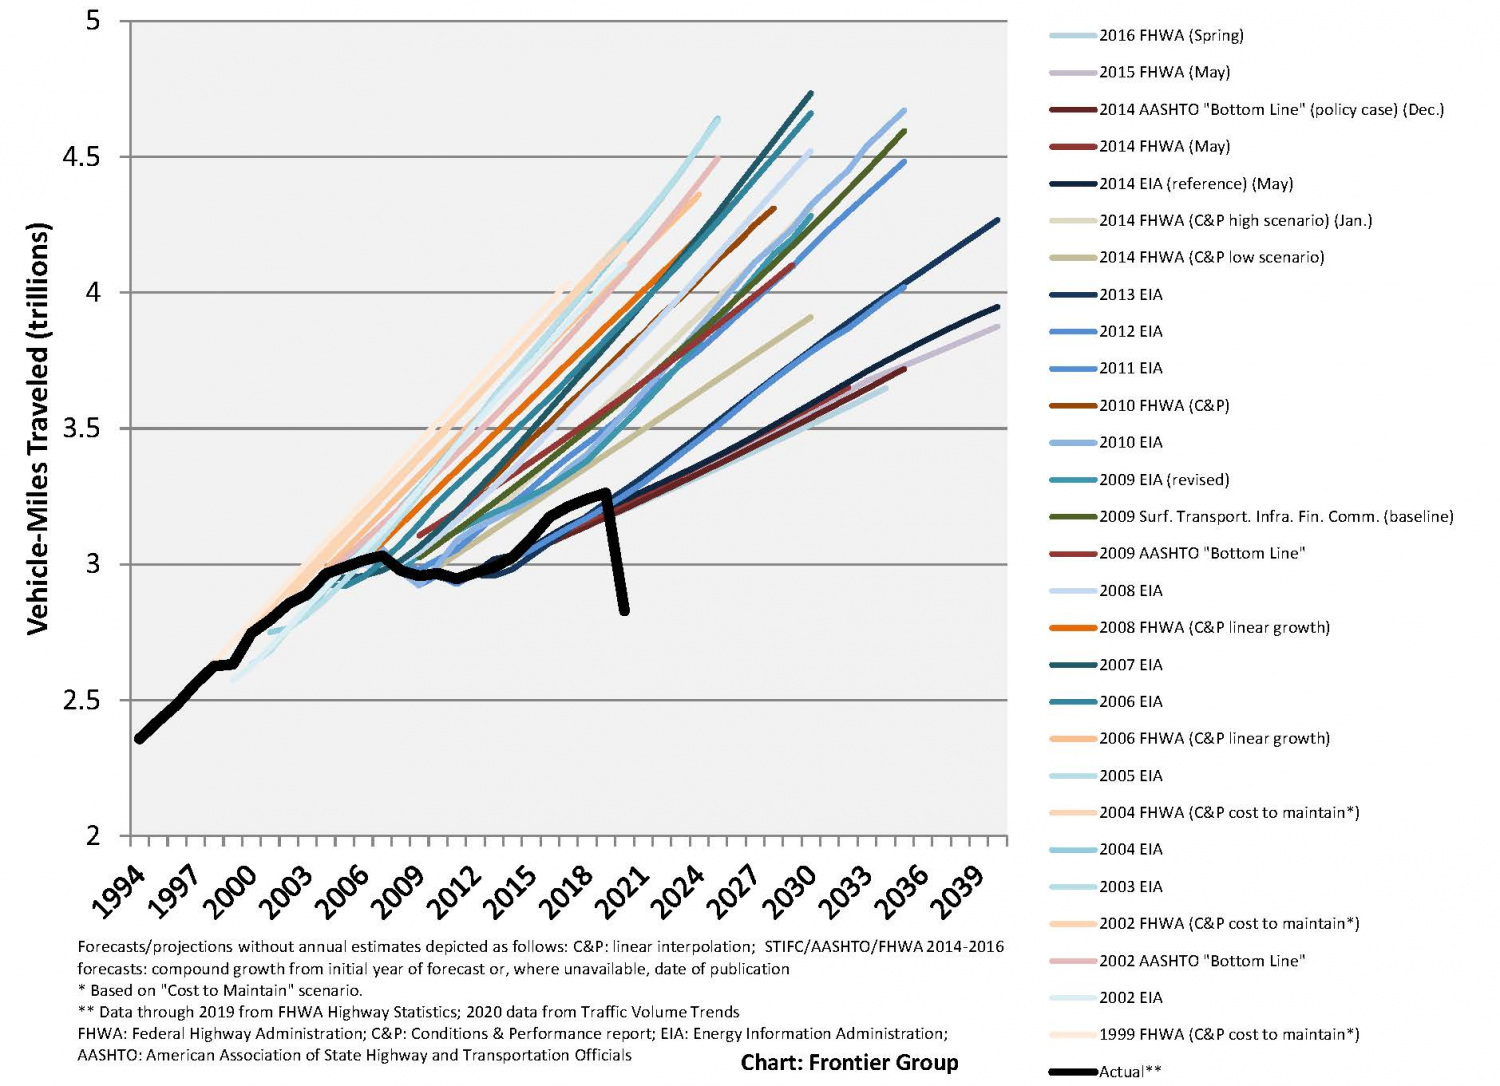

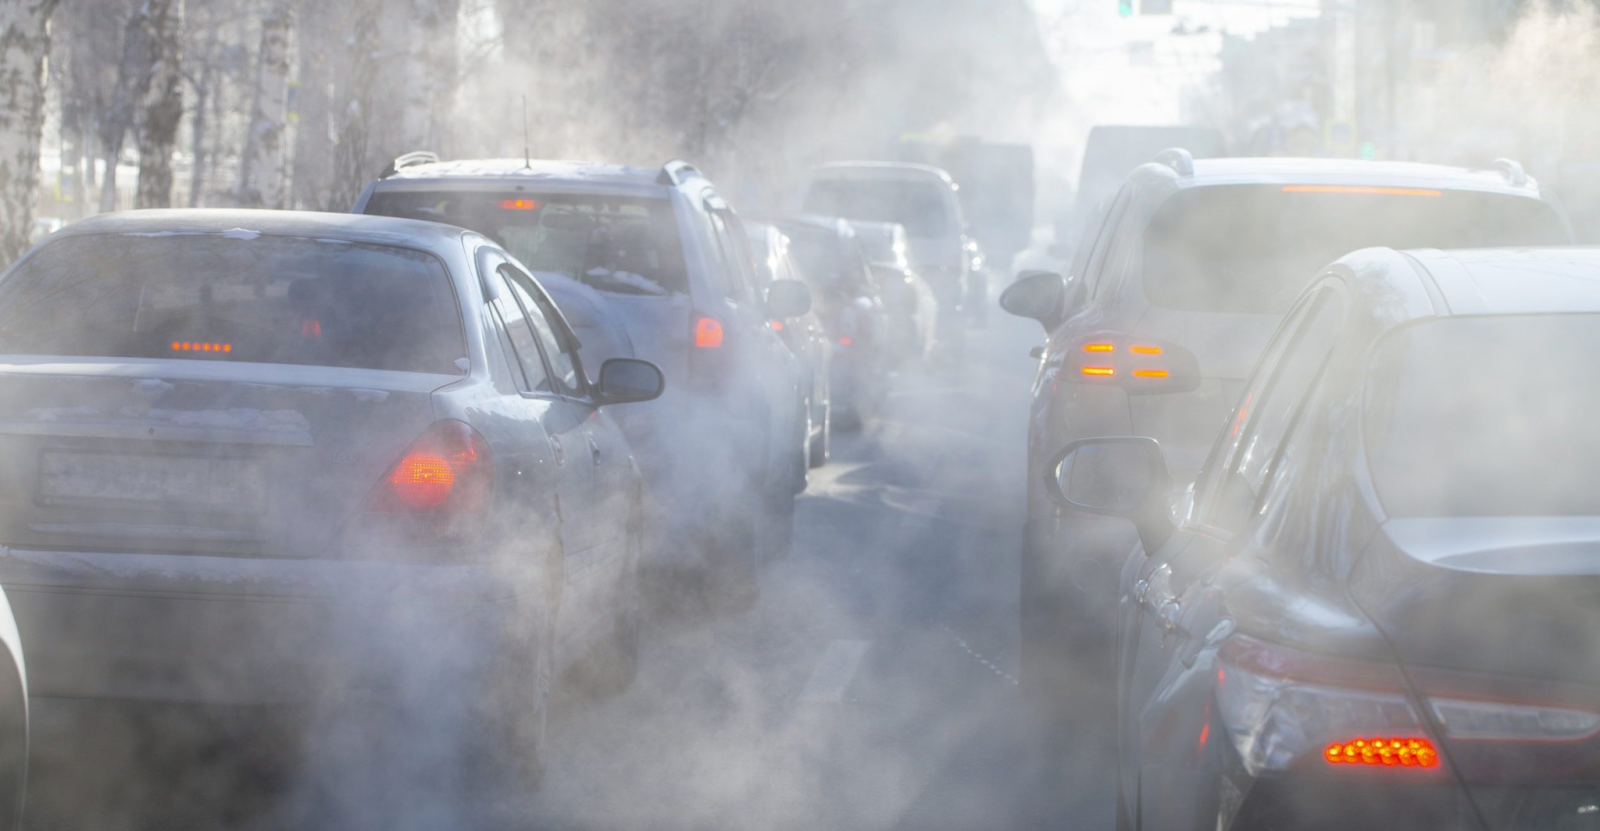

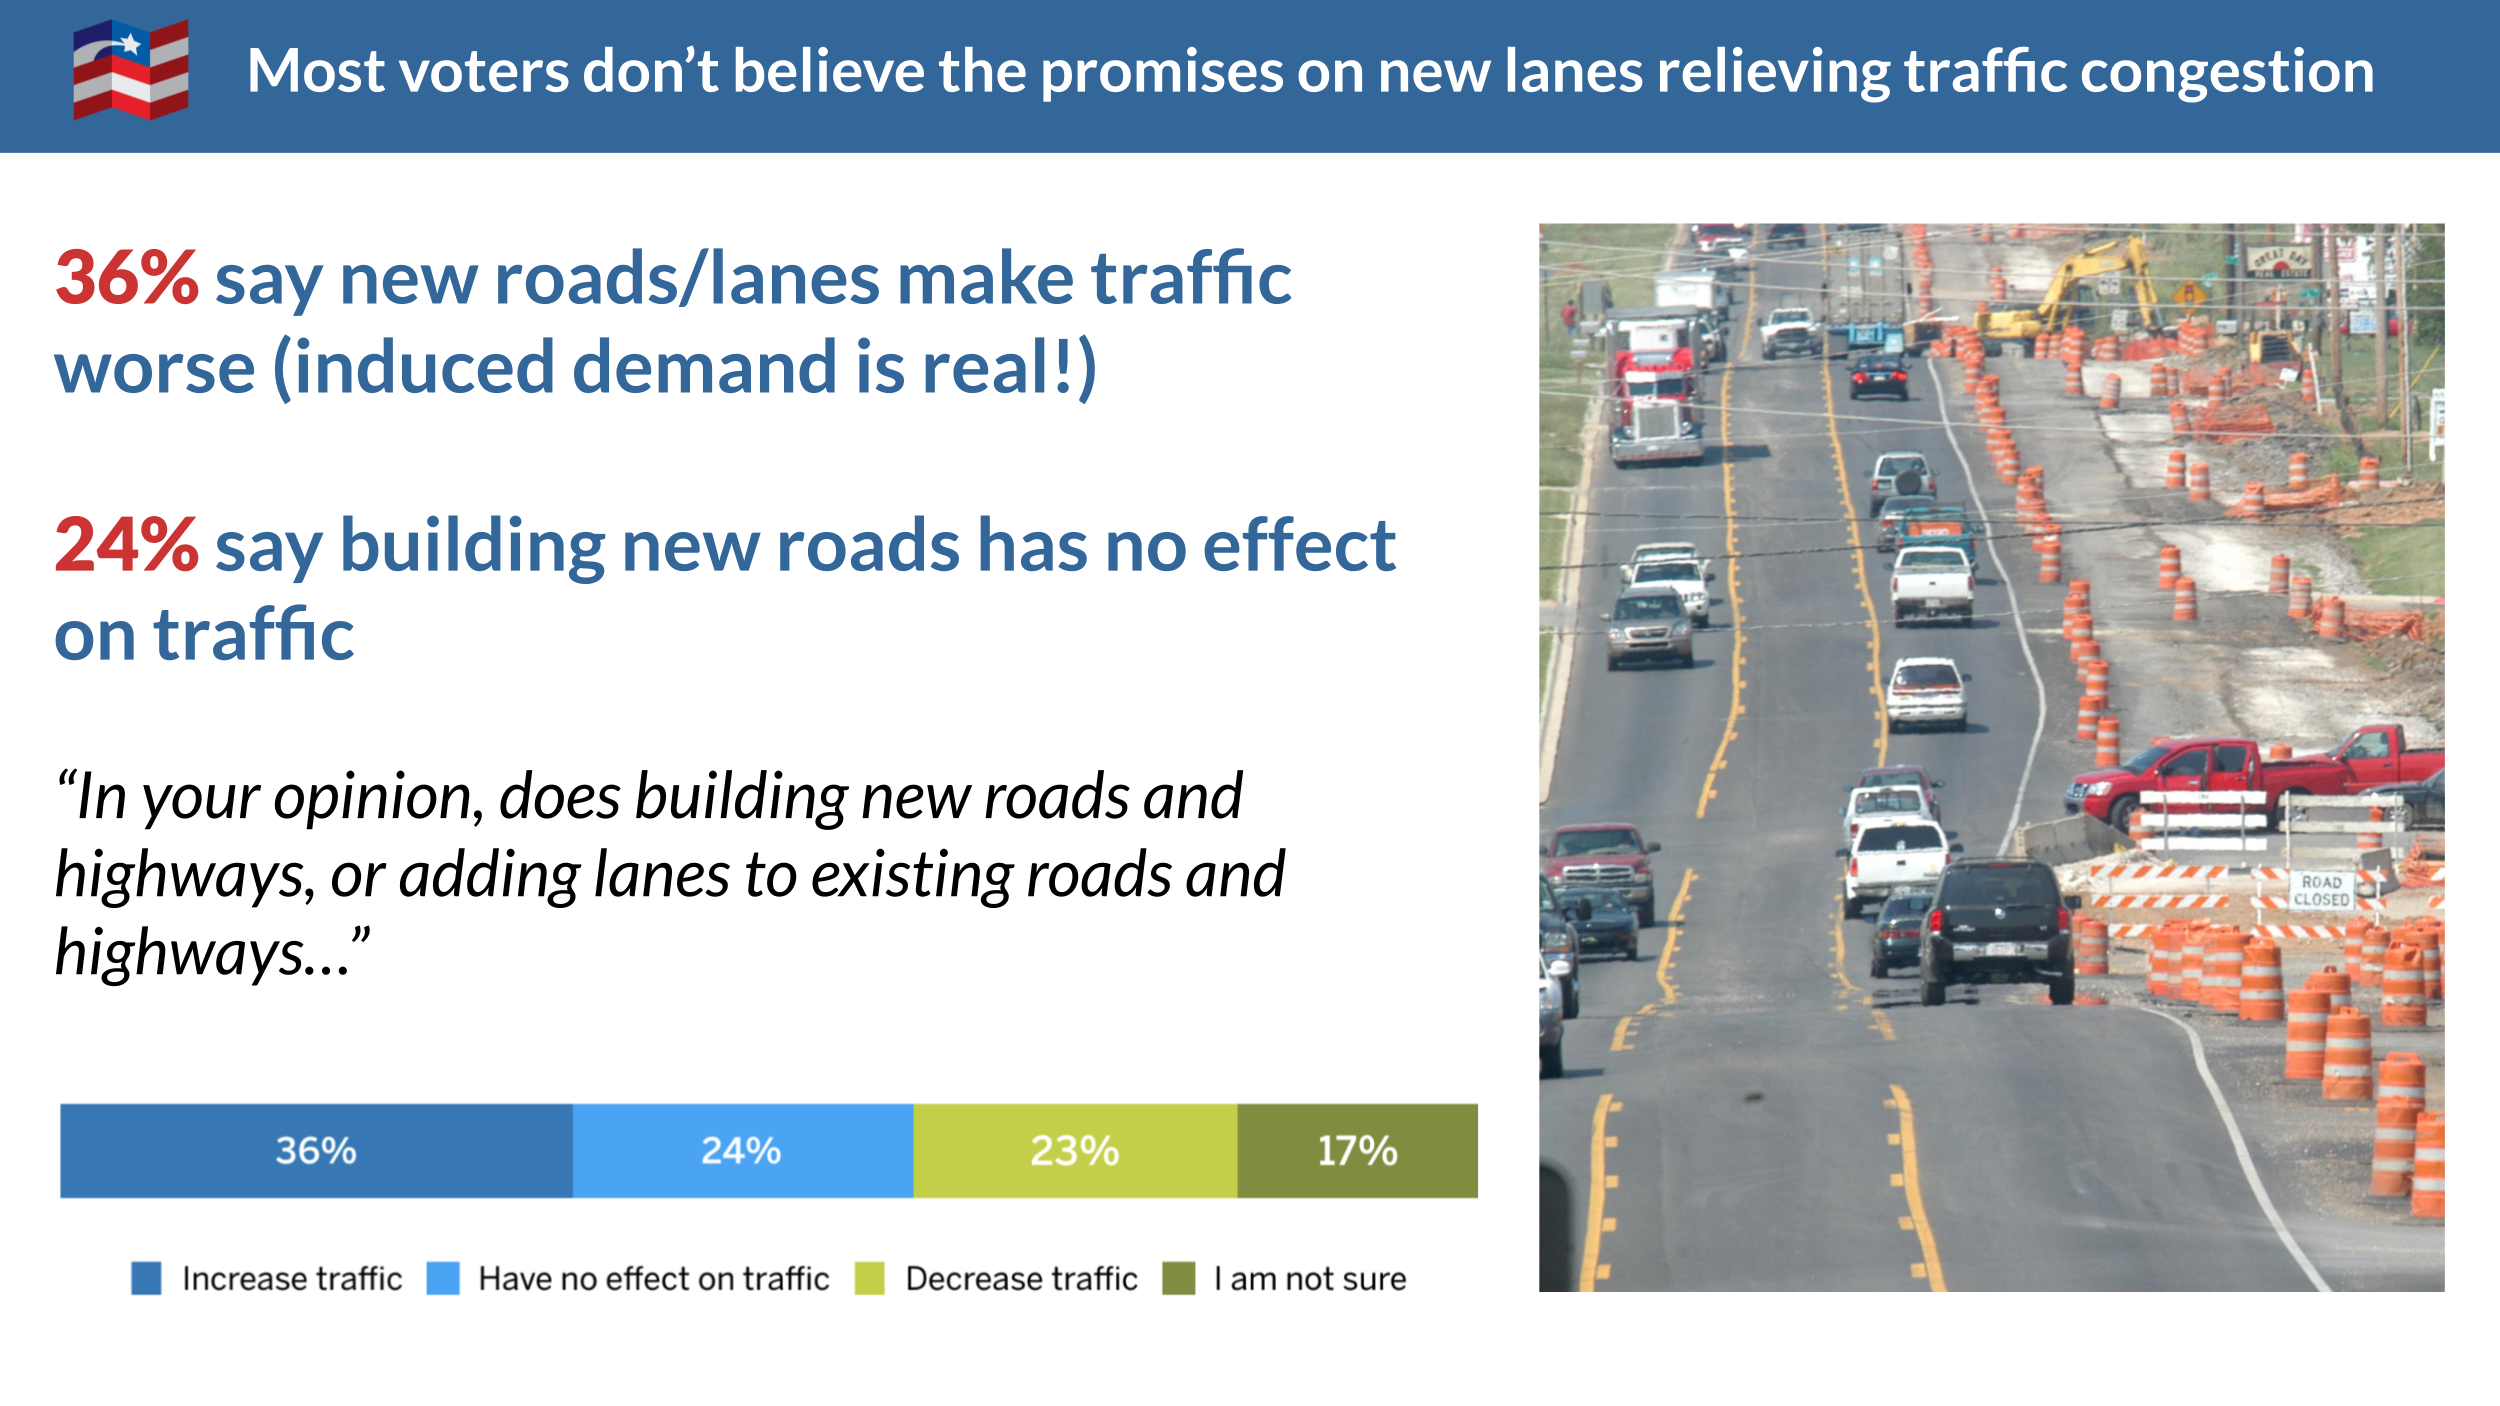
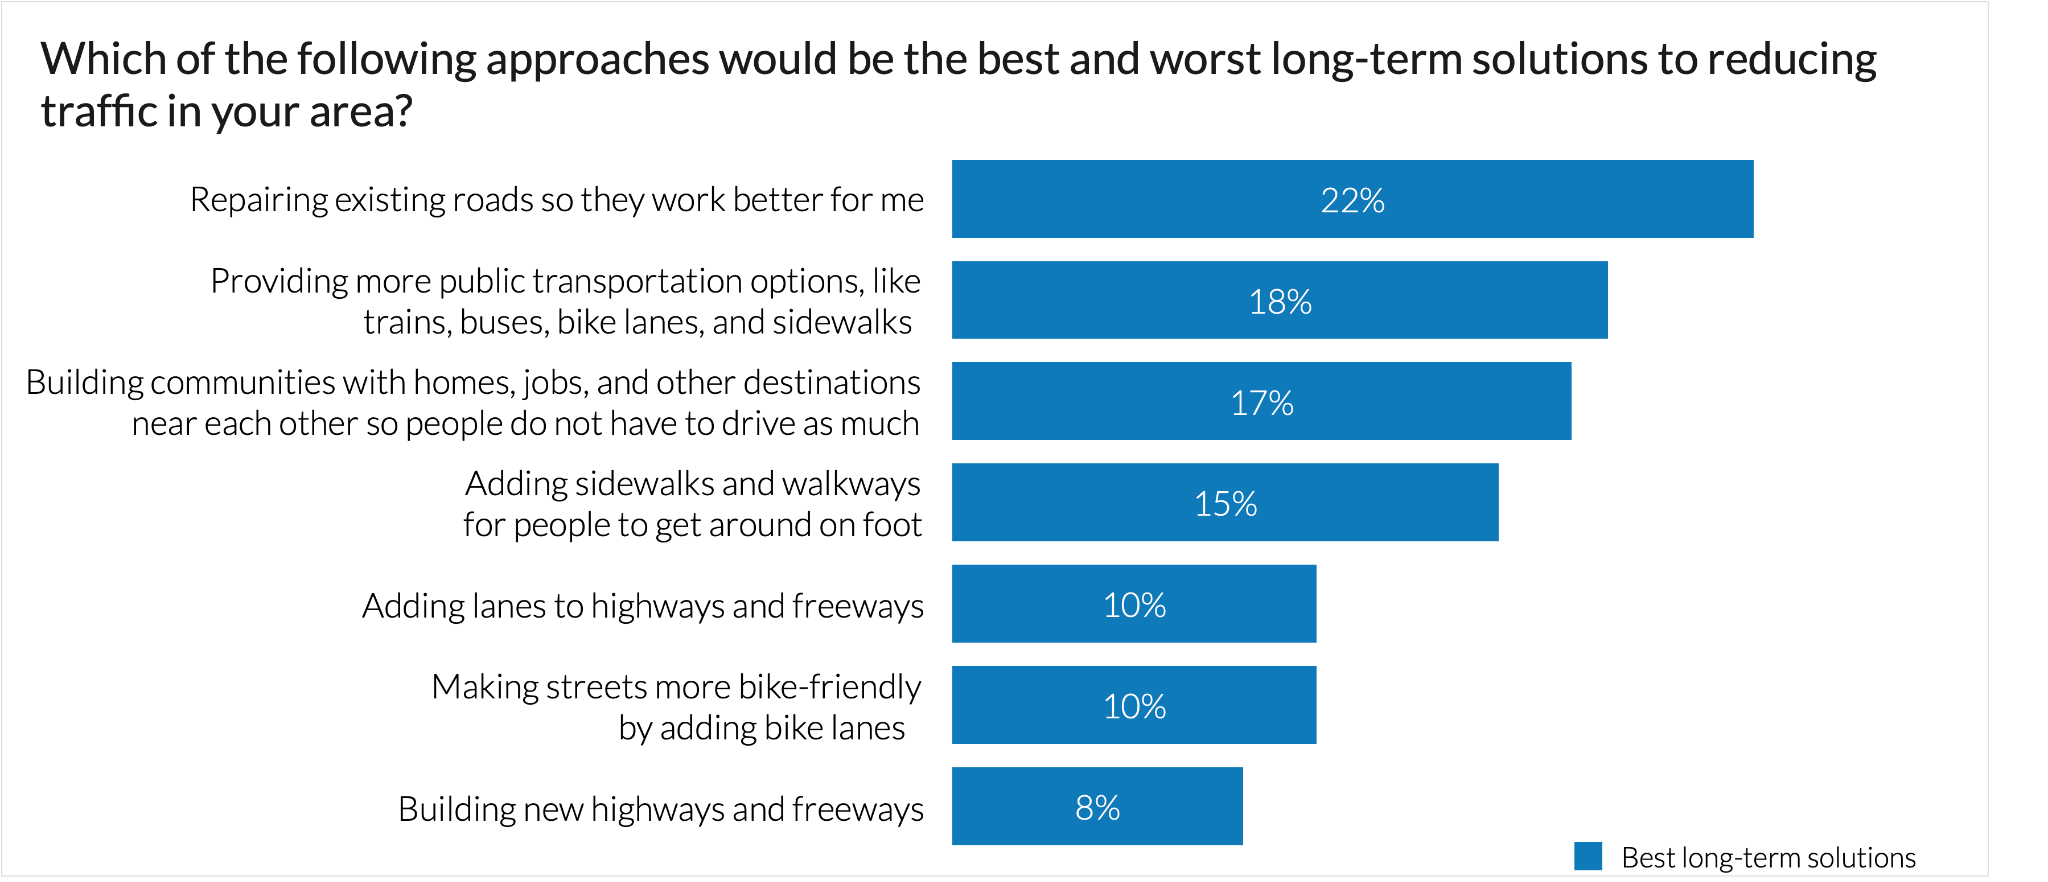
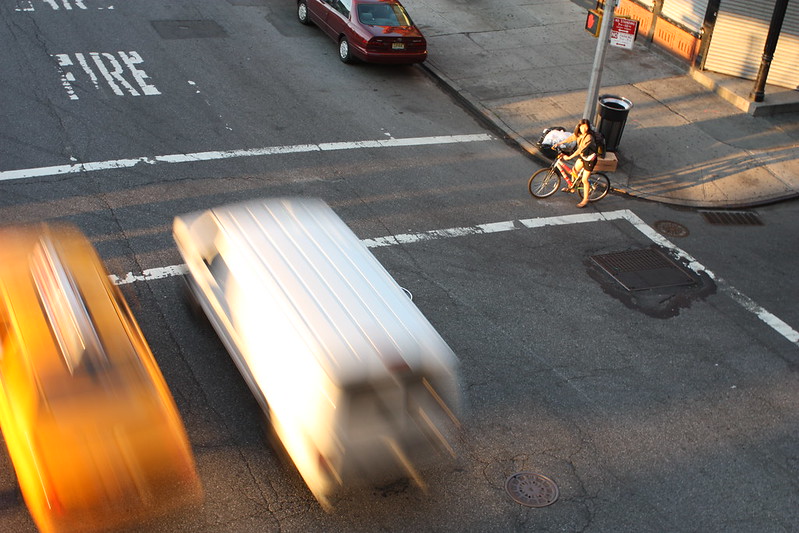
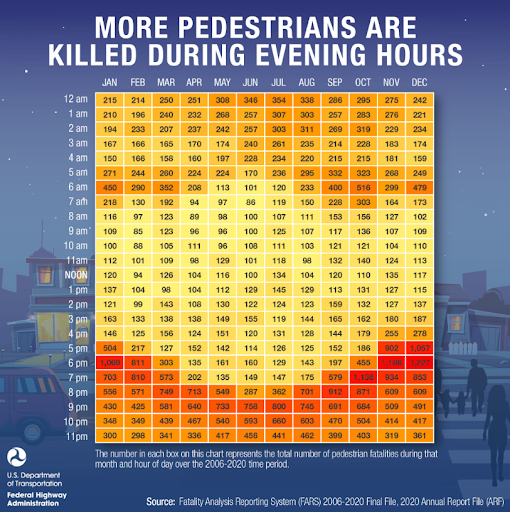
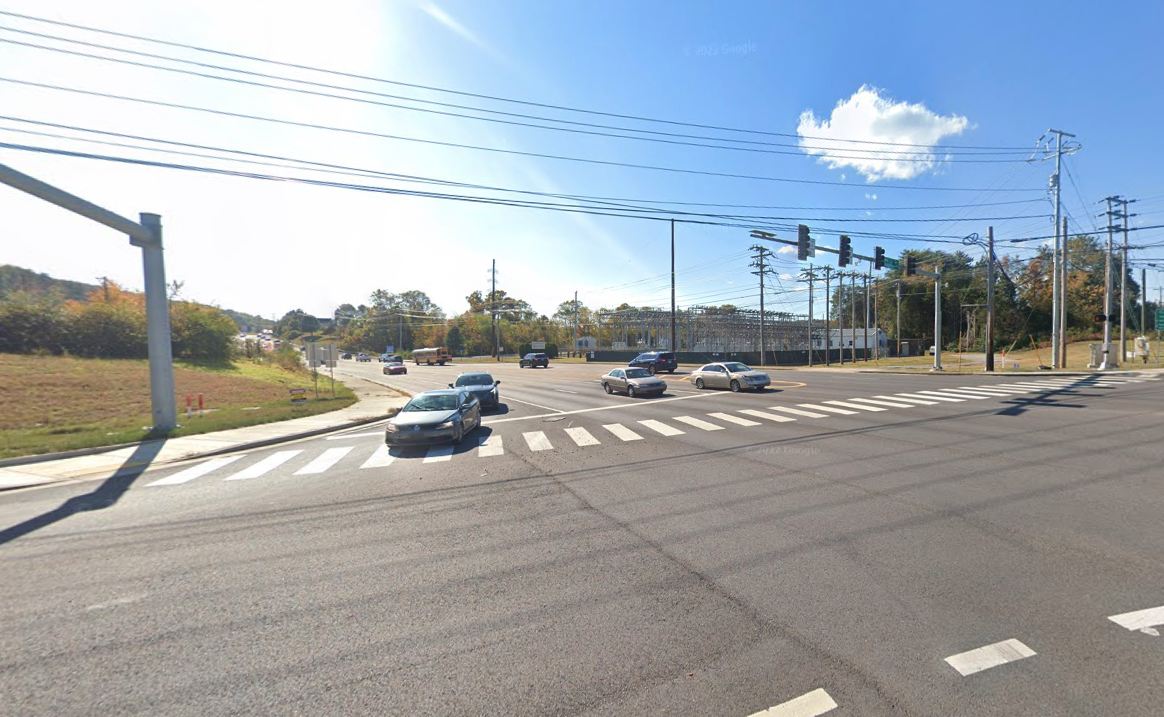
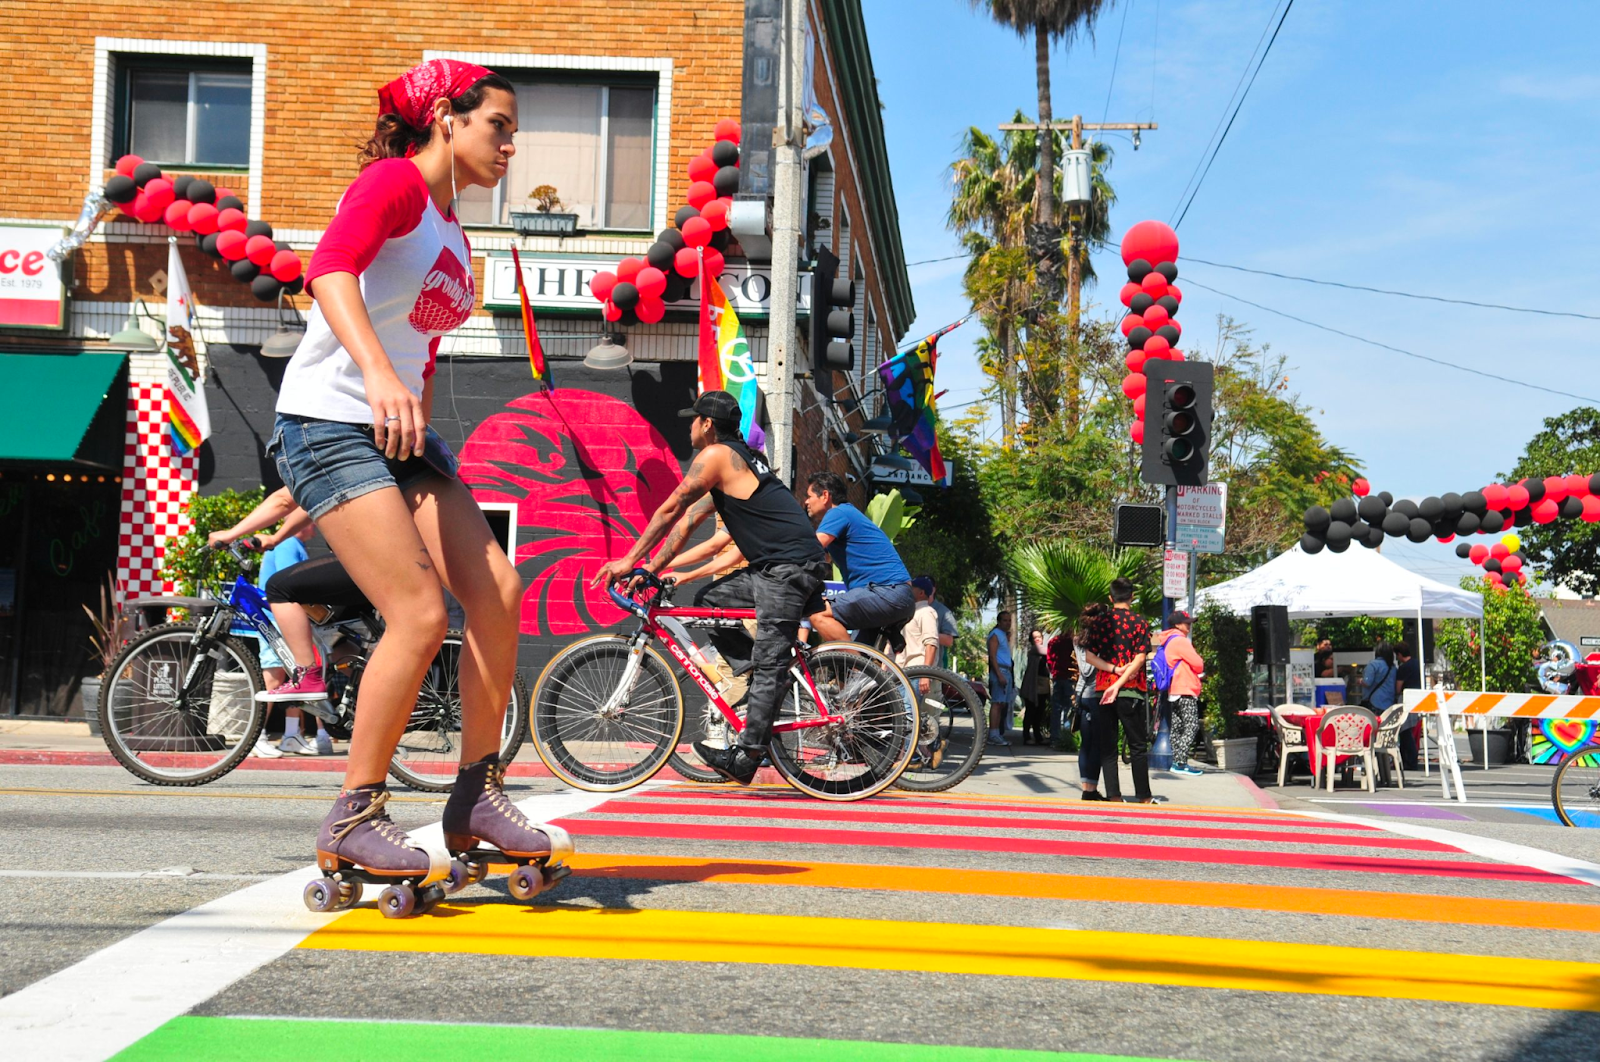
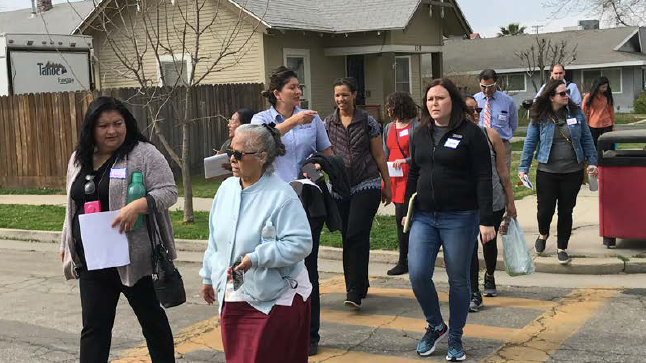
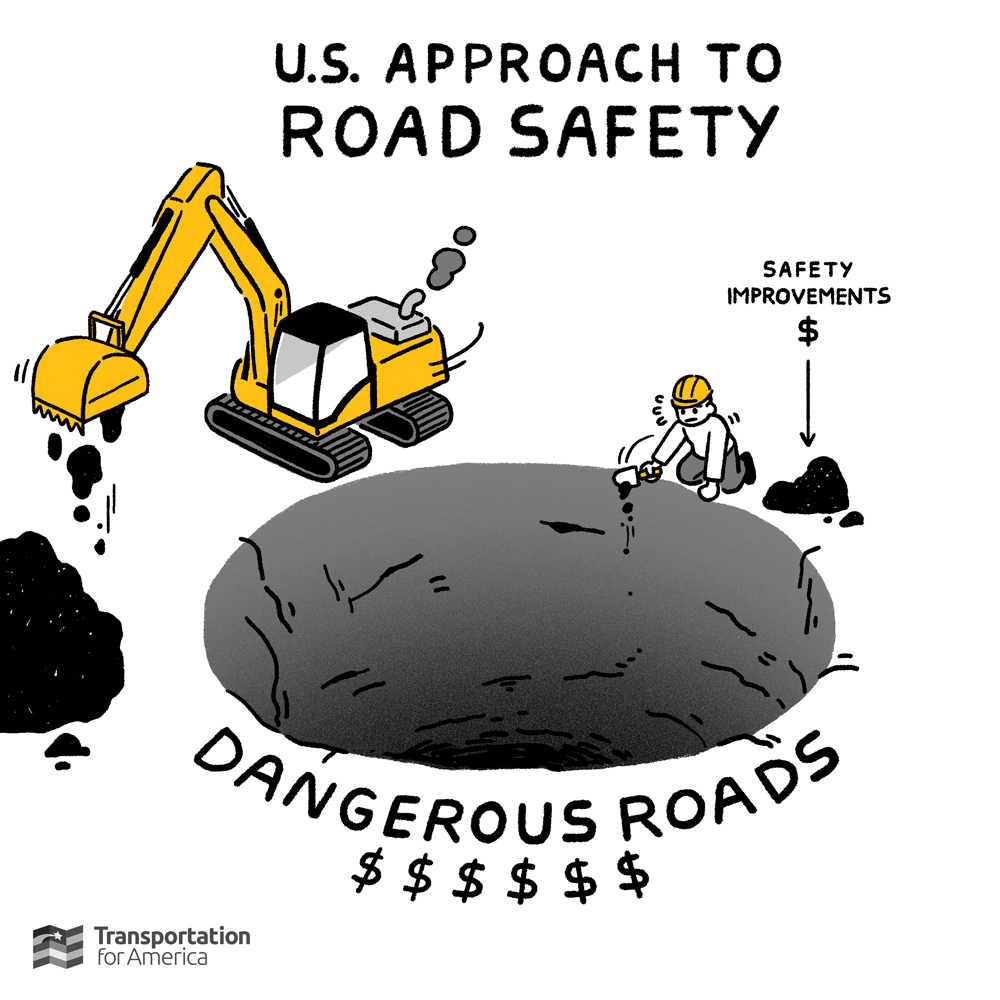
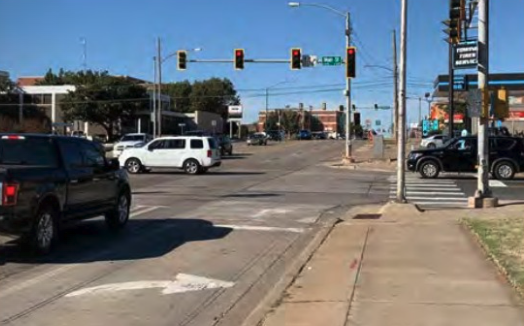
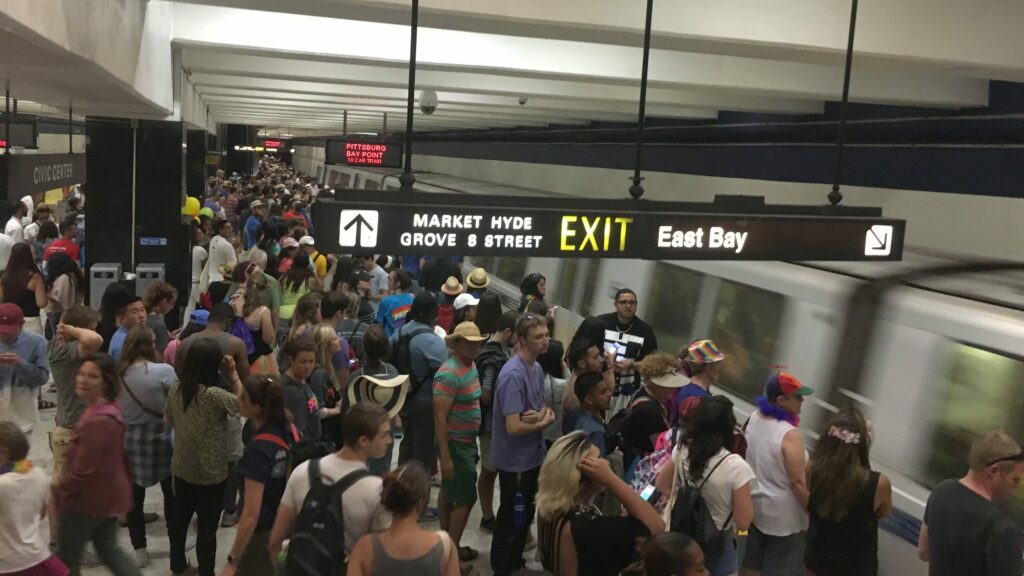

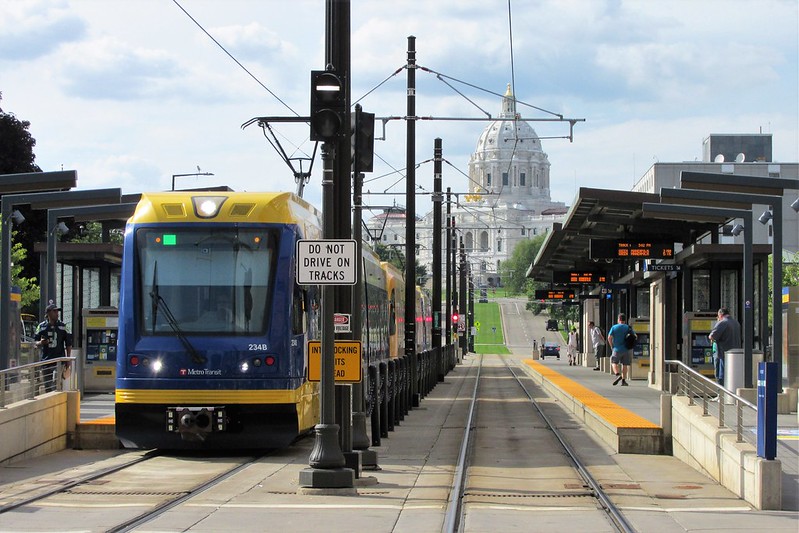