On January 9, T4A hosted a video call for its members. Here are the slides from that call.
Member Policy Memo: Final FY2020 THUD Appropriations Bill
On December 16, 2019 House and Senate negotiators released the text of an agreement, also known as
a “conference report” on FY20 appropriations. The agreement is comprised of two bills, with the THUD
appropriations included in H.R. 1865, the Domestic Priorities and International Assistance
Appropriations Minibus. The House and Senate approved the bill, and the President signed it into law before the current continuing resolution (CR) with temporary funding levels for federal agencies expired on December 20. Here is the analysis from our policy team provided exclusively to members.
Business groups urge Congressional support for transit funding
The business community gets it—public transportation is critical for the strength and growth of local economies and federal funding for transit is needed to get projects off the ground. In a letter to Congress, members of the Chambers for Transit coalition called for fully funding the nation’s largest grant program for public transit and reorienting the entire federal transportation program around clear goals and priorities.
Ahead of striking a deal to fund the government for the next year, the business community spoke out about the need to fund transit. A letter from members of Chambers for Transit, a coalition of chambers of commerce, economic development groups, business districts, and other business groups, laid out the case for robust federal support for public transportation:
“Public transit is critically important to the economic competitiveness and vitality of our local communities. Transit provides affordable access to jobs for many workers. For businesses, transit provides access to employees on a day-to-day basis.
“Over the long-term, investing in public transit is part of an integral strategy for creating the kinds of communities where many people want to live, with vibrant walkable neighborhoods and a diversity of transportation and housing options. This is critically important to our economic competitiveness because these are the places where businesses choose to locate so they can attract and retain a talented workforce.”
Their ask was twofold. Most immediately, they called for fully funding the transit Capital Investment Grant program in the next year, a program with bipartisan support that funds the construction and expansion of bus rapid transit, light rail, commuter rail, and other forms of public transportation. The U.S. Department of Transportation—the executive agency in charge of administering the program—has also been engaged in a well-documented attempt to undermine the program and delay the signing of grants. Therefore, these business groups also urged Congress to exercise their full authority to hold the agency accountable and ensure USDOT executes the program as intended.
Unfortunately, Congress made a $500 million cut to transit funding in this program for next year. The cut is a result of the diligent work by USDOT to slow-walk transit grants and make it appear as if the program was overfunded.
Beyond the immediate policy concerns is a long-term vision for federal transportation policy. The current 5-year federal transportation policy is set to expire in 2020 and Congress has barely begun to rewrite it. The signatories wrote:
“Nearly seven decades ago the federal transportation program set out with a clear purpose: connect our cities and rural areas and states with high-speed interstates and highways for cars and trucks and make travel all about speed. These brand new highways made things like cross-country and inter-state travel easier than we ever imagined possible. We connected places that weren’t well-connected before, and many Americans reaped the economic benefits. With the interstate system now complete, we’ve never really updated those broad goals from 1956 in a meaningful way despite diminishing returns and a lack of clearly defined priorities for this century.”
Despite the clear need for an updated vision and new policy goals, what Congress has produced so far is disappointing. Instead of a more fundamental rewrite that acknowledges how dramatically transportation has changed in the last few decades, legislators are largely tweaking policy around the edges.
These business leaders asked Congress to define new goals and priorities and write policy to support those priorities in the next long-term transportation authorization. The Chambers joined Transportation for America’s call to support the following three core principles for federal transportation investment:
- Prioritize maintenance
- Design for safety over speed
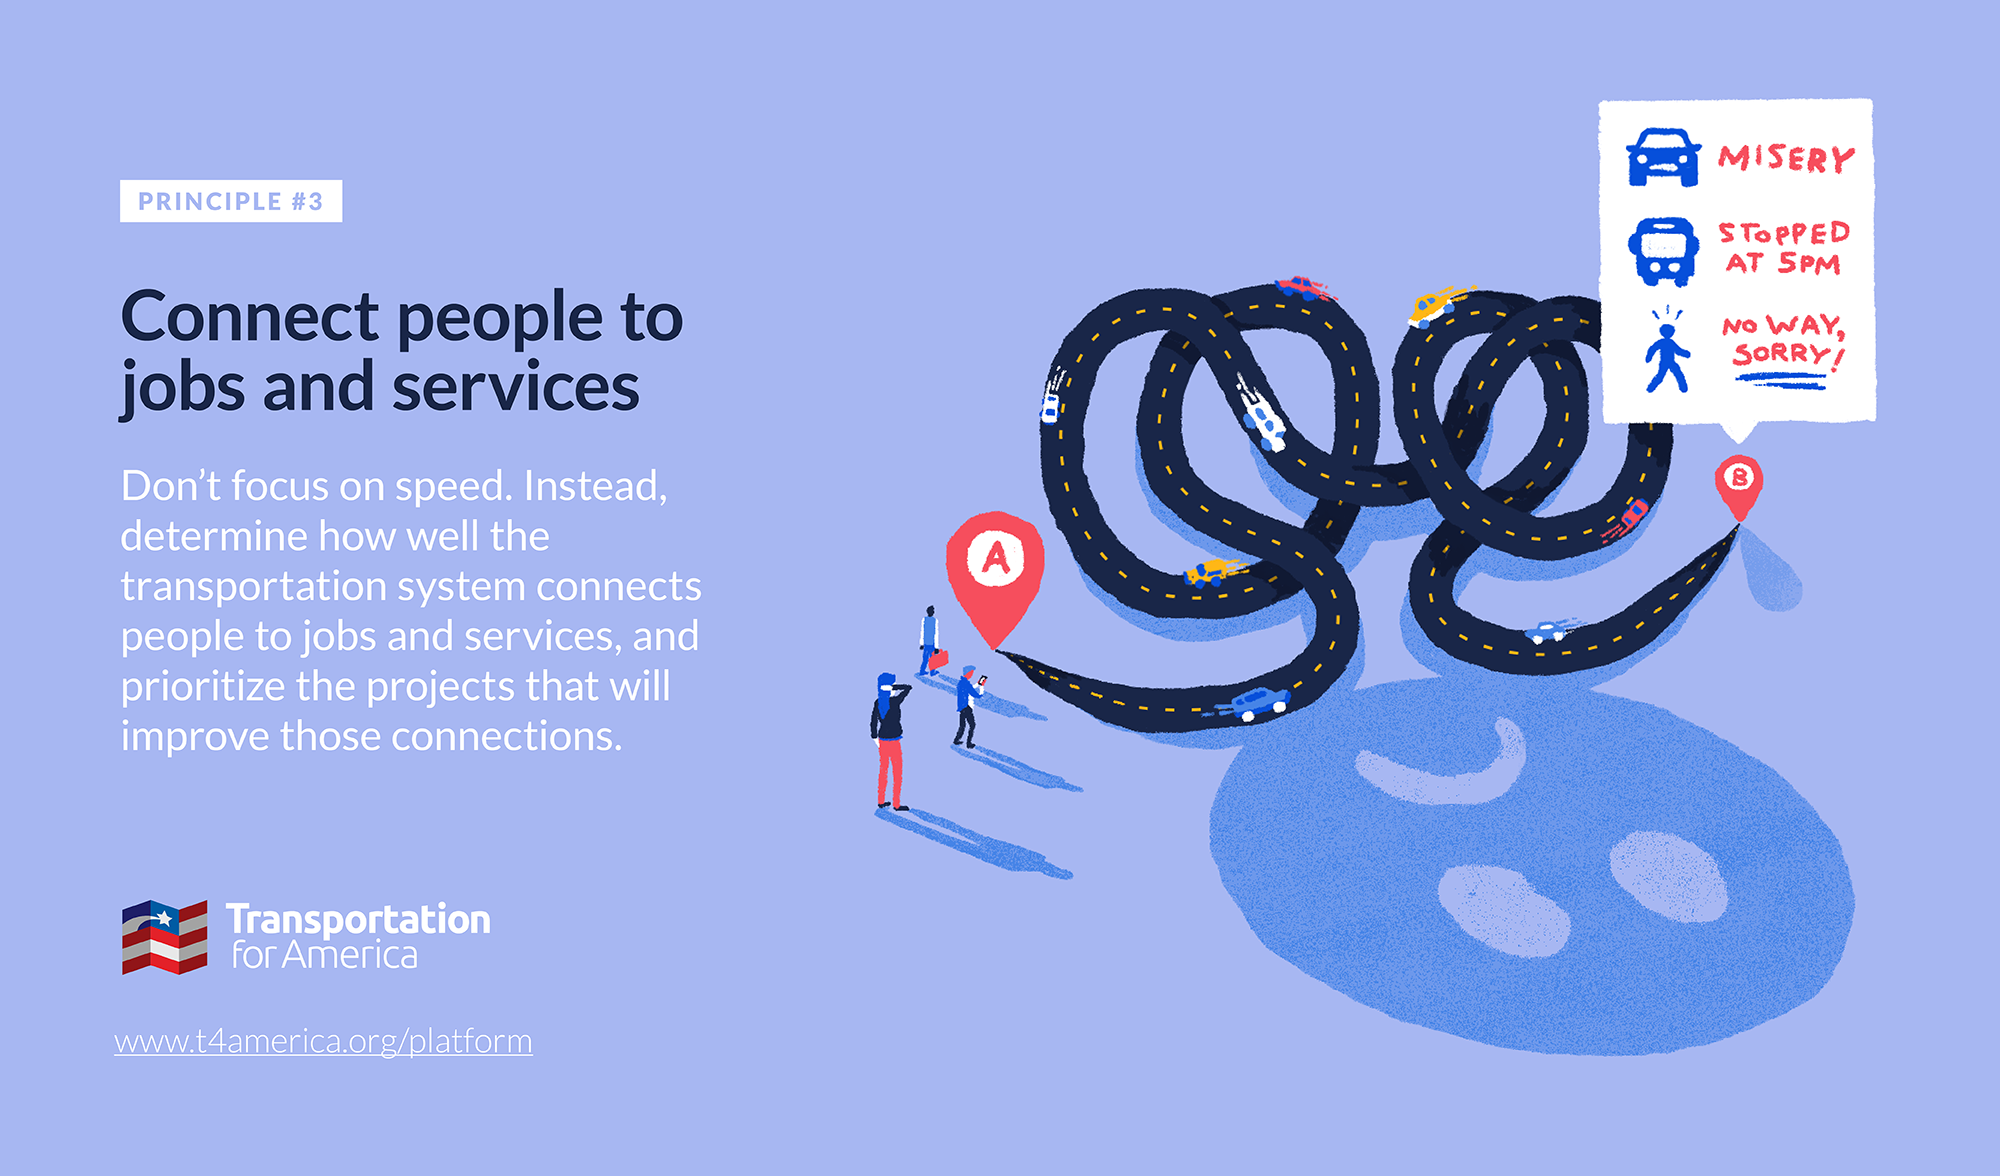
- Connect people to jobs and services
With new federal policy structured around those principles and robust federal funding for transit in the next year, communities around the country will be better positioned to become more economically vibrant.
You can find the full letter and the signatories here and learn more about each of the three principles proposed here.
Congrats USDOT, for a job poorly done
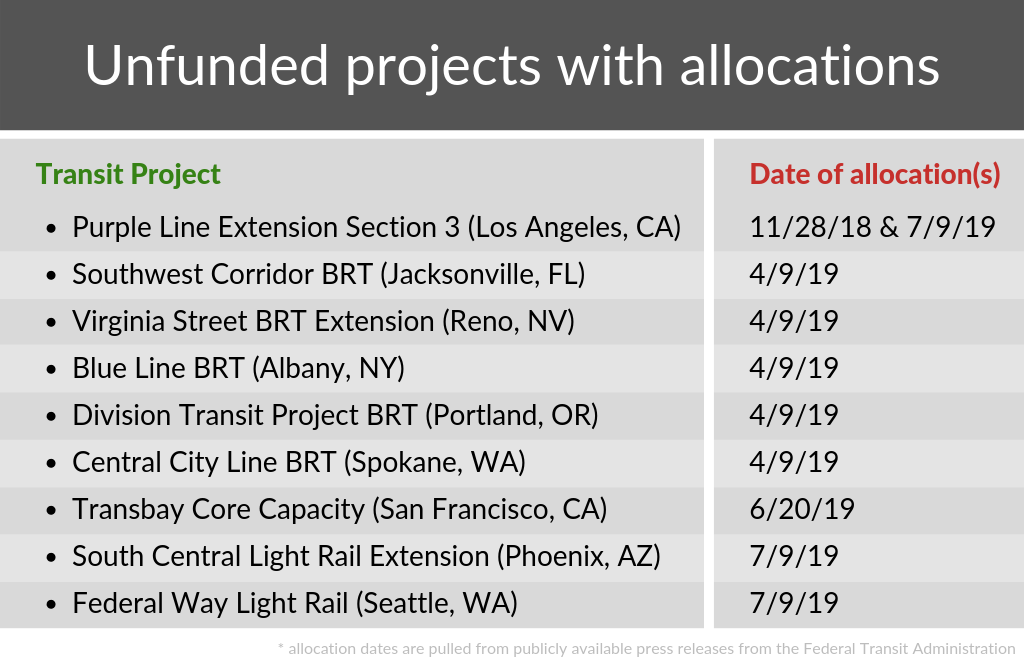
Congress required USDOT to spend its 2018 transit funds by the end of this year, and USDOT was poised to fail. But at the last minute, Congress bailed them out by easing the requirement. As the deadline approaches, USDOT is still sitting on hundreds of millions of dollars in grants that it refuses to award, unnecessarily delaying critical new transit projects.
The U.S. Department of Transportation is approaching an important deadline. After the agency proved that it couldn’t be trusted to execute transit grants in good faith, Congress imposed a December 31, 2019 deadline for “obligating,” or awarding, 85 percent of the $2.6 billion dedicated to the Capital Investment Grant program in 2018. That was 22 months ago. With only a couple weeks left in the year, USDOT has failed to hit that mark, but earlier this year, Congress blinked and bailed USDOT out by lowering the bar for them.
When initially passed last year, the deadline was an important, bipartisan signal that Congress was unhappy about USDOT ignoring the law, flouting congressional intent, and purposefully sabotaging transit expansion.
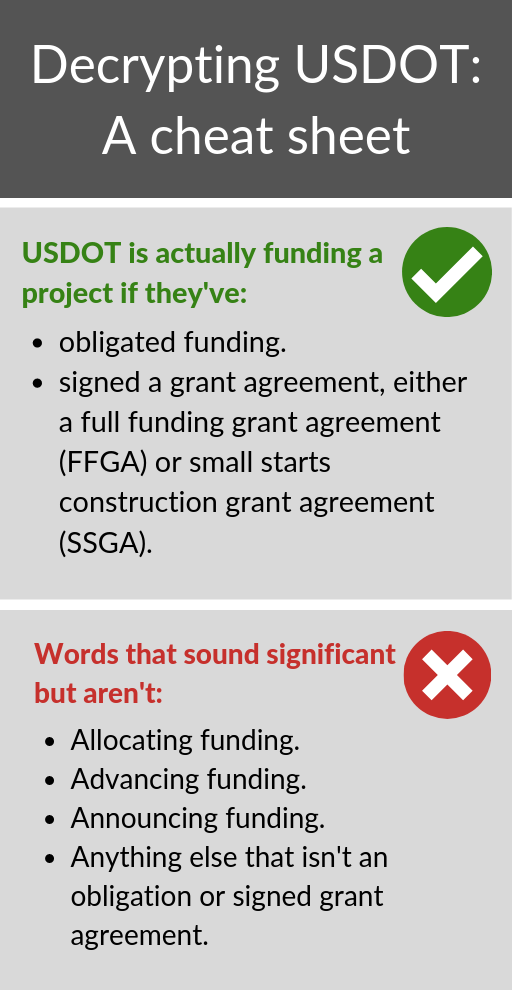
But Congress watered down this requirement recently to say USDOT only has to “allocate” funding—a relatively toothless standard. Allocation is not the same thing as obligation and just means that USDOT has made room in a spreadsheet for eventually spending the money on a particular project. It results in zero dollars actually going to build or improve new transit without additional approvals and action by USDOT.
In total, USDOT has failed to obligate more than $2.2 billion in funding for new transit projects since the Trump administration took office.
When it comes to FY18 dollars, though Congress threw them a lifeline, USDOT is still sitting on more than $668 million that it hasn’t obligated to transit projects. One of those allocations was made as far back as November 2018. These perplexing and avoidable federal delays seriously disrupt local project timelines and budgets.
As of publication, USDOT has only awarded (i.e. obligated) about 77 percent of the 2018 dollars Congress dedicated to transit grants that could be used to get new transit projects started across the country. But USDOT has “allocated” 98 percent of the 2018 grant funding available. That’s small consolation to the communities that have been waiting for up to nine months since they received an allocation on a USDOT spreadsheet for their shovel-ready transit projects to receive funding they can actually use.

Given the new standard, we should congratulate USDOT. They have successfully ignored Congress in order to push an anti-transit agenda that is broadly opposed on Capitol Hill and in the public—and they are going to get away with it. The bar has been lowered so much that USDOT can step over it without actually doing its job. Perhaps in the new year, the U.S. Department of Transportation will finally find its sense of purpose and start funding these critical transportation projects, and Congress will be able to find a way to hold USDOT’s feet to the fire. USDOT has already allocated the funding; it’s time to start spending it.
For more information about USDOT’s transit funding delays and how we got here, take a look back through our Stuck in the Station blog. and explore the Stuck in the Station resource.
House bill sets new standard for GREEN Streets
Last week, Rep. Jared Huffman (CA-02) introduced a bill that would measure and reduce greenhouse gas emissions and vehicle miles traveled on our roadways. This would be transformative.
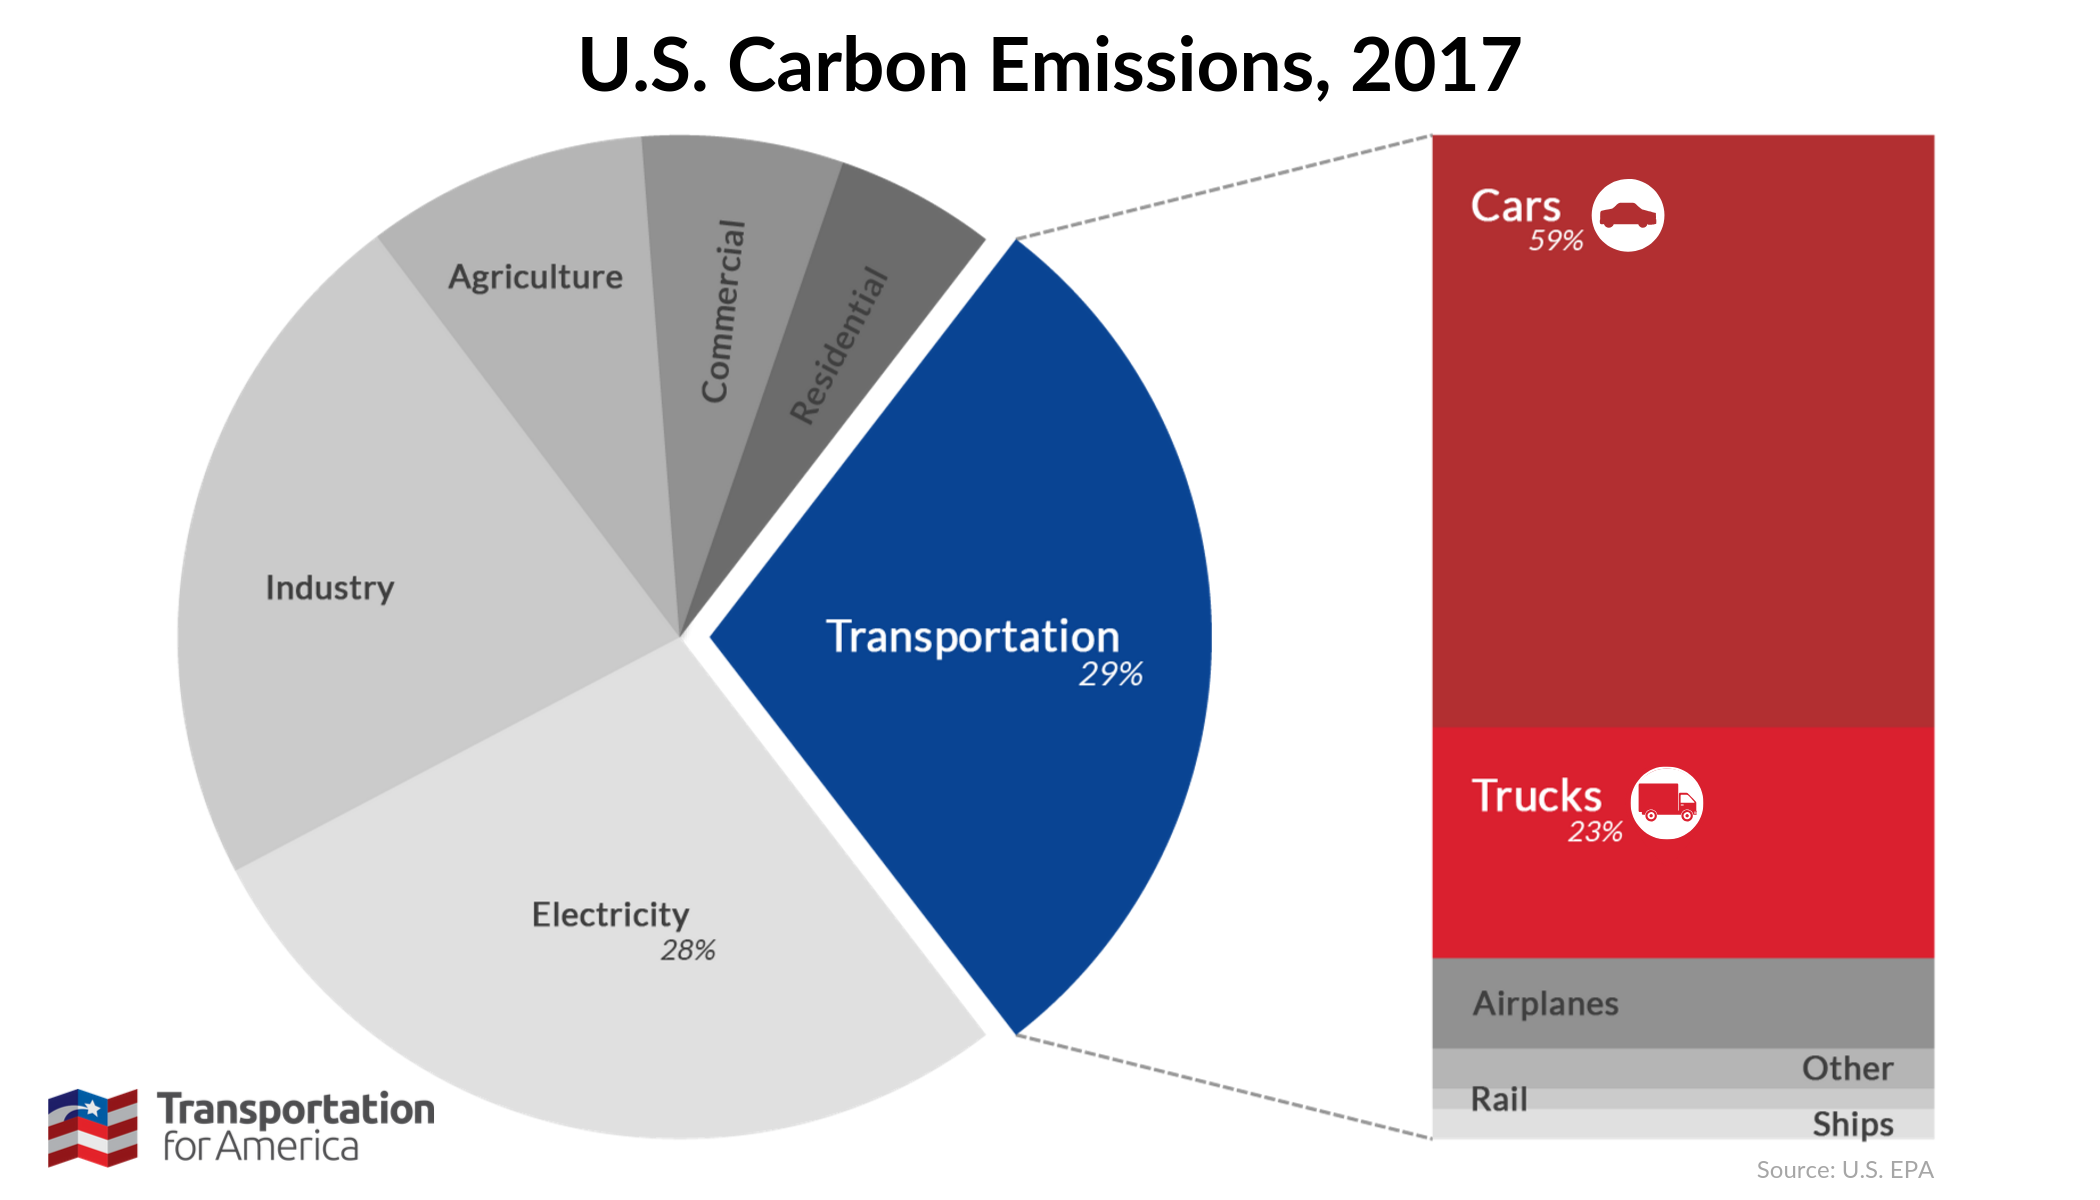
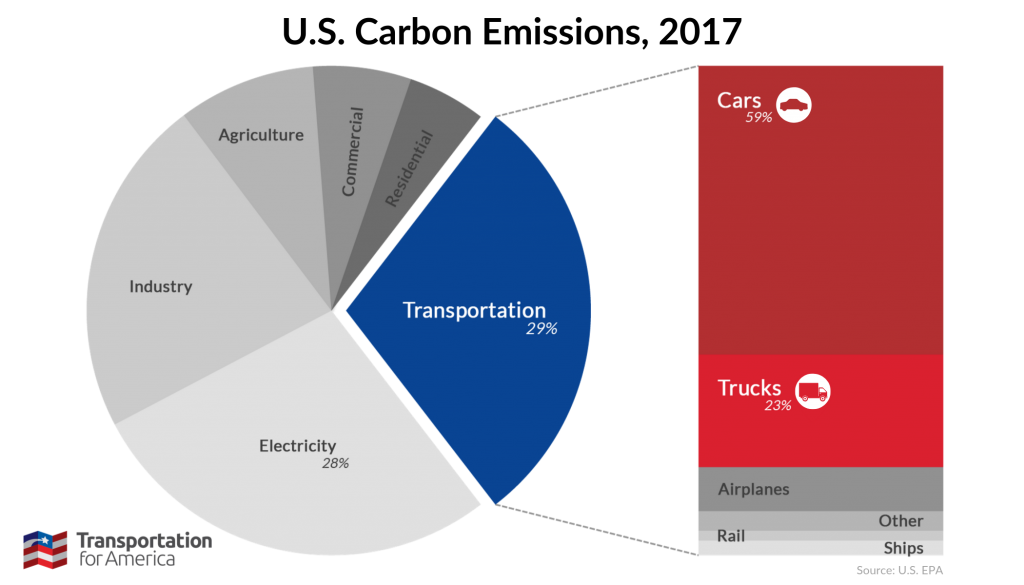
Transportation is the single largest source of greenhouse gases (GHG), contributing 29 percent of the United States’ total GHG emissions. The majority of these emissions come from driving. But right now, we don’t measure emissions on our roadways. Without measuring these emissions, we will never be able to reduce them.
Rep. Huffman’s new House bill—H.R. 5354, The Generating Resilient, Environmentally Exceptional National (GREEN) Streets Act—would change this. The bill, co-sponsored by Reps. Pocan (D-WI), Connelly (D-VA), Lowenthal (D-CA), Rep. Haaland (D-NM), and Blumenauer (D-OR), will create new performance measures and goals requiring that states measure and reduce vehicle miles traveled (VMT) and GHG in their transportation systems.
Senator Ed Markey (D-MA), along with Senators Carper (D-DE), Sanders (I-VT), and Durbin (D-IL), introduced companion legislation in the Senate earlier this year.
“Tackling climate change is going to mean moving away from the current model of more highways and longer commutes to a model of safer, healthier, and more resilient communities,” said Rep. Huffman, a member of the Transportation and Infrastructure Committee. “The GREEN Streets Act will be an essential component of this effort by transforming how we measure success in the federal transportation program and how we hold federal and state decision-makers accountable for reducing carbon pollution.”
To reduce VMT and GHG, states would likely have to employ a variety of strategies, including better transportation options and smarter land use. These strategies come with a host of additional benefits: less congestion, lower household transportation costs, safer streets, more attractive communities, and improved public health.
California has already taken steps to do something similar to what the GREEN Streets Act would require. California’s law SB 743 required the Governor’s Office of Planning and Research to identify new metrics for identifying and mitigating transportation impacts. For development projects, VMT is now the new metric for transportation analysis, replacing level-of-service.
We need new metrics to measure the success of our transportation system in a way that provides a more holistic, inclusive view of the system. The GREEN Streets Act is a huge step in the right direction, requiring states to begin measuring and reporting how far people are driving, the resulting emissions, and then working to reduce both. We need a new vision for our transportation system, and this legislation will help us get there.
TransportationCamp DC 2020 tickets are on sale! Join us at this “unconference” for transportation nerds on Saturday, January 11th at the Catholic University of America.
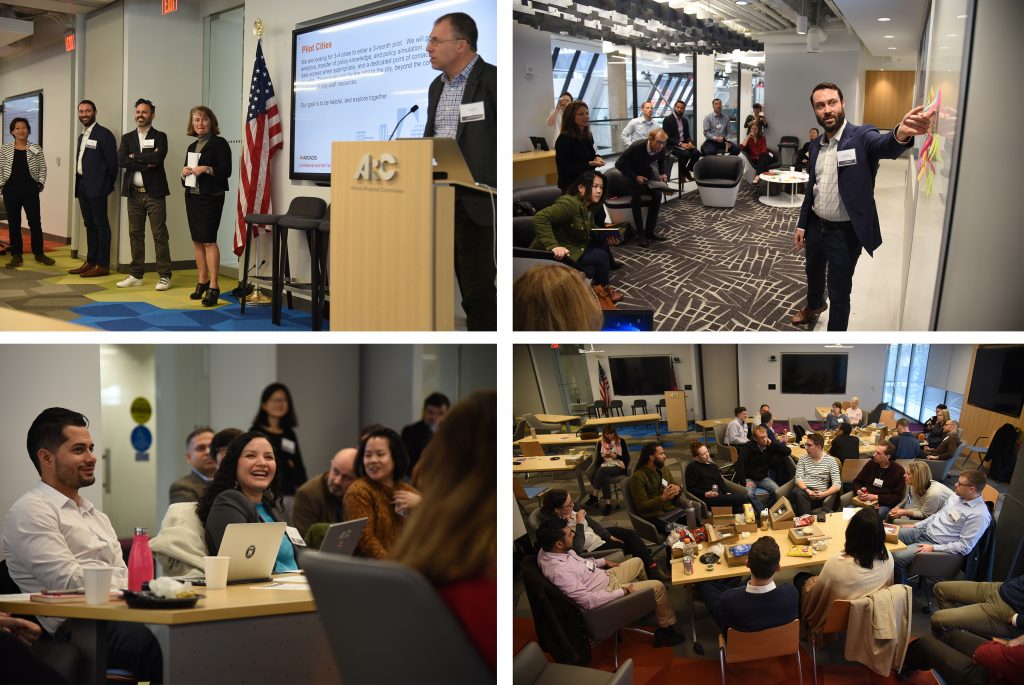
T4America selects 3 cities to launch curbside management pilots

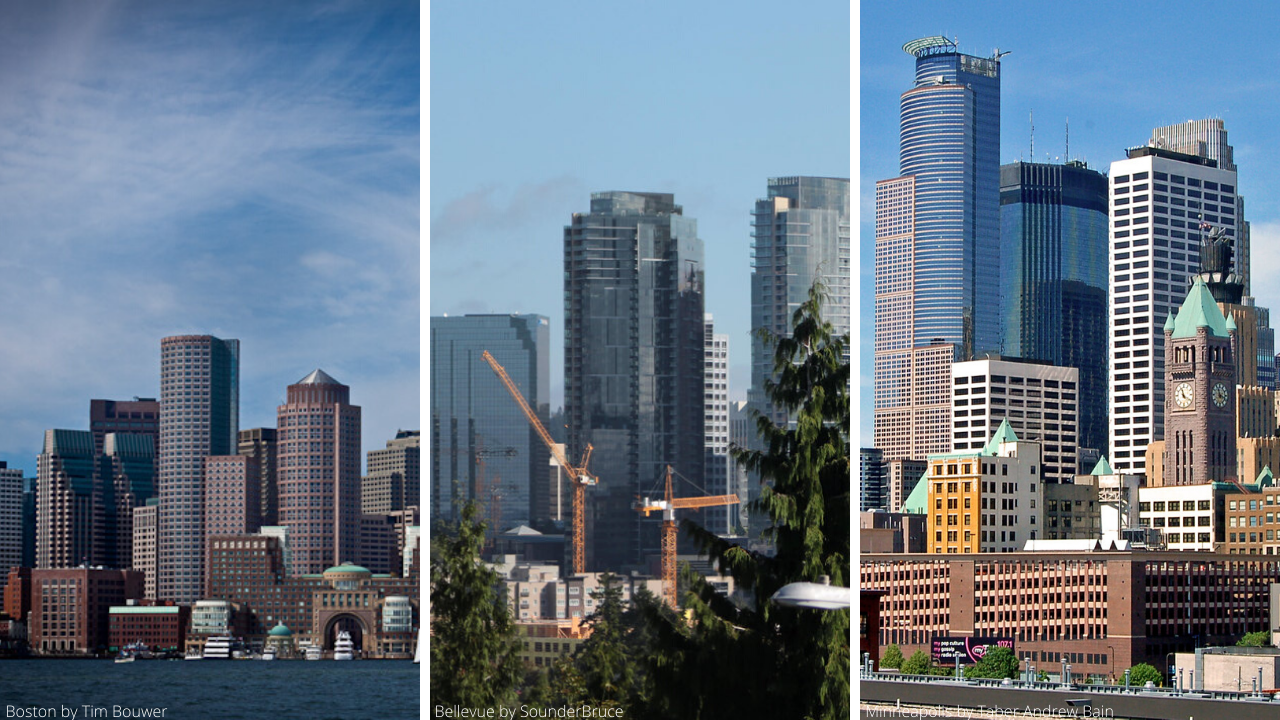
The three pilot cities. From left: Boston, Bellevue, and Minneapolis
WASHINGTON, DC – Transportation for America (T4America) is thrilled to announce that it has awarded three cities with funding and support to complete curbside management pilot projects. The three cities are Bellevue, WA; Boston, MA; and Minneapolis, MN.
The awards are a new component of T4America’s Smart Cities Collaborative. Now in its third cohort, the Collaborative is a year-long program for public sector transportation leaders to share their experiences with new mobility technologies and develop best practices to ensure that these services improve city life.
“The demands on curb space are rapidly increasing, but the policies and tools on how to share this limited resource are not, said Beth Osborne, director of Transportation for America. “We’re excited to work with these three cities to put what we’ve learned from the past two cohorts into practice and identify best practices and guidelines for better curbside management.”
T4America believes that peer-learning is the most valuable part of the Smart Cities Collaborative, which is why the three “pilot cities” will be joined by participants from over 10 other cities. The final list of cities participating as these “peer cities” will be announced next week.
“We are proud to be selected as one of only three cities nationwide focusing on how to best manage curbside space so that it meets the current and future needs of all users of city streets,” said Boston Mayor Martin J. Walsh. “I am encouraged that several of our recent efforts, such as piloting pick up and drop off space for rideshares and implementing performance parking, proved Boston’s willingness to find innovative solutions to our transportation challenges and helped to secure our participation in this joint effort.”
“With rapidly increasing job and population growth in Bellevue, managing the city’s curbside space is becoming increasingly important,” said Transportation Director Andrew Singelakis. “Participating in the Smart Cities Collaborative will help us meet this challenge. We’re honored to be selected as a pilot city and grateful for the strong support we received from King County Metro, Bellevue Downtown Association, Bellevue Chamber of Commerce and others.”
“Minneapolis is proud to continue our partnership with T4America and the Smart Cities Collaborative, which has helped us develop capacity to harness technology to reach our transportation goals, “ said Robin Hutcheson, Minneapolis Public Works Director. “We are excited to be selected as one of three pilot cities in the 2020 cohort. With this partnership and assistance we will develop and implement strategies to address the changing nature of curbside use, as well as learn from and share our learnings with the other participating cities.”
The third round will officially begin in February 2020. Learn more about the Smart Cities Collaborative.
Trump’s USDOT BUILDs even more roads
Federal grants for multimodal projects announced this month are decidedly not multimodal. As our research has shown previously, the Trump administration has dramatically undermined this grant program by funding traditional road projects that could otherwise already be funded by states, siphoning resources from other, harder to fund projects—the original intent of the program. But the U.S. House has adopted some policy changes to try and salvage some of what made the BUILD program so popular under the Obama administration.
Recently, the U.S. Department of Transportation (USDOT) announced $900 million in BUILD grants to fund transportation projects around the county. Unlike many federal grant programs, BUILD grants are uniquely flexible—any government entity can apply for funding on almost any kind of transportation project, making worthy multimodal projects and complicated projects that cross jurisdictions easier to pay for.
The BUILD program was created under the Obama administration—and originally named TIGER—but after taking over, the Trump administration has more or less ignored this unique flexibility and turned the program into a subsidy for run-of-the-mill road projects that could be built with some of the billions states get each year for roads and highways. The awards released two weeks ago are further evidence of this trend.
We explored these changes last year with an in-depth analysis showing how the Trump administration has dramatically shifted priorities.
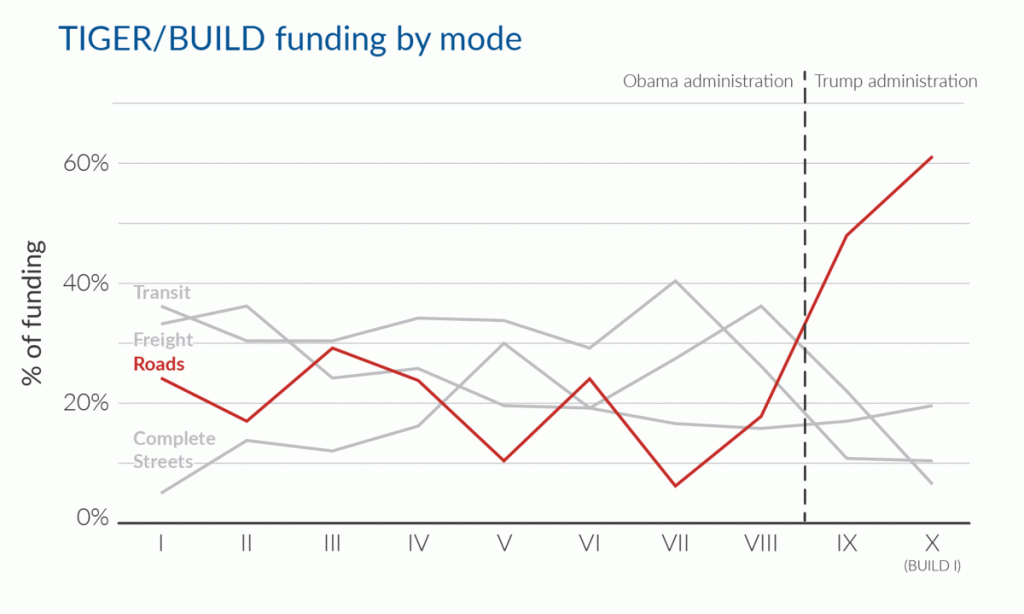
In the two most recent rounds of TIGER/BUILD awards—the first two years the program was managed by the Trump administration—only about 10 percent of funding went to transit projects. This is a big departure from the previous eight years when transit projects received between 28 and 40 percent of funding. Conversely, the share of funding dedicated to traditional road projects has grown to all-time highs; in 2018, road projects—most of which are eligible to receive normal formula dollars from their state—received more than 60 percent of the funding for the first time, after hovering below 30 percent for years.
2019 is just more of the same. According to a quick analysis of the projects selected, more than 70 percent of the funding went to conventional road and bridge projects—a huge share for a program still billed as an opportunity “to obtain funding for multi-modal, multi-jurisdictional projects that are more difficult to support through traditional DOT programs.”
But these changes haven’t gone unnoticed. In that same analysis—Taming the TIGER—we included some simple policy recommendations for Congress to fix the BUILD/TIGER program specifically and to improve the federal transportation program broadly. Some of these recommendations have been taken up by the U.S. House in their most recent annual transportation funding bill. Among the changes we’ve advocated for are:
- A set aside of $15 million for planning grants and requiring the USDOT secretary to award planning grants with an emphasis on transit, transit-oriented development, and multi-modal projects.
- A doubling of the maximum award to $50 million.
- A consideration of project benefits beyond its physical location in an urban or rural area to the fullest extent to include all relevant geographic areas.
These are good recommendations, but they were not included in the Senate’s version of this annual transportation funding bill. For the House language to be included in the final bill, it needs to be accepted in the conference committee when the House and Senate reconcile the differences in their bills.
When Congress finally passes their funding bills (repeatedly hung up due to disagreement about funding for a border wall), incorporating the House’s proposed changes to the BUILD program will help it accomplish its stated goals despite the administration’s efforts to use it as a way to give states just a little bit more money to spend on the same old projects.
Here’s what happens when Jarrett Walker takes over your Twitter account
A week ago, we gave the experts at Jarrett Walker + Associates the keys to our Twitter account to explain what a transportation system oriented around improving people’s access to jobs and services (not increasing vehicle speed) actually looks like.
Last week was “Connecting people to jobs and services week” on our blog, where we focused on explaining our third principle for transportation investment. As we learned when brainstorming ideas for the blog for this week, the concept of measuring transportation success by access, not vehicle speed is often a tricky one for people to wrap their heads around.
So who better to explain how far we’ve deviated from transportation’s purpose—to connect people to opportunity—and how to get back on track than transit planner Jarrett Walker? Walker and his team are famous for communicating the “geometric truth” (as our outreach director Chris Rall calls it) of transit projects, helping cities across the world align their land use with transit goals.
Check out the highlights of the takeover below. And tune into our Twitter account for more takeovers and tweet chats!
Transportation is a derived demand with no value in itself – we don't commute for the fun of it. The value of transportation comes from its ability to expand people's freedom.. to connect people with opportunity. The more efficiently we can do that, the better -JWA @humantransit
— Transportation for America (@T4America) November 19, 2019
This map shows where you can get in 45 mins on transit from somewhere in Miami. If you're a busy person on transit, the edge of the blue blob is basically the wall around your life. Beyond it are places you can't visit, jobs you can't hold. How can we make you more free? -JWA pic.twitter.com/OXW00w31pg
— Transportation for America (@T4America) November 19, 2019
You can make similar travel-time maps for transit, walking, cycling, even driving, and they all work the same way. Ultimately, you connect people to more opportunity by A) Expanding the area that you can easily reach B) building more opportunities within that area. -JWA pic.twitter.com/7XLyG0K6Xi
— Transportation for America (@T4America) November 19, 2019
Here's the problem: we can never make travel fast enough if we keep putting new jobs/services even farther. Building vast highway (or transit) networks to connect ppl w/ opportunity is useless if they keep locating farther and farther away.-JWA https://t.co/M4MxHVkEtY
— Transportation for America (@T4America) November 19, 2019
If our goal is to connect people to the most opportunity possible, we should do what it takes to encourage more residents and jobs to locate in highly accessible places. For transit that is dense, linear corridors. We call this the Ridership Recipe. -JWA https://t.co/GJFXAWyzT5
— Transportation for America (@T4America) November 19, 2019
The way we invest in urban transportation is needlessly adversarial because it’s a simple problem: cities have little space. Cars are big. Big things don’t fit in little spaces. So in cities, more freedom means investing in walking, biking and transit.-JWA https://t.co/4xjUQ6oatx
— Transportation for America (@T4America) November 19, 2019
“Voluntary safety assessments” for automated vehicles will result in more deaths
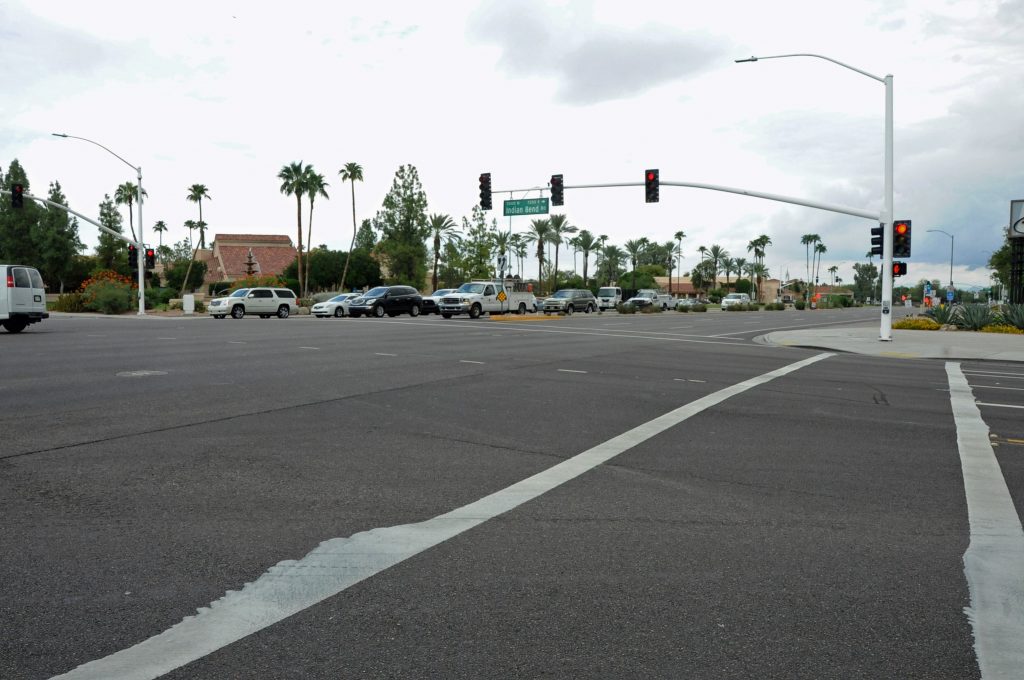
The National Transportation Safety Board agrees with T4America on automated vehicle safety: making safety assessments “voluntary” utterly fails to ensure public safety—and at least one person has already died as a result. The federal government’s current hands-off approach is unsafe for everyone, especially those outside of a car.

A dangerous intersection in Scottsdale, AZ, near Tempe. Photo by Lawrence G. Miller on Flickr’s Creative Commons.
Last week, the National Transportation Safety Board (NTSB) released its findings on Uber’s fatal 2018 Arizona crash, where 49-year-old Elaine Herzberg was killed by an automated vehicle (AV) while crossing the street with her bike.
“When companies test automated vehicles (AVs) without minimum safety standards to guide them, we are virtually guaranteeing that people will be killed unnecessarily by this technology —though heralded by boosters as the technology that will end all traffic deaths,” said T4America director Beth Osborne. “While Uber was at fault in this tragic death, we are also encouraged to see a federal agency take a hard look at the underlying causes, namely the lack of uniform safety standards and the willingness of those charged with protecting the public to abdicate that responsibility and allow these companies to set the rules.”
With no safety performance standards to speak of, Arizona—through an executive order from the governor—granted the ride-hail company the right to test AVs on all public roads, so long as a human driver is present to take over in emergencies. But that sole safety requirement failed Herzberg in numerous ways, the NTSB announced on Wednesday.
At the time of the crash, the human safety driver was watching a video on her phone—violating the company’s policy for that position. But according to the NTSB, “The federal government also bore its share of responsibility for failing to better regulate autonomous car operations,” writes the Verge reporter Andrew J. Hawkins. T4America would add that the State of Arizona might have established such a standard before allowing AVs on their streets but similarly failed.
During the hearing this week, NTSB board member Jennifer Homendy further berated the federal government’s safety ineptitude, calling NHTSA’s automated vehicle safety plan “actually laughable. …They should rename it a Vision for Lax Safety,” she said.
The nation’s foremost transportation safety experts just called our automated vehicle regulations “laughable.” So what is Congress doing about it? Nothing.
Fearing another safety-lite bill like the AV START Act—which lacked any safety performance standards, and merely contained “voluntary” safety assessments from automakers—Transportation for America and 46 other national groups wrote a letter to Congress spelling out exactly what needs to be in any future AV legislation to guarantee that this fledgling technology doesn’t kill people. That means concrete, enforceable performance standards, and the NTSB agrees. Such standards include “vision tests” to ensure an AV can properly identify and respond to its surroundings—including people crossing the street with their bikes, like Herzberg. (Uber’s vehicle was shockingly not even programmed to recognize Herzberg in this situation.) It also includes requirements that all AVs are built with proven safety technologies, like automatic emergency braking.
We sent that letter in August. This month, congressional committees released three sections of a forthcoming AV bill, which show that Congress is still not getting the message and is failing to prioritize safety above all else.
As a response, our coalition of national groups sent another letter to Congress criticizing the decision not to release the full bill and highlighting where these three sections failed. For example, the following essential components were not included in the released section: any mandatory rulemakings for necessary safety features to safeguard motorists and other road users; provisions for securing this advanced technology from cyberattacks; an explanation of how federal preemption of state laws would be avoided; how local policy control for safety on the roads would be ensured; a data sharing framework for consumers, cities, states, law enforcement, and federal regulators; adequate resources for NHTSA; and definitions of the terms used in the sections, among other issues.
Transportation for America, the 46 other national groups who joined us to fight for safety, and the NTSB agree that nobody wins when safety isn’t a priority.
Connecting people to jobs and services week: Hey Congress, we need your help to measure access
The Des Moines Area MPO wants to make a shift to award funding the transportation projects that do the most to improve the region’s resident’s access to jobs and services. But—like most MPOs and local governments across the country—its budget for the technology that makes this possible is small. It’s time for Congress to help local communities invest in the right projects.

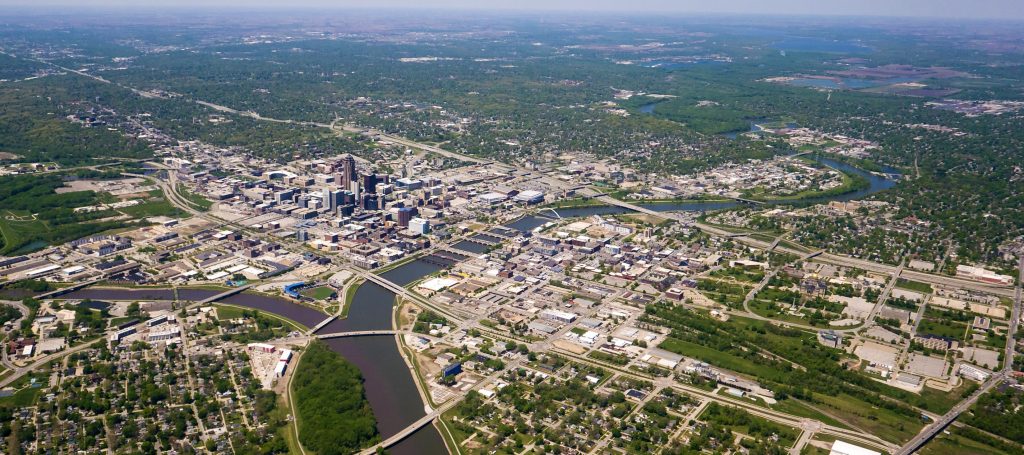
Ariels of Des Moines, Iowa from 10,000 feet May 6, 2017. USDA photo by Preston Keres
It’s “Connecting people to jobs and services” week here at Transportation for America. All week we’ll be exploring why improving access should be the goal of the federal transportation program—not vehicle speed. This guest post comes from Todd Ashby, CEO/Executive Director at the Des Moines Area MPO, which is trying hard to upend the broken status quo.
No matter how much funding a region has, there will never be enough money for every possible project. In Greater Des Moines, we want to guarantee that we spend our limited resources on projects that will do the most to connect our residents to their daily needs with affordable, efficient transportation.
Last year, Transportation for America came to Iowa to help the Des Moines Area Metropolitan Planning Organization (DMAMPO) do exactly that: create a scoring system to evaluate how proposed transportation projects work to achieve our goals, like improving people’s access to jobs and services (and not just for people driving cars). T4America inspired us to become a national leader in using performance measures to better align our project funding with regional priorities.
To us, improving access to jobs and services is the gold standard for transportation investment, and one of the very best ways to use this relatively new idea of performance measurement. With improving access as our goal—not increasing vehicle speed or throughput— we would prioritize the projects that would do the most to improve our residents’ connections to jobs and services.
But while very possible thanks to cloud computing and GPS, measuring access is expensive. We need data on where trips begin and end, where jobs are located, where people live, and where daily needs are located. This data is incredibly expensive. We also need additional resources and funding for models that help us process this data; the DMAMPO—like most other MPOs—has neither.
Congress could help usher in a new era of picking projects based on how they improve access rather than on outdated 1950s measures like level of service or vehicle delay, but the federal program today is not oriented around this goal, nor around equipping states and metros to do so.
This is why the DMAMPO asked Iowa Senator Joni Ernst to cosponsor S. 654, the COMMUTE Act in Congress. This bill—an acronym for “Connecting Opportunities through Mobility Metrics and Unlocking Transportation Efficiencies”—would create a competitive pilot program at the U.S. Department of Transportation to provide states, local governments, and MPOs with data sets to calculate how many jobs and services are accessible by all modes of travel.
Access to this data would transform how we are able to choose projects, empowering us with far better information to determine which proposed transportation projects would connect the most people to the highest quantity of jobs and services.
For a long time, ensuring high speed of travel within a corridor or minimal delay was a good enough rubric for spending billions of transportation dollars. It’s our goal to do something far better in Greater Des Moines. The COMMUTE Act would be a good start, but Congress can do so much more.
Connecting people to jobs and services week: The legislative path to make access the goal of transportation investments

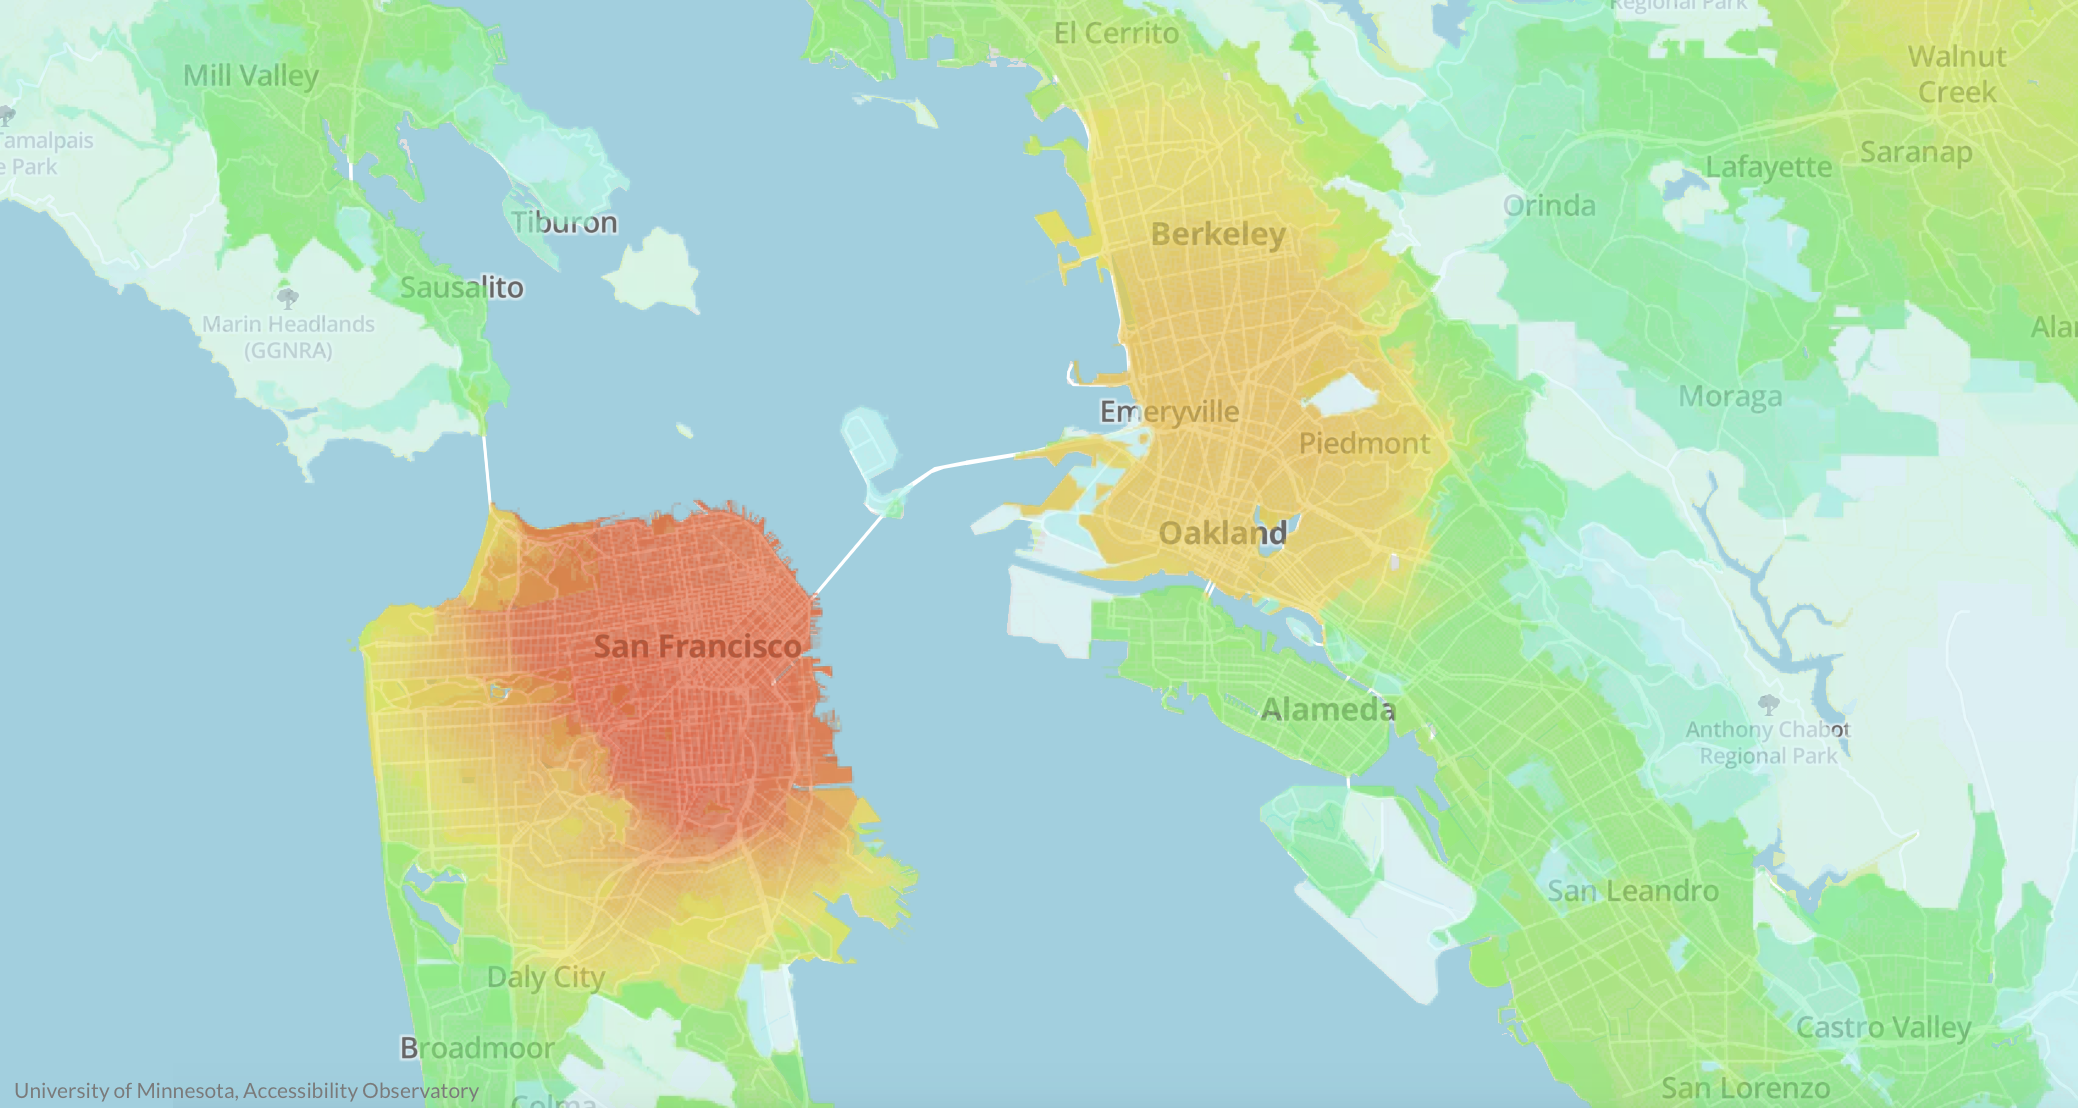 A heat map of bike accessibility in the San Francisco Bay Area. Lighter colors indicate fewer jobs can be reached within 30 minutes on “medium-stress” bike routes while darker colors indicate more jobs can be reached. Map via University of Minnesota Accessibility Observatory.
Measuring access—not vehicle speed—is smart policy. But local governments, states, and metropolitan planning organizations need support from the federal government to make this happen. It’s high time for Congress to make robust travel data and analysis tools available to transportation agencies.
It’s “Connecting people to jobs and services week” here at Transportation for America. All week we’ll be exploring why improving access should be the goal of the federal transportation program—not vehicle speed.
Having thousands of jobs within a region doesn’t do much good if residents don’t have convenient, safe, and affordable transportation options to reach those jobs. That’s why the concept of measuring whether transportation investments improve access to jobs and services can be transformative. Improving access to jobs and services, not merely aiming for high-speed vehicle travel within a corridor or minimal delay, should be the goal of our transportation investments.
But right now, the implicit goal of all federal transportation investments is to increase vehicle speed, not improve access. Changing the goal from vehicle speed to improving access requires rethinking our federal transportation policy from the ground up.
With the current authorization for federal transportation spending—the FAST Act—set to expire in 2020, it’s time for Congress to determine transportation policy for the next five to six years. Once passed, this legislation will set federal funding levels and policy for transportation for the bill’s duration. It is critical for this bill to reform the federal program to prioritize access.
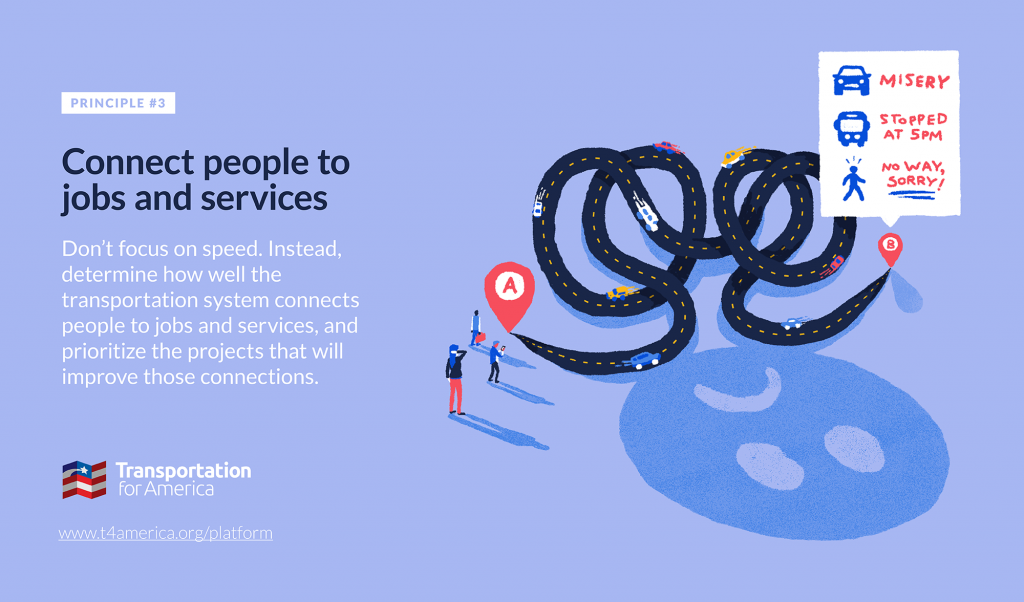
We need to determine how well the transportation system connects people to jobs and services, and prioritize projects that will improve those connections. Congress should require USDOT to collect the data necessary to develop a national assessment of access to jobs and services and set national goals for improvement.
To do this, Congress should:
- Determine national connectivity: USDOT should develop a national assessment of access to jobs and services, and set national goals for improvement.
- Measure the right things: apply accessibility to the federal transportation program in performance management and project selection.
- Update standards: Phase out outdated metrics such as level of level of service.
- Use 21st century tools: USDOT should provide accessibility data to states, MPOs, and local communities.
States such as Utah, Delaware, Virginia, California, Massachusetts, and Hawaii along with the cities of Sacramento and Los Angeles are already utilizing this type of data and seeing results.
Unfortunately, states and MPOs must currently pay to access this data while far less useful congestion data is made readily available by USDOT.
A bill before Congress would pilot destination access; let’s take it a step further
Earlier this year, members of Congress introduced the bipartisan Connecting Opportunities through Mobility Metrics and Unlocking Transportation Efficiencies (COMMUTE) Act in both the House and Senate. This legislation would pilot measuring access nationwide. We are grateful for the leadership of Senators Baldwin (D-WI) and Ernst (R-IA) and Congressman DeSaulnier (D-CA) along with Reps. Curtis (R-UT) and McAdams (D-UT), in the House.
The COMMUTE Act would create a competitive pilot program to provide five states, 10 metropolitan planning organizations (MPOs), and five rural planning organizations with data sets to calculate how many jobs and services (such as schools, medical facilities, banks, and groceries) are accessible by all modes of travel. These data sets will also be made available to local governments and researchers.
In July, Congress took an important first step on transportation policy when the Senate Environment and Public Works (EPW) Committee approved its portion of a surface transportation reauthorization bill (America’s Transportation Infrastructure Act). We were happy the bill included a pilot program based on the COMMUTE Act to help a select group of states and metros measure whether or not their investments are connecting people to jobs and services. This demonstrated the bipartisan support for the common sense idea of measuring the success of our transportation system by whether it creates access to jobs and services.
But we can and should do more. Access to jobs and services has to be the core of any transportation authorization. Support for the pilot in the Senate indicates an opportunity to do much more. That is why we are urging Congress to go further and require USDOT to collect the data necessary to develop a national assessment of access to jobs and services and set national goals for improvement.
The House of Representatives will soon release its proposed surface transportation authorization. This is an opportunity to demonstrate a new vision for transportation, based on modern data and valuing what really matters.
It’s time for Congress to act and hold ourselves accountable for improving access.
Connecting people to jobs and services week: Rethinking shared mobility to prioritize access

 Transportation is fundamentally about connecting people, but America’s transportation system focuses on moving cars instead. Madlyn McAuilffe from the New Urban Mobility Alliance (NUMO) wrote this guest post about the consequences of our misguided priorities and how we can get back to focusing on building places and transportation networks for people.
It’s “Connecting people to jobs and services week” here at Transportation for America. All week we’ll be exploring why improving access should be the goal of the federal transportation program—not vehicle speed.
Transportation has always been about connection—connecting people to places, resources, experiences, and of course, other people. Moving people—facilitating access—was the original goal. Transportation was simply the means by which we reached our destinations.
We’ve journeyed a long way since the advent of the automobile, and somewhere along the way toward creating a national transportation system, our priorities shifted to focus not on moving people but on moving cars.
Living with the consequences
The consequences of American auto-centrism have been devastating and far-reaching. Despite an urgent global climate crisis, transportation is the primary source of emissions in the U.S., and a growing source as auto sales (particularly for SUVs and trucks) rise
We’re told by $40-billion worth of endless, highly-stylized auto commercials that cars represent independence, yet they often are the largest purchases many American households will ever make. 72 months of payments, thousands of dollars of high-interest debt, and economic dependence on an inefficient and dangerous mode of transport can hardly be called freedom.
Even the metrics we use to determine the success of our transportation system are off. We measure the efficacy of our roads and policies by speed traveled (i.e., level of service) rather than by the number and diversity of people who can safely and affordably access jobs, school, healthcare, grocery stores, and community centers. Yet rather than reimagine how we fund transit projects or investigate zoning land for multiple uses, we spend outrageous amounts of money on adding lanes to highways, inducing demand for driving, and then condemning commuters to become stuck in hellish congestion.
We often hear about “crumbling infrastructure,” but rarely mentioned is the fact that transportation decision-makers invariably decide and are incentivized to expand the network of roads that are already poorly maintained rather than fix what we have already built.
It doesn’t have to be this way, but how do we begin digging ourselves out of the ditch we have created?
Any roadmap forward starts with rethinking the values underlying how we do transportation, land use, infrastructure, labor, and more. Change the values, change the system; change the system, change the world. Sounds easy, right?
The principle of the thing
A tectonic transportation value shift is already underway, though—and unsurprisingly, it’s a team effort.
Early 2017 witnessed the debut of the Shared Mobility Principles for Livable Cities, a framework for policymakers, leaders, influencers, urban designers, academics, advocates—everyone—to guide stakeholders toward the best outcomes for all people. Developed by Robin Chase and a founding coalition of global NGOs including Transportation for America, the Principles encourage us to rethink how we plan not just our mobility, but also the design of both our transportation system and cities to value inclusivity, connectivity, and shared mobility that is sustainable and just.
The first three Principles—planning cities and mobility together; prioritizing people over vehicles; and supporting the shared and efficient use of vehicles, streets, and land—are key to understanding the Shared Mobility Principles as a whole. The remaining Principles stem from the core value of access, which must also serve as the metric by which any transportation, infrastructure, or other development project must be reviewed. What opportunities will this proposed transit-oriented development project provide and to which communities of people? Will this mobility hub provide first/last-mile solutions in transit deserts? Which transportation investment will create improved access to jobs, school, and other destinations for the greatest number of people: an additional lane for single-occupancy vehicles or a dedicated bus lane for thousands of passengers each day?
Admittedly, the Shared Mobility Principles are ambitious. Relearning everything we’ve come to accept as a given in planning, developing, designing, and maintaining not just our transportation system but cities themselves is daunting. To create lasting change that reaches and improves the lives of everyone, however, we must start by rethinking our values as well as what and whom we prioritize with the policies we craft and the projects we undertake. After all, cities are built for people, not cars. If people can’t access what they need where they live…we’ve failed.
Connecting people to jobs and services week: What do destination access metrics look like in action?

Academics have long pointed to a metric called destination access—called by Transportation for America “access to jobs and services”—as a better decision guide than older, conventional measures that focus mainly on the speed of cars. But what does this new practice look like in real life, and where and how is it already being used?
A man loading a bike onto a bus in Arlington, VA. Photo from the Arlington Department of Environmental Services.
It’s “Connecting people to jobs and services week” here at Transportation for America, so Eric Sundquist, the director of our partner organization the State Smart Transportation Initiative, wrote this blog post explaining how measuring access actually works.
When we measure destination access, which takes into account distance of travel as well as speed, we can better assess how easily travelers can reach their desired destinations. And we can make predictions about how people will choose to travel. It’s long been a better theoretical way to measure success, but the data has been expensive and it’s largely remained the purview of academics.
Now destination access has broken out of the ivory tower.
Newly available “big data,” much of it collected for use by GPS navigation software and devices—think Apple or Google Maps—has made measuring destination access possible in practice.
Created by a 2014 bill that “revolutioniz[ed] the way transportation projects are selected,” according to then-Governor Terry McCauliffe, the Virginia DOT has been using destination access to help make investment decisions through three rounds of transportation project funding.
How does this new system work in Virginia? VDOT assesses a wide range of projects together—highways, transit, walking, biking and demand-management projects—based on how they improve access to jobs and other common destinations, such as shopping, schools, and restaurants. After calculating destination access, VDOT then divides by cost of the project to the state, so that small, rural projects can compete with massive urban ones. In essence VDOT scores projects on destination access per dollar of investment, and this has led to a major shift in which projects they fund each year, increasing the benefits for each dollar invested.
For example, Virginia recently scored a project near the small town of Hopewell that would connect two regional bike-walk trails using a shuttle bus across a highway bridge with minimal shoulders and no sidewalks. The project scored modestly on destination access, but because it would cost only $44,000—very little by transportation infrastructure standards—it ranked first in its district and ninth out of 433 projects statewide. This is the type of small but vital project that can lose out when state agencies are so heavily focused on simply improving vehicle speed and avoiding delay.
Because we can use all this data to assess destination access across auto, transit, walking, biking modes, we can also combine those scores to predict how changes to the built environment will affect outcomes, such as mode share. Will a project lead to more or less driving, transit ridership or active transportation? Using destination access helps us make these forecasts.
More examples of measuring access to jobs and services
Working with the State Smart Transportation Initiative (SSTI), for example, the City of Eau Claire, WI., recently used destination access to assess transit investment options, including bolstering the city’s downtown circulator, extending service to future development sites, and pairing those investments with strategic transit-oriented development (TOD). The analysis not only let Eau Claire decision-makers understand the relative benefits of different transit expansions—including which residents would be affected and how much their access to jobs and other destinations would increase—but also showed that TOD could provide considerably larger benefits, compared to transit investments alone. This information will inform the city’s new transit plan and its recently announced climate goals.
This new method can be used to evaluate how proposed transportation projects would impact access to jobs and services, but it can also help local leaders envision potential future scenarios as they make broader long-term plans for both transportation and land use.
In nearby La Crosse, WI, the city leaned on destination access metrics to estimate the effects of various development scenarios. If the city directed new development to three proposed sites near downtown, would it reduce the need for auto travel and boost transit ridership? The SSTI analysis found that the answer was yes, a result that city officials will employ going forward in transportation and land use decision-making.
Ten years ago, we never would have been able to orient federal transportation spending around the goal of improving access to jobs and services. The data and other resources just weren’t there yet. But now, as both states and localities across the country take giant steps to prove that it’s not only possible but a smarter way to choose where and how to invest in transportation, it’s time for Congress to respond by making this a priority.
To connect people to jobs and services, we need to measure what matters: people

Today we largely decide which transportation projects to build and where to build them based on how much delay vehicles experience, while entirely ignoring everyone not in a car in the first place. By ignoring walking, biking, or taking transit, we’re ignoring the impacts on everyone not using a car, particularly low-income persons, people of color, and older adults.
It’s “Connecting people to jobs and services week” here at Transportation for America. All week we’ll be exploring why improving access should be the goal of the federal transportation program—not vehicle speed.
A century ago, we didn’t have GPS and GIS mapping systems. Google Maps on a handheld computer (i.e. your cell phone) that would allow you to instantly look up directions to anywhere with any mode was still in the realm of science fiction. Given those limitations, when the country started spending billions to build a national network of highways—and a bunch of streets to feed cars onto those highways—the easiest thing to measure was vehicle delay. Free flowing traffic = good; delay = bad. If cars were getting stuck in traffic, it was a sign that we needed to build more or wider roads, or redesign an intersection to improve traffic flow.
This was the most sophisticated proxy for success we could manage for many decades but this myopic focus on vehicle speed also ignored anyone outside a car and it actively undermined other transportation options. People walking or rolling were relegated to sidewalks (if they existed) or banished from the street altogether. Transit was now being mired in traffic and wide, free-flowing roads lured those who could afford a car onto the open road. And if you happened to live in the path of a future freeway—a path often selected because an area was deemed undesirable based on racist redlining policies—your home or business was razed. What remained of formerly walkable and vibrant Black neighborhoods were suddenly cut off from the rest of the community to make room for cars.
None of these people outside of personal vehicles are considered or counted when we use vehicle delay to measure the effectiveness of our entire transportation system. The ability of people walking, rolling, biking, or taking transit to get where they needed to go is sacrificed for people who can afford and operate a car.
This old measure hasn’t scaled very well, either. As more and more Americans began driving, traffic became more common. We hollowed out city centers in a quest to keep cars moving and then give them a place to park. Today, we still hear calls to widen roads to keep traffic moving. The problem, as it’s presented, isn’t that we have too many cars, but not enough road space for all those cars.
With technology available now, we can figure out where people are trying to go, we can measure how easy or hard it is to get there, and we can do this for every mode of transportation, not just cars. We call this measuring access and using it to evaluate how our transportation system is performing and to decide what projects to build next would make for a much more equitable transportation system.
Access to a better future
If you don’t own a car and you rely on walking, biking, or transit, your needs are largely ignored under the current paradigm. If you don’t want to spend $9,000 a year to own and maintain a car, improving your access to jobs and services is secondary to the needs of people driving. If you can’t drive, for whatever reason, you can only hope that there are viable options to get you where you want to go.
Using access as the primary consideration to evaluate projects may show that building and repairing sidewalks in a community would dramatically improve access to jobs and services for more residents than redesigning one intersection for cars (and for the same amount of money). It may show that a new bus line would make it easier for residents in a low-income community to access healthcare. It may show that filling a gap in a bike lane network would improve the ease and safety of reaching the closest grocery store from neighborhoods in a food desert. Or it may show that the length of a bus ride to school could be cut in half with a short connector road. Using access to guide our transportation investments may show these things, but we wouldn’t know because most transportation decisions focus only on the delay of cars alone.
That’s why our third principle for transportation policy is connecting people to jobs and services. Instead of using an outdated proxy that gives us an incomplete and indirect view of whether or not the system is actually working to get people to their destinations, let’s measure the actual thing that proxy was attempting to measure. Congress should direct USDOT and states to determine how well the transportation system connects people to jobs and services, and prioritize projects that will improve those connections.
Measuring access alone won’t erase all the structural issues that disadvantage low-income communities and communities of color, but it will solve one of those issues. By measuring access we can begin to make sure that everyone regardless of income, age, race, or ability can get where they need to go by whatever mode they choose.
It’s time to define transportation success by what actually matters to people: getting where you need to go
For decades, transportation departments have been measuring the wrong thing: vehicle speed. Instead of measuring the speed of a car, we should measure the success of our transportation system by how many jobs and services people can access safely, quickly and affordably.
It’s “Connecting people to jobs and services week” here at Transportation for America. All week we’ll be exploring why improving access should be the goal of the federal transportation program—not vehicle speed. Check out our post from yesterday discussing why it’s time to throw out the traffic measurement level of service, and tune into our Twitter account later today for tweets by renowned transit planner Jarrett Walker.
The goal of our transportation system, and the $40-plus billion in federal dollars we invest each year on it, should be simple: getting people where they need to go. But that’s far from the case.
When you think back about whether or not you had a successful trip, you probably think about if you got from point A to point B and how long that trip took. But state transportation departments don’t measure success that way: they instead measure whether or not your vehicle was moving quickly at some point of the trip. Whether or not you actually arrived isn’t a consideration. And they rarely, if at all, measure whether or not you can access important destinations like jobs and other services.
Using outdated measures like “level of service” that assess how fast traffic moves compared to free flow speeds in the middle of the night, they assume that if the traffic is moving well on a given segment of a road that the trip was high quality and successful. In other words, an hour-long commute at high speed would be considered more successful than a 10-minute commute in a little traffic. Lost entirely in this simplistic proxy are non-car trips—we don’t measure people who walk or bike to work.
But this 20th century technology isn’t a good measure of whether or not people have access to the things they need in their daily lives. We think that destination access, or accessibility, is a much better measure.
Connect people to jobs and services—our third principle
Our third principle is not a new concept. What’s new is that we now have technology that makes it possible to measure success by what actually counts—reaching your destination. A few decades ago, we didn’t know where people were starting their trips from and going to. With a transportation program as we know it that began in the 1950s and 60s, we used simplistic proxies like level of service or vehicle delay or blunt measures of congestion because that was the best we could manage at the time. But now we have reams of data about where trips begin and end, where jobs are located, where people live, and where daily needs are located. With the help of cloud computing and GPS, we can measure every aspect of a trip.
Yet the federal transportation program continues to rely on outdated 1950s metrics that assume a transportation system made up entirely of vehicles (rather than people), where the best measure we can come up with is “did your car go fast or slow for your trip?”
It’s time to actually measure what matters as we decide where and how to invest billions in federal transportation dollars each year.
Think of destination access as the map app you likely have on your phone. When you search for a restaurant or a store, the app can tell you how long it will take to get there by different modes of transportation. And because of the millions of searches performed each day and the location data transmitted, it is now possible for states and local communities to accurately calculate access to employment opportunities, daily errands, public services, and much more. These tools allow cities, states and metropolitan planning organizations (MPOs) to design transportation networks that maximize the ability of people to travel by whatever mode they choose and to better understand how transportation investments interact with land-use policies.
Losing the current dangerous focus on speed and instead measuring accessibility would prioritize efficient travel and a more equitable transportation system, one where low-income communities would have increased access to jobs and services. We can hold agencies accountable to deliver these connections.
Funding should go to projects that will improve these connections, regardless of mode. State DOTs and MPOs should be held accountable by evaluating how well their investments help connect people to destinations—not whether or not they allowed traffic to move a little faster on some segment of road.
Some states are already starting to evaluate projects this way
The Commonwealth of Virginia started using destination access to prioritize transportation projects in 2017. When deciding what new capacity projects to fund, Virginia measures how much access a given project will create and divides that accessibility score by the cost. It’s a transparent, quantitative way to prioritize limited tax-payer dollars.
When we tie funding decisions to measurable outcomes, it creates more faith and buy-in from local communities. Connecting people to jobs and services is something everyone can agree to.
While states like Virginia are voluntarily trying to change the process, to truly experience a sea change, the federal government needs to make improving access a fundamental priority for all transportation dollars.
Connecting people to jobs and services week: How bad metrics lead to even worse decisions
When the top priority of our transportation investments is moving cars as fast as possible, the end product is streets that are wildly unsafe—as chronicled in depth last week. This focus on vehicle speed and throughput is the result of outdated metrics that utterly fail to produce a transportation system that connects people to what they need every day.
A “successful” street, according to the metrics used by most state DOTs and metro areas. But “moving cars fast” as a goal fails to measure whether or not anyone can get where they are going. We need a better standard for success.
For “connecting to jobs and services” week, which focuses on our last of three principles for transportation investment, we’re re-surfacing portions of a post we wrote in 2016 about how one bad metric for evaluating potential transportation investments leads to expensive road projects that fail to get people where they are going every day.
All this week, we’re going to be unpacking our third principle for transportation investment, which is admittedly the most difficult to explain, especially compared to the first two: (1) prioritizing maintenance, and (2) prioritizing safety over speed. Before we can explain “connecting people to jobs and services,” we need to explain how the current federal transportation system is oriented around all the wrong things.
As we chronicled two weeks ago, if there are any existing priorities for the $40+ billion in annual federal transportation investment, it’s that cars should move fast, at all times, on all types of roads, no matter how many people die as a result. But we do almost nothing to measure whether or not any of this federal spending actually helps people get where they need to go each day. One reason why is this wonky metric—created by the federal government—that nearly every state and local transportation agency uses to evaluate the success or failure of their transportation network.
Bad measures for success lead agencies to make bad decisions
As they plan projects and decide which transportation projects to fund, state and local transportation agencies exhaustively measure something called “vehicle level-of-service” for almost every single investment. Here’s a story to illustrate:
Wanting to rejuvenate their local economy, a local community cooks up plans to redesign the local street running through downtown that was perhaps even short-sightedly widened or converted to one-way travel in the 1960s or 70s. They want to make it safer and create a better environment for doing business—to make it a place to travel to, not through.
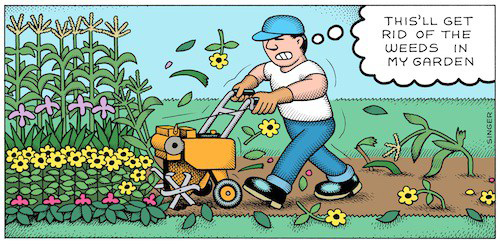
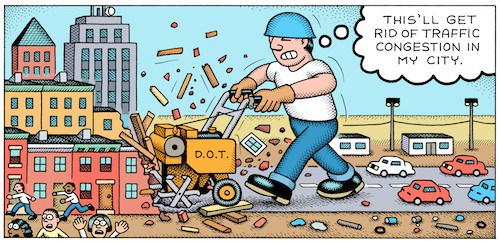
But because the street is also a state highway, they soon hear from the state department of transportation (DOT) that their proposed changes will slow down traffic and fail to meet “level-of-service” requirements. As a result, the project will fail to make the cut of the state’s short list of projects. Worse yet, the community is told that in order to make this street safer and “solve” congestion, they actually need to widen it and smooth out any curves, making it a virtual speedway, undercutting their plans to build a place with more enjoyable places to walk and visit—a framework for creating economic prosperity.
This terrific cartoon from Andy Singer shows how this rationale leads us to obliterate all the good things about our streets and places in pursuit of improving level of service:
What is level of service, and how do DOTs come to this conclusion?
Level of service is a system by which road engineers measure how well a road is performing based on the number of cars and the delay that vehicles experience on that roadway. Letters designate each level, from A to F. Just as with our time in school, A is great, and F is terrible.
A, B and C represent free-flowing conditions and F is stop-and-go traffic for vehicles. The score is assessed based on the highest level of congestion on that roadway, even if it only occurs for a few minutes a day. (To be clear, a street that is nearly empty 23.5 hours of the day can get an F if it gets congested during rush hour.) Traditionally, roadway conditions are acceptable if they score a C or higher on non-urban streets and a D or higher on urban streets.
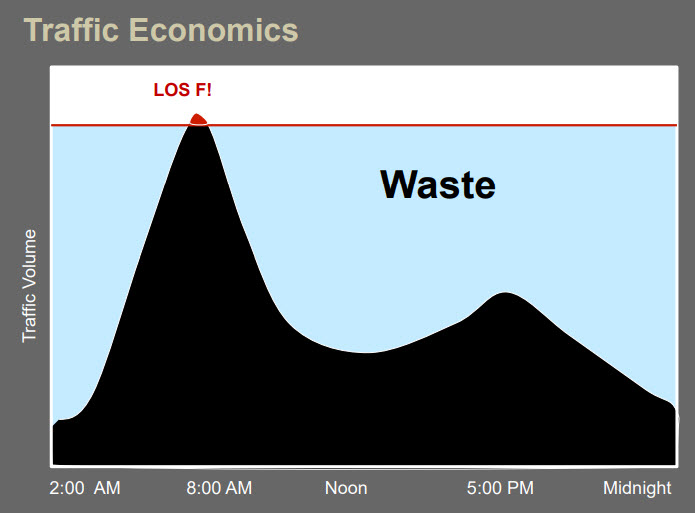
This graphic, created by Jeff Tumlin, the new head of the SFMTA in San Francisco, illustrates how roads can be massively over-engineered to avoid level-of-service “F” with expensive capacity that largely goes wasted during the bulk of the day. Graphic via Strong Towns.
The level-of-service measurement is calculated by first measuring the amount of traffic during the busiest 15 minutes of an evening rush hour. Next, traffic engineers project the amount of traffic on the road in 20 or 30 years to determine if the road has enough capacity to cover the lifespan of the asset. If a road is projected by traffic engineers to lack capacity 20 years in the future—an incredibly fuzzy practice that’s far more art (or more accurately magic) than math—that road still receives a failing LOS grade today, even if the road is adequately suiting capacity needs.
Though there are no formal or federal requirements to do so, most DOTs, metropolitan planning organizations and traffic engineers rely on the level of service (LOS) transportation metric as they plan and design projects, and evaluate which ones will receive funding. I.e., projects that “improve” it get the fast track for funding, and projects that might make it “worse” are shelved or modified.
According to Jason Henderson, professor of geography at San Francisco State University, “Every city I’ve ever come across has some use of [LOS].” Because of the ubiquity of LOS, this largely misunderstood measurement has profound influence on the design of our communities.
This heavy reliance on level of service has dramatically shaped our cities, and it’s why states and metro areas and cities have spent billions to “solve” congestion in a way that has produced dangerous streets, dilapidated downtowns, economic disaster, and long-term maintenance costs that no locality can cover on their own.
Toledo and many other Rust Belt cities have little to no congestion and many of their in-town streets enjoy level of service “A.” Is that a good measure for success?
As Gary Toth from the Project for Public Spaces brilliantly put it in this piece, transportation professionals, “in search of high LOS rankings, have widened streets, added lanes, removed on-street parking, limited crosswalks, and deployed other inappropriate strategies” all because level of service has been the de facto standard over the last 50 years.
Every great street that you can think of in most places you want to visit on vacation probably “fails” level of service.
Congestion and level of service is “bad” because the street is home to numerous places people want or need to visit, the sidewalks are too wide and filled with pedestrians window shopping, there might be bike lanes to allow people to arrive without a car, and it’s almost certainly chock full, not necessarily of vehicles, but of people.
Poor level of service in Annapolis, MD. Tear down those buildings and you could add a couple of lanes in each direction and fix it!
Where did this measure come from?
The 1965 federal Transportation Research Board Highway Capacity Manual introduced this metric and it quickly became accepted as the standard measure of roadway performance. One reason that states adopted level of service so quickly was that it suited our country’s transportation goals in the 1960s of building out a network of interstates and prioritizing automobiles to travel quickly.
But as we explained at length last week, building highways and interstates with speed as the top priority is wildly different from building local and regional streets that create a framework for capturing value and providing for the safe movement of people, whether in a car or not.
Although LOS quickly became the standard, transportation agencies at any level are actually not explicitly required to use it: there are no planning or project design requirements that mandate the use of either LOS or travel modeling. FHWA [in 2016] issued a memo clarifying that level-of-service was never a federal requirement.1 But states persist, partially because the feds have never proposed a better measure of success or a more holistic overarching goal for what our billions are supposed to accomplish.
California was the first to make a notable shift, but more is needed
California set out to change the way they designed their streets and communities by changing the way they measure their performance. In 2013, California legislature passed a law directing the Office of Planning and Research (OPR) to instead measure vehicle-miles traveled (VMT), making it possible for projects aiming to reduce driving to fare well in the evaluation process. In 2013, Governor Jerry Brown signed into law SB 743, eliminating the use of level of service for projects within designated transit priority areas (i.e, areas with decent transit service.)
As Streetsblog LA reported in 2013, because most urban areas fall within the state-defined parameters of a transit priority area, this means that level of service is largely eliminated as a consideration for urban projects. Additionally, SB 743 authorized Governor Brown to develop a new way of measuring traffic impacts of major projects statewide and based the new way on total vehicle miles traveled (VMT) rather than intersection congestion.
Depending on how California implements this, it would change how development and transportation projects are analyzed and scored in traffic impact studies and thus send the state’s billions in transportation dollars toward projects that will help meet the state’s overall goals—rather than projects that will simply keep the cars moving quickly at all costs.
In short, instead of measuring the success of a proposed project by only the limited measure of whether or not traffic might slow for a few minutes per day at rush hour, CalTrans will now measure whether or not a project contributes to other state goals, like reducing greenhouse gas emissions, developing affordable multimodal transportation options for residents, preserving open spaces, or promoting diverse land uses and infill development. It is expected that this change will make it easier to build transit projects, as well as bicycle and pedestrian-friendly infrastructure—instead of encouraging more development that works against California’s own environmental and other goals.
$40+ billion is spent each year with no clear measures for success other than “move cars fast”
We need better priorities for federal transportation investment than just “move cars fast, all the time.” A fundamental principle has to be that the people who use our transportation system should be able to get where they are going. That’s where we are going with our third principle, which we’ll be unpacking in another post: “Connect people to jobs and services.” This metric would be a far better measure of success than anything on the books today, and some places are already starting to implement it.
The best thing about the Smart Cities Collaborative is the peer-learning, says Oakland’s Warren Logan
Next January marks the third cohort for T4America’s Smart Cities Collaborative. This time around, a steering committee of former Collaborative members is helping us shape the program. Warren Logan, the Policy Director of Mobility and Interagency Relations at Oakland Mayor’s Office, talked with us about what makes the Smart Cities Collaborative so valuable to city officials.
Transportation for America: What’s the hardest part about working on new mobility at the city level?

Warren Logan, Policy Director of Mobility and Interagency Relations at Oakland Mayor’s Office
Warren Logan: *Laughs* There are two major challenges. One is that city government isn’t equipped to manage innovation. We’re good at working slowly to maintain safety, order and equitable access. New mobility companies challenge the city, and sometimes actively try to avoid regulation.
Secondly, the people who work in government are not the target audience for these kind of mobility services. This is a huge cultural challenge. If you look at the demographics of people who use scooters, bikeshare, or any kind of mobility through their smartphones, it’s people between the ages of 21 and 35. These people are more affluent, more flexible, and they live downtown—they’re the new urban class that we’re seeing shift into cities in the greater part of America.
The people who you might assume work in high levels of government are older, more conservative, and more averse to risk. I saw this frequently in San Francisco, where I used to work: people who have never ridden a scooter but want to regulate them a particular way. This fundamentally underscores the challenge. If you haven’t used it, you should try it out first before regulating. In Oakland, where I now work, our scooter permitting policy requires that city staff test them out. We need to understand scooter users.
T4America: What part of the Smart Cities Collaborative did you find most valuable?
WL: The Collaborative is one part therapy, one part workshop. It’s really helpful to be in a room full of people facing the same challenges and working towards the same goal.
Warren Logan talking with former colleagues and staff from the Bay Area during the 2018 Smart Cities Collaborative.
One thing that’s really challenging about new mobility is that each city has three full-time staff—at best—working on this subject. It’s challenging for the one mobility person embedded in parking management to know what the right, innovative answer is when they’re surrounded by people focused on only parking.
That’s what makes the Collaborative so valuable: The diversity of cities—blue, red, big, small, coastal, southern, Midwestern—results in a wealth of information and an incredible alumni network. It’s amazing to be able to call up someone from another city, talk about the problem you’re experiencing for 30 minutes, and then solve it, right there.
T4America: How did you bring what you learned at the Collaborative to San Francisco? And now to Oakland?
WL: San Francisco is on the cutting edge of a lot of new mobility issues, so there’s this understandable mentality that we have to be the first ones to solve a problem. But what’s interesting is that since shared mobility launchd in a lot of places really quickly, we’re not the biggest fish in the pond.
More importantly, as I participated in the Collaborative for a while, we found that this model—this permitting structure that we all backed into as the way to manage shared mobility—might not be perfect. Maybe we would have been better off if we chose a public-private partnership or a franchise model. What I brought back to San Francisco, and now to Oakland, is a way to explore questions that I never thought of before, and the very rich contacts from all these cities to explore these solutions.
Interesting in sponsoring the Smart Cities Collaborative? Learn more here.
Some scenes from the final meeting of the 2018 Smart Cities Collaborative
Angry that speed is prioritized over safety? Here’s what to do about it
Last week was #SafetyOverSpeed week here at Transportation for America, where we took a deep dive on our second principle for transportation policy: design for safety over speed. We spent the week discussing how prioritizing speed makes it almost impossible for most Americans to reach destinations anyway other than driving. Now we need to do something about it. Heidi Simon, the Deputy Director of America Walks, discusses how you can make a difference in your community.
LA’s ever-increasing walkability.
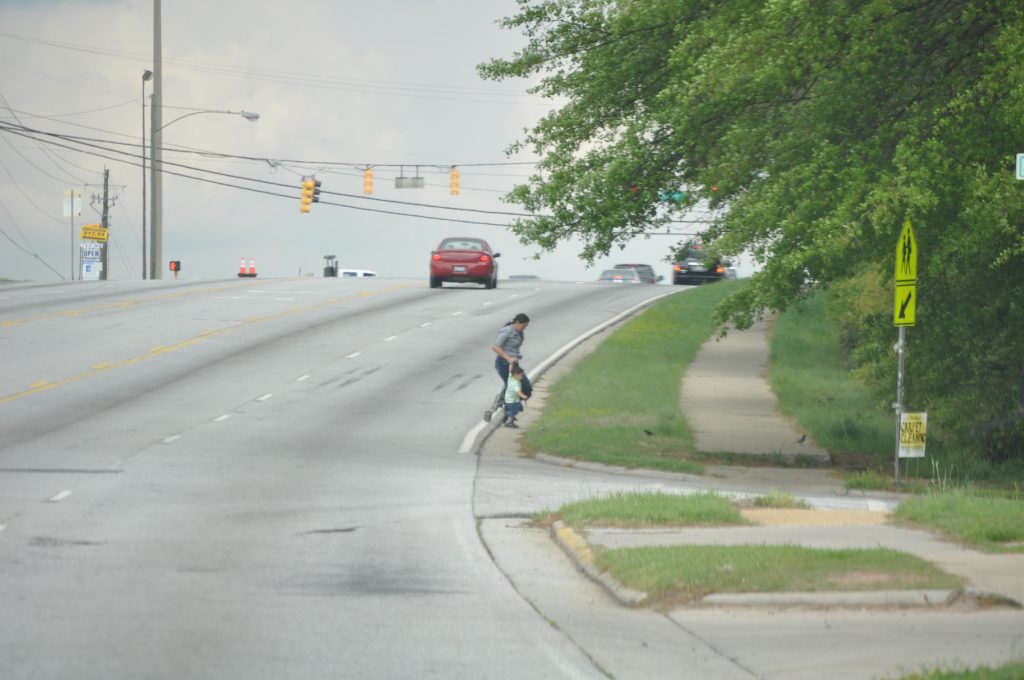
America Walks was disappointed—but not surprised—to learn that 6,283 friends, family members, and neighbors lost their lives while walking in 2018. As a national non-profit working to create safe, accessible, and enjoyable places to walk and move, we know all too well the immense challenge that this nation faces in addressing the devastating trend of growing fatalities among people walking and biking.
Our lack of surprise? Well, that’s because—despite a plethora of street design tactics proven to increase safety—we’re operating in a transportation system that prioritizes cars over people, and has for decades.
We know that many of the issues that plague people walking (and biking) are not new. Poor street design, improper speeds, and a culture that prioritizes cars over people have created a landscape that continues to unnecessarily endanger the most vulnerable users of the public rights of way.
Yet too often the conversation on making roads safer focuses on things that have little to no actual influence on improving safety. The distraction of the distracted walking narrative, the false notion that wearing reflective clothing will save lives, and the idea that these deaths are inevitable are all narratives that do a disservice to improving safety.
Perhaps the biggest issue is that the urgency to reduce the number of people killed while walking and biking occurs only periodically throughout the year, like when NHTSA released 2018 fatality numbers. By then, it’s too late to help those who have unnecessarily lost their lives while doing the most basic of human activities.
But it’s not too late to do something for those who are walking and biking on our streets right now. We can use data to target high crash corridors and improve spaces for our most vulnerable road users. We can make it clear that the only acceptable number of deaths on our streets is zero. And we can start today to do the work needed to make walking and biking safe for all users:
Use your voice: Tell decision-makers at all levels that funding for active transportation needs to be increased and that we need to take steps to improve safety through reduced speeds, improved road design, and policies that actually address safety concerns. This can be done at town halls, by visiting their offices, or inviting them to take a walk with you, your walking club, a walking school bus, or a main street business council. (One way you can help right now is by supporting a long-awaited federal Complete Streets bill.)
Use your head: Dive into the data related to pedestrian fatalities and use it to inform your advocacy. Learn more about the issue, stay vigilant to distractions like victim-blaming, and don’t let the issue disappear from the public debate.
Use your feet: Get out and do a walking audit with friends, neighbors, and your local elected officials to show them what’s being done well and not so well on the streets in your community. Never done one before? Check out our guide here with helpful quick tips like:
- Inviting people from a variety of background, professions, ages, and abilities.
- Don’t be afraid to knock on doors to get the word out about the event.
- Build relationships with decision-makers and local elected officials early so they’re more likely to be engaged during and after the audit.
Missed Transportation for America’s Safety over Speed blog posts? Check them out.
Our seven favorite tweets from the #SafetyOverSpeed tweet chat

Last week we hosted a tweet chat to discuss the importance of prioritizing #SafetyOverSpeed, in tandem with our week of blogs discussing our second principle for transportation policy. Here are our seven favorite tweets from the chat.
Thanks to our tremendous co-hosts for making the Tweet Chat a success: Smart Growth America, the National Complete Streets Coalition, U.S. PIRG, America Walks, the League of American Bicyclists, the National Association of City Transportation Officials, and Strong Towns.
Missed Transportation for America’s Safety over Speed blog posts? Check them out.
Now to our favorite questions!
Why are there more deaths on arterials—”stroads” in the words of Strong Towns—than on highways with speed limits as high as 70 mph?
A1: Stroads mix speed and complexity, and it’s the combination that makes them the deadliest type of roadway. Fast traffic doesn't belong in environments where people are walking and cars are turning in and out of the roadway. #SafetyOverSpeed https://t.co/IuJRaysC9G pic.twitter.com/TMnE5UsgGR
— Strong Towns (@StrongTowns) November 6, 2019
Why are most local and arterial roads—particularly in sprawling suburbs and cities—still being designed for high speeds?
A2: Because people mistakenly equate speed with efficiency and effectiveness #SafetyOverSpeed https://t.co/wF4HUmMTxa
— America Walks (@americawalks) November 6, 2019
Lowering speed limits alone does little to reduce speeds. How can we better slow vehicles on local and arterial roads?
Your average driver could identify the elements of a street designed for #SafetyOverSpeed if you asked them to think about it: narrow streets with narrow lanes, trees, sidewalks … a lot of the same things that make a street pleasant for walking. https://t.co/pcoqG7zrs6
— Chris Rall (@cjrall) November 6, 2019
According to Dangerous By Design, older adults, people of color, and people walking in low-income communities are disproportionately represented in fatal pedestrian crashes. Why, and how can we fix this?
For too long, communities of color, seniors & working-class neighborhoods have been overlooked. We need to invest in safe, complete streets & give people more efficient & affordable modes of connectivity. Public transit, bike lanes & walkable streets? It’s a no brainer. https://t.co/42k82o3wEO
— Congressman Chuy García (@RepChuyGarcia) November 6, 2019
What are some economic benefits of slowing down streets?
Slowing down streets unlocks their value as public space (80% of public space in cities!). Businesses thrive on streets with low vehicle speeds and high pedestrian activity.
Take a look:https://t.co/bQpMyEI6rX #SafetyOverSpeed https://t.co/045XSArjrP pic.twitter.com/tpaDEtm8FX
— NACTO (@NACTO) November 6, 2019
Transportation is the largest source of U.S. carbon emissions. How can lowering speeds help reduce those emissions?
A: Emissions are harmful to the well-being of our communities. To protect our public health and our climate, we must improve public transit systems and design our roads to make it safer for people to walk or bike. This will help our cities and lower emissions. #SafetyOverSpeed https://t.co/DLC8Xi1n8k
— Mark Takano (@RepMarkTakano) November 6, 2019
Speed is often considered a local and state issue. Why should the feds get involved, and how can they support communities that make their streets safer?
A7: Want to test local authority? Watch a city or town ask to lower speed limits on a state road. Sit back and watch the fireworks. #SafetyOverSpeed (1) https://t.co/HihXkHRlhW
— Transportation for America (@T4America) November 6, 2019
Safety over speed: Safe streets are climate-friendly streets
Lowering speeds have more benefits besides saving lives: street designs that keep speeds low help reduce carbon emissions, too. In this blog post by our friends at the Natural Resources Defense Council (NRDC), Ann Shikany and Carter Rubin discuss how safer roads increase rates of biking, walking, and transit ridership, and enable fewer and shorter car trips.
Slow neighborhood greenways help people get around without getting in their cars. Photo via City of Seattle.
In communities across the county, our transportation system provides key linkages for commuters to jobs, kids to school and all of us to our social, family and recreational opportunities.
But the flip-side is that after decades of prioritizing transportation investments in new highways with a focus on speed above all else, we’re stuck with a transportation system that produces more carbon emissions than any other sector in the United States. Spread-out development facilitated by wide fast roads make cars all but essential for daily travel in many U.S. communities.
When you dive deeper into those carbon emissions—you’ll find that 59 percent of them come from light-duty vehicles—that includes the cars we drive around in for most daily trips. While the majority of daily trips are less than three miles, most of them are made by car.
Even worse, transportation emissions are rising because people are driving more and making longer trips. Even with cleaner fuels (not to mention electric cars) and more efficient vehicles, the uptick in driving more is obliterating any emissions benefits.
Why are people driving more, and using cars for even short trips? Because, with an overarching focus on vehicle speed and avoiding delay, nearly everything we’ve built for 60 years has been designed for high speed vehicle movement, which makes getting around by any other mode—biking, public transportation, or your own two feet—dangerous and unpleasant. Our transportation system—and the federal policy that built it—forces many Americans to drive to get just about anywhere.
The good news is over 40 cities in the United States have adopted Vision Zero policies that seek to eliminate traffic fatalities and major injuries on our roads through safety policies and investment in the kind of infrastructure that will help keep everyone safe—with a priority on those who are most vulnerable.
Some of the key strategies that cities use to meet this goal include:
- Providing physical protection for people walking and biking, like bike lanes protected with planters, bollards and curbs.
- Reducing vehicle speeds on routes intended for people walking and biking, so that people of all ages and abilities feel safe.
Projects that lower speeds and make it easier to bike, walk, and use transit also compliment land use changes that bring destinations closer together. Slower speeds allow our streets to become places where people want to be, not race through. (As our own Carter Rubin said sarcastically when asked about the economic benefits of lower speeds during yesterday’s #SafetyOverSpeed tweet chat: “Brb, going to go shopping on the side of a freeway.” )
Improving bike and pedestrian networks is also one of the top policy priorities included in the Bloomberg American Cities Climate Challenge, and is being supported in nine challenge cities. If you’d like more detailed information on these policies, check out the Climate Action Playbook sections on bike and pedestrian infrastructure. We’ll also give you a quick snapshot of what this policy looks like in action:
Prioritizing bikeway, sidewalk and crossing improvements (Portland, OR): Portland leads large U.S. cities in the percentage of commuters who bike to work and ranked tenth in 2016 for the percentage of commuters who walk to work. The city has 350 miles of bikeways, with more than 50 miles funded to be installed in the next few years. Portland has developed this infrastructure not just by creating bike plans, but by backing these plans up with funding. Portland is currently updating its pedestrian plan to prioritize sidewalk and crossing improvements and other investments to make walking safer and more comfortable across the city. It will identify gaps and needs in Portland’s pedestrian network, prioritize funding to locations with the greatest need first, and identify performance measures to track progress. (Read more.)
Responding to the need for safety improvements (Cincinnati, OH): After facing a record breaking year of pedestrian-involved crashes—430 in 2018—Cincinnati Councilmember Greg Landsman led the charge for safer streets. The city is now pursuing a Vision Zero strategy that included appointing new leadership and dedicated staff resources within the city’s Department of Transportation, prioritized funding for pedestrian safety improvements, and increased enforcement. Through the American Cities Climate Challenge, Cincinnati’s transportation team will also receive Vision Zero design training from the National Association of City Transportation Officials (NACTO). (Read more.)
Every community deserves safe streets, clean air and action on climate. Thankfully, many cities are taking the first step by implementing Vision Zero policies locally. There is also work to be done at the federal level. On October 23, 2019, Representative Earl Blumenauer introduced the Vision Zero Act, which would make Vision Zero policies and investments eligible for federal funding. NRDC supports this legislation. Transportation for America’s push for safer streets as part of a comprehensive federal transportation investment strategy.