
Transportation is changing, but curbs are not: Lessons from the first Smart Cities Collaborative 2020 meeting

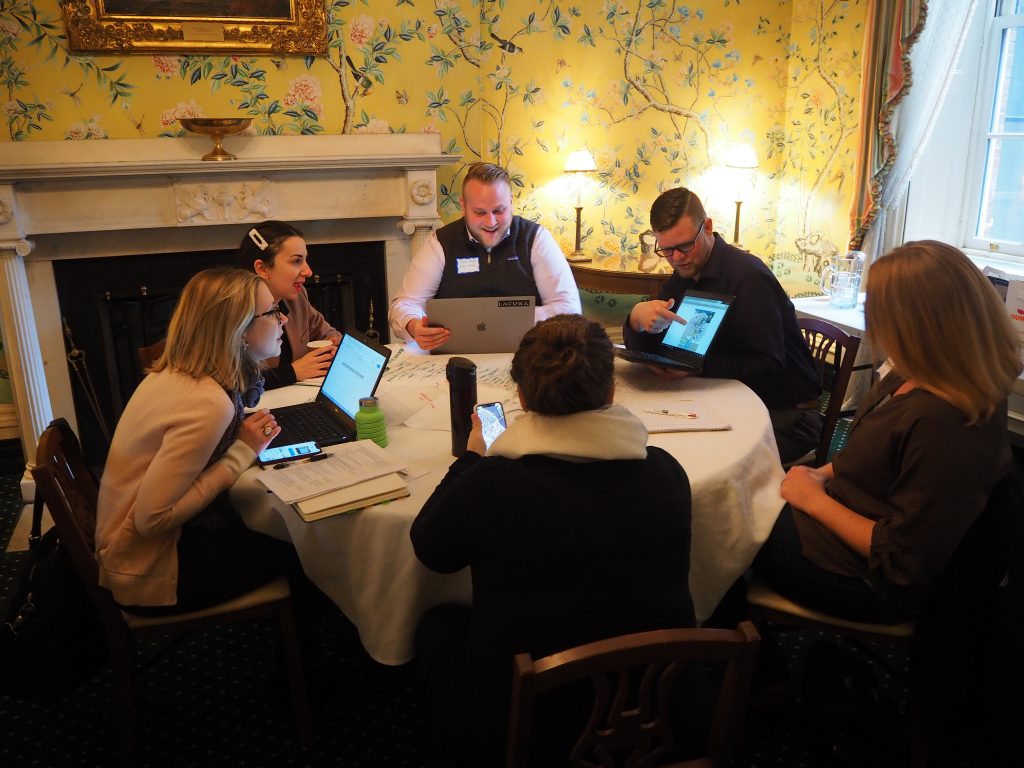
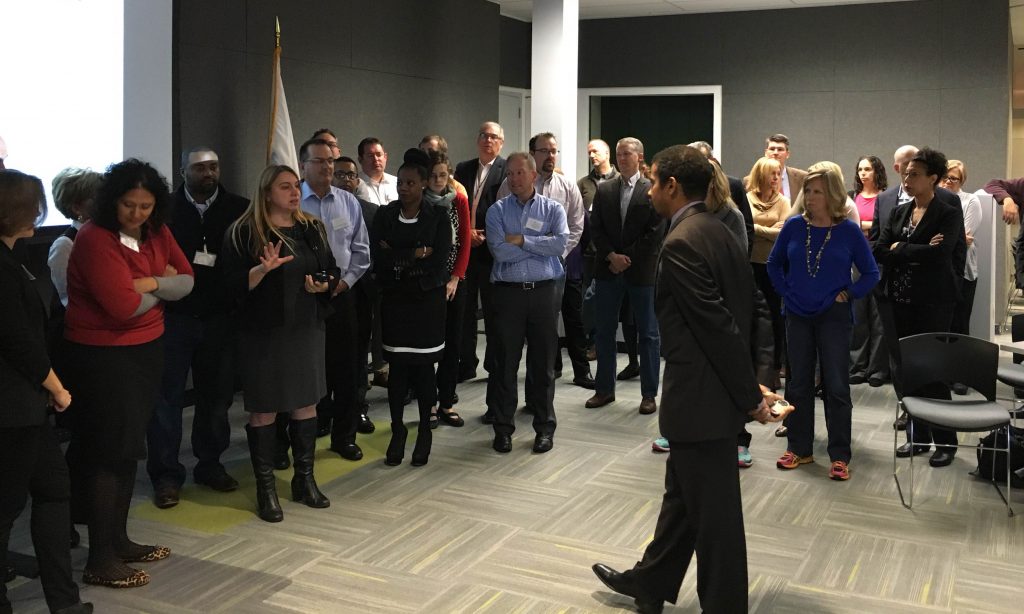
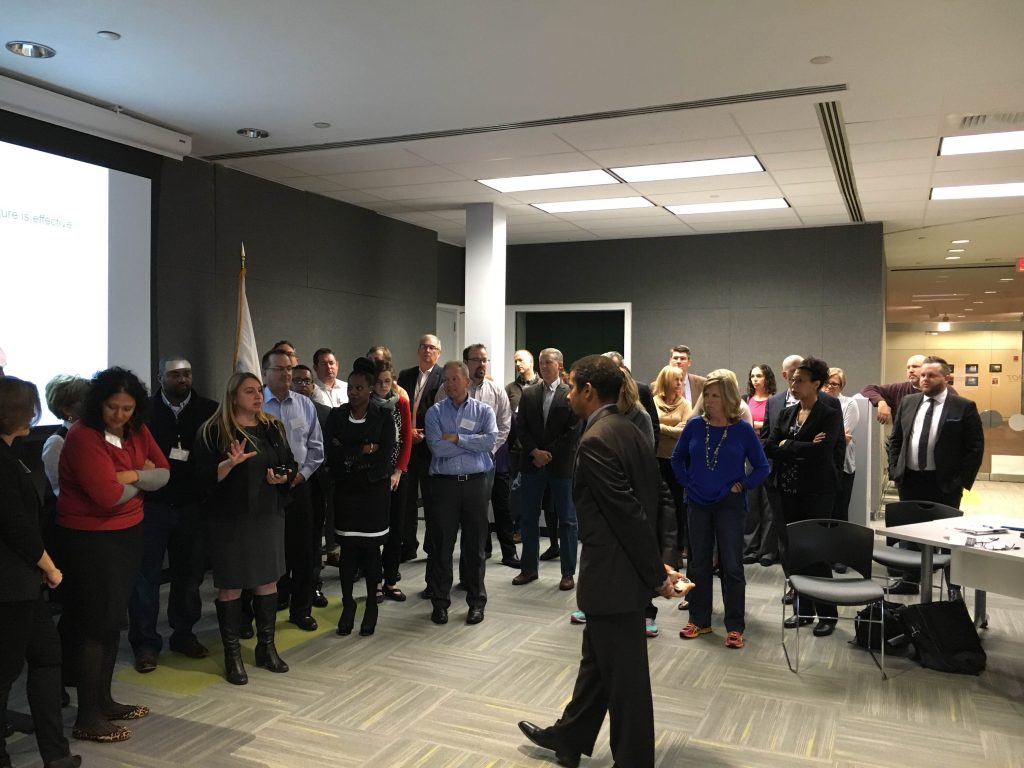
The third year of the Smart Cities Collaborative is off to a strong start. Last week, Transportation for America brought together the three pilot cities in the Collaborative to work through devising and designing strong curbside management pilots.

A break-out session at the first Smart Cities Collaborative meeting in Boston.

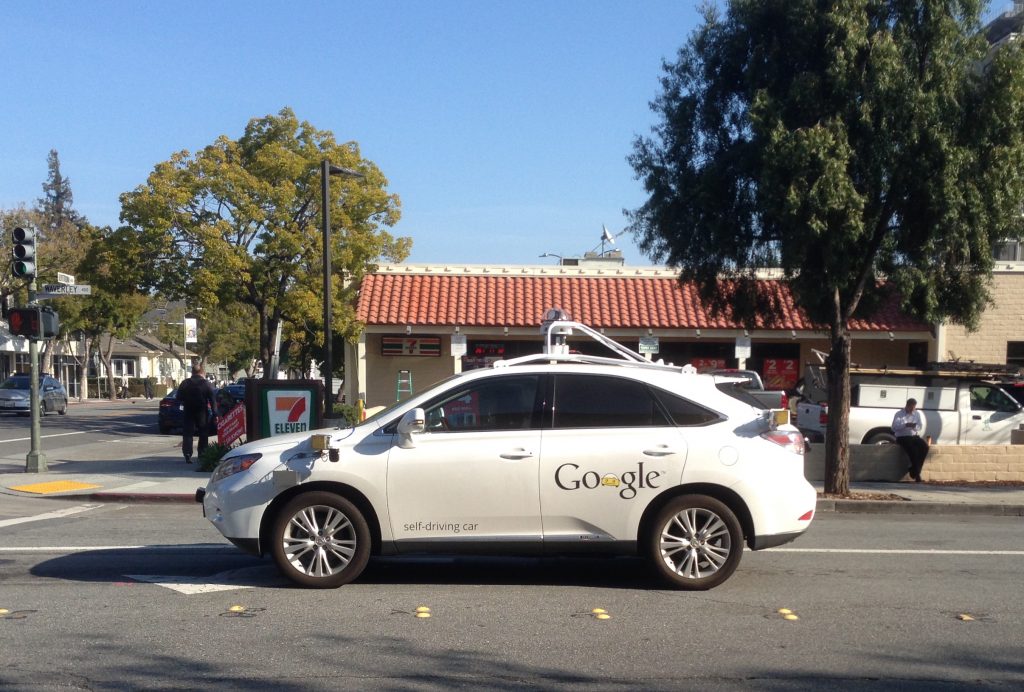
In 2018—when the last Smart Cities Collaborative wrapped up—electric scooter-sharing was brand new. Now, scooters, bikeshare, rideshare, and other mobility trends have gained stronger footholds in cities, becoming important features of the transportation ecosystem. 

But while these new technologies are changing transportation, one thing has stayed the same: the way we use curbs. 

Curbs are magical places where land use and transportation collide, often times making them cities’ most valuable assets. Which is why the 2020 Collaborative—which kicked off last week in Boston—is focused on developing better curbside management strategies through pilot projects. 

Three of the 17 cities participating in the 2020 Collaborative—Bellevue, WA; Boston, MA; and Minneapolis, MN—will launch curbside management pilots later this year. These cities’ teams met with us in Boston to brainstorm how they can make their pilots successful and scale what they learn across their cities. 

The current state of the curb

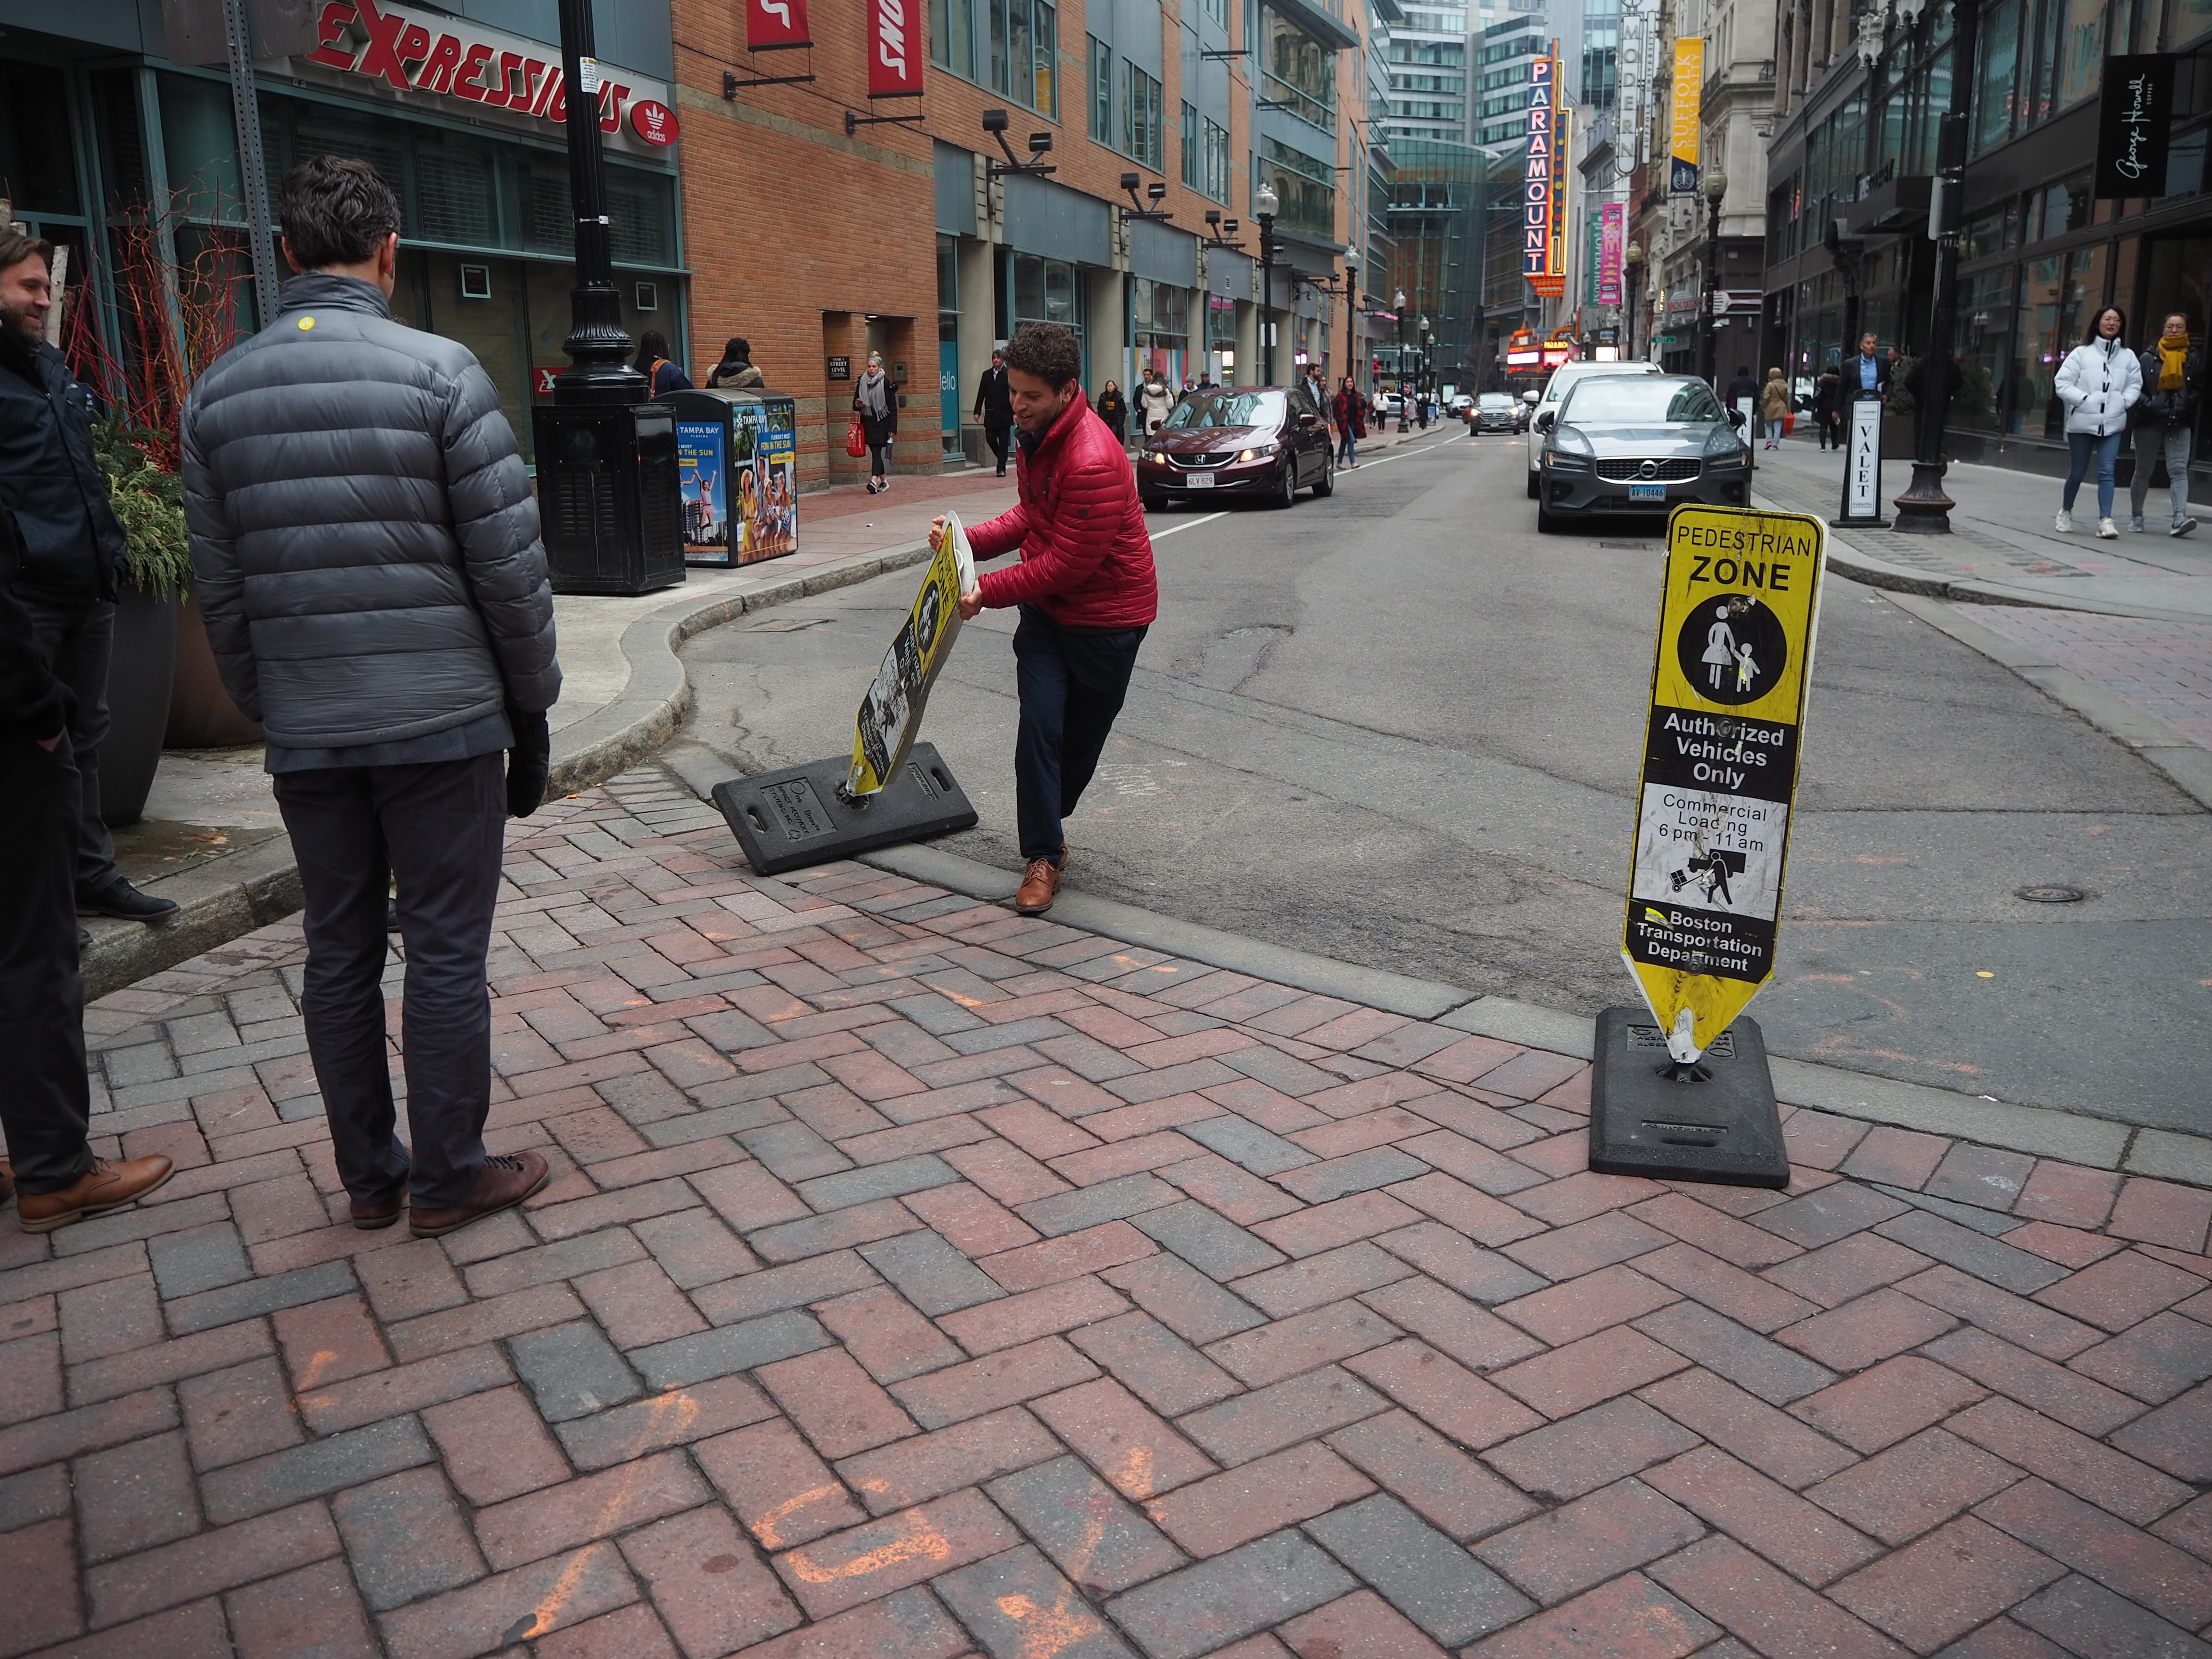
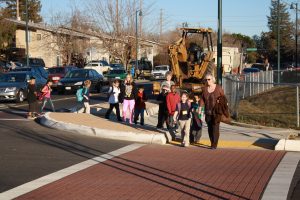
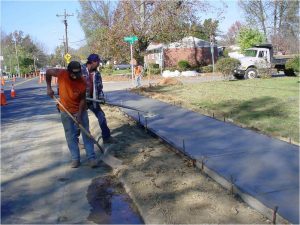
Managing curb space can be a work-in-progress. A city official puts “pedestrian zone” signs that had been moved back in their rightful places.

Curbs are more valuable now than ever before, according to Cityfi’s Camron Bridgeford. T4America teamed up with Cityfi to create the curriculum for the Collaborative—which inevitably began with what makes curbs so special in the first place. 

It comes down to simple economics: The fixed supply of curb space and the number of competing demands increases curbs’ value. For example, curbs are key to the movement of goods and people, as well as used for transit, storage, short-term parking, construction, streetscaping (like street trees), tactical urbanism, and snow removal, but there are only so many curbs. With the recent (and growing) number of new mobility technologies, it is a critical moment for cities to better leverage their curbs to advance the public good. 

For cities considering curbside management pilots, Camron recommends considering the following factors: pricing, design and way-finding, demand and access, operations and enforcement, partnerships, data, and performance measures. 

The importance of outreach

In many places, demands on curb space are increasing faster than public perception of what curbs are and what they could be. This poses a huge hurdle for cities considering changing their curbside management policies: explaining what they’re doing to people accustomed to traditional uses of curb space, such as on-street parking. 

Communicating the importance of rethinking streetscapes that haven’t changed in decades calls for more than just one public meeting. Cities need to show people what different uses of curb spaces look like, and for that they need creative communication strategies. 

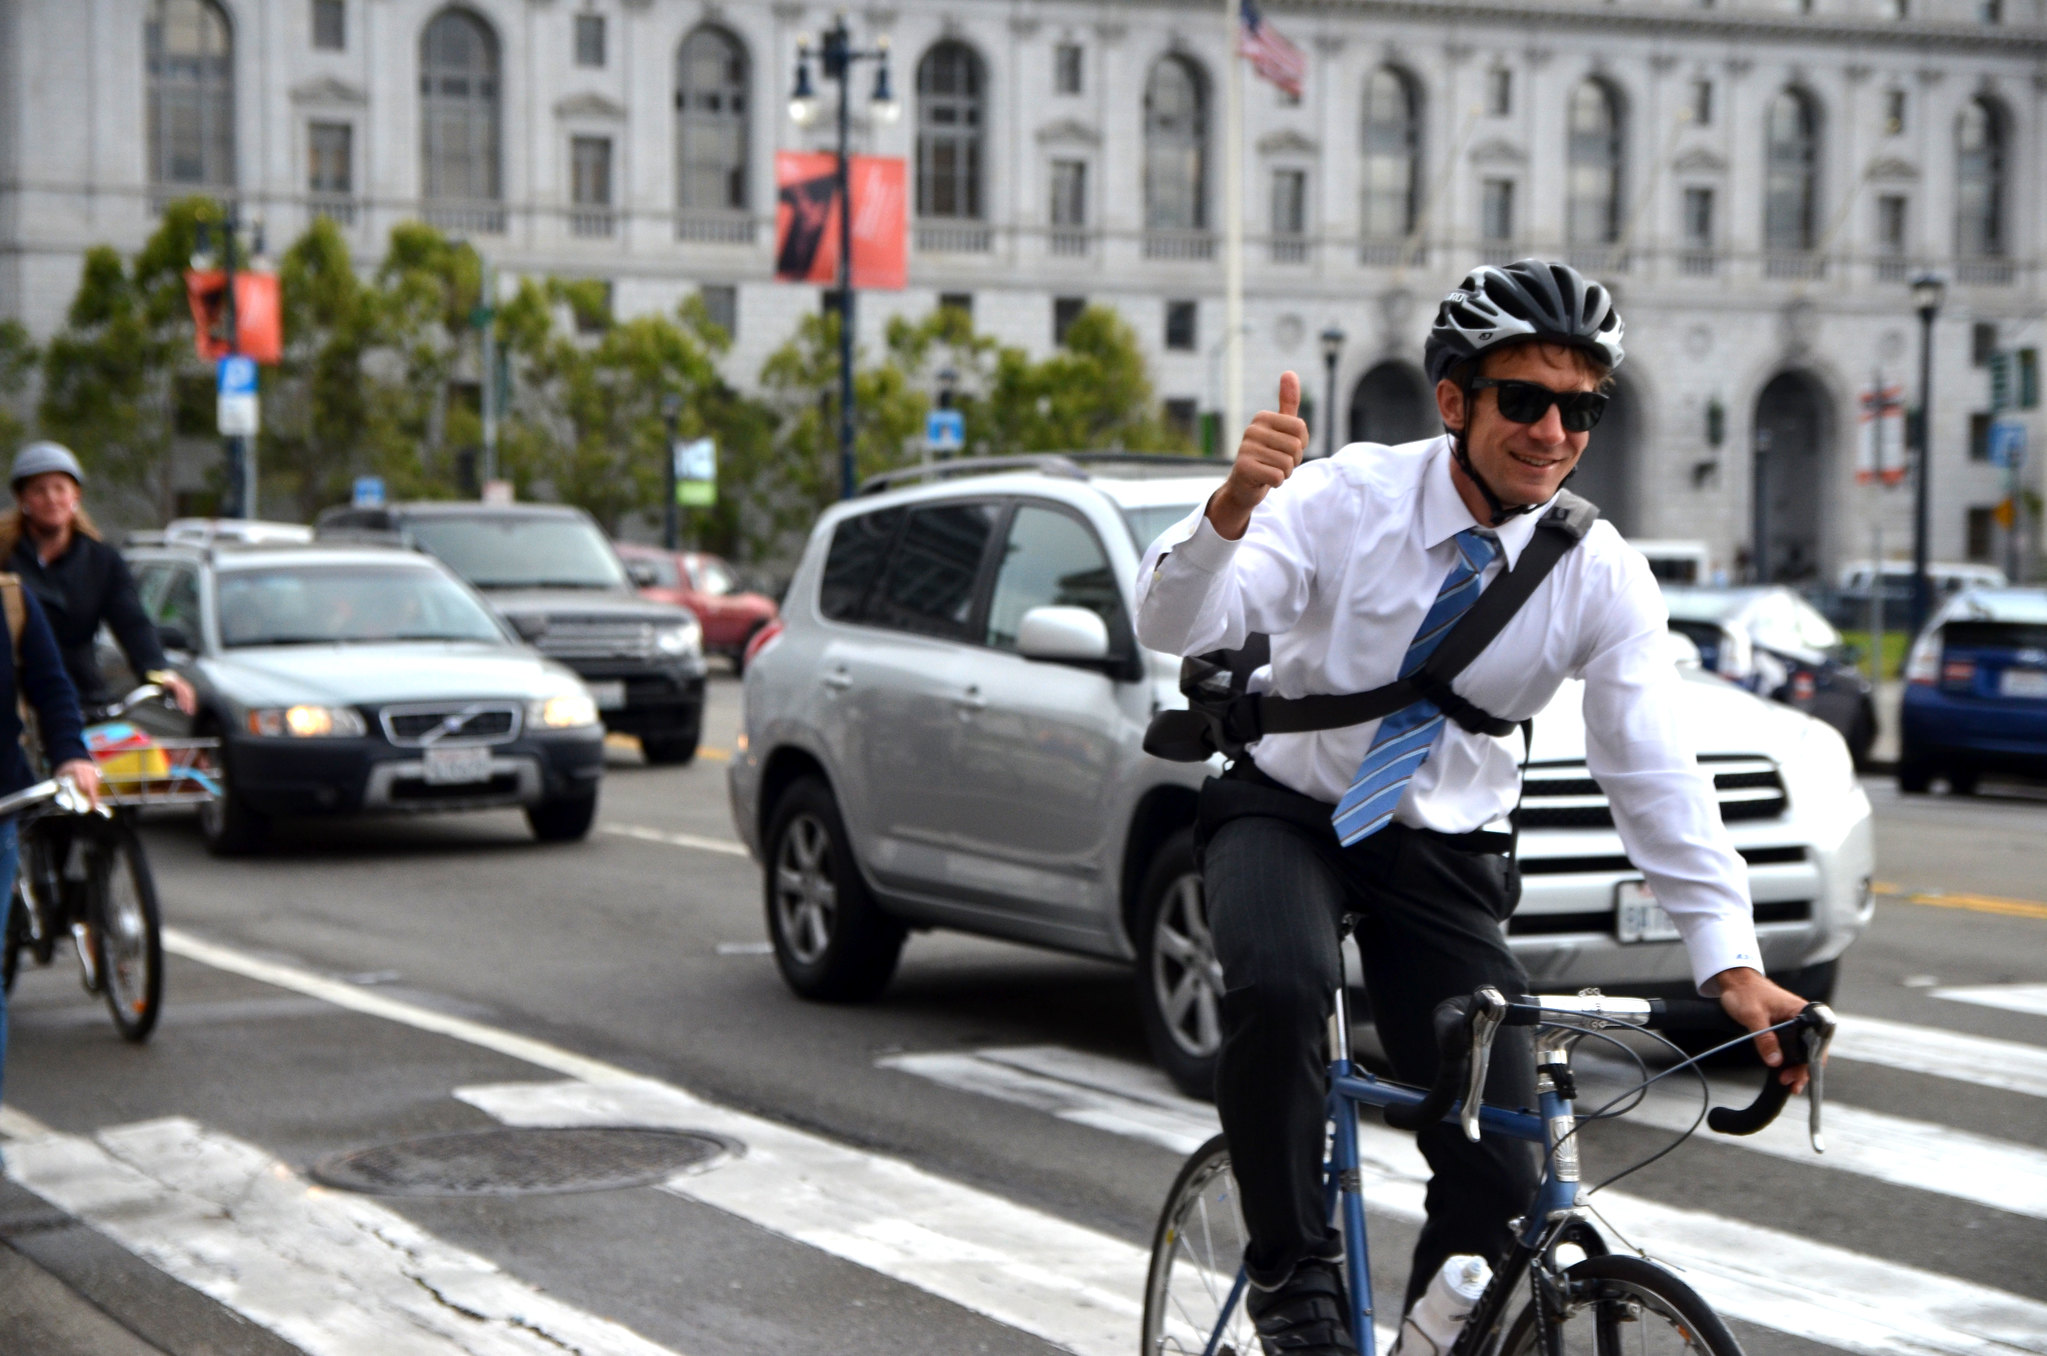
The Collaborative came up with a few communication ideas, such as prioritizing stories over data (what’s more compelling: statistics or a tale of someone who could now get to work safely because of a protected bike lane?) and using pilots themselves as an outreach tool—because what’s a better way to explain what you want to achieve city-wide than showing people how it works on one block? 

Outreach is critical to successful pilot projects and policy implementation. If the public isn’t on board, your project will never leave the station. 

Data with a purpose

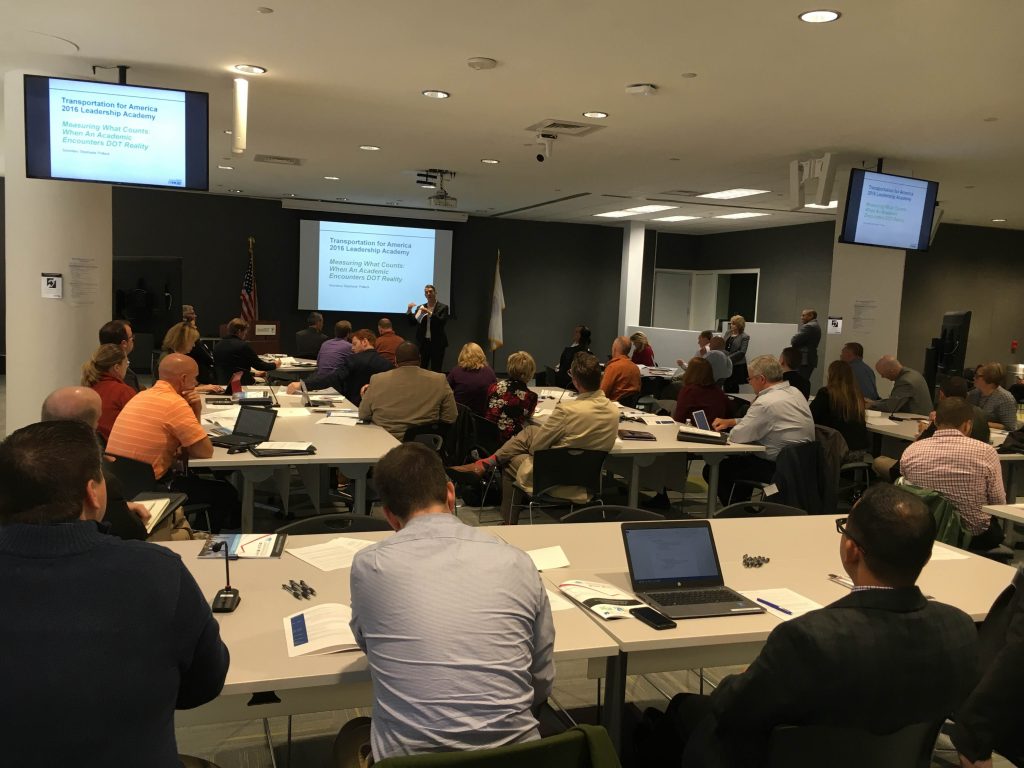
Smart Cities Collaborative co-director Emiko Atherton assists a team in a brainstorming session.

The advent of new mobility technologies is a huge opportunity for cities to learn more about how people get around by all modes of travel. But data is useless if cities don’t determine what they want to achieve with it. 

T4America’s director Beth Osborne took Bellevue, Boston, and Minneapolis on a rhetorical journey to determine why they want to collect mobility data in the first place. That journey started with identifying a problem. 

For example: many cities experience traffic back-ups that occur when a delivery vehicle double-parks. Most people take for granted that back-ups are bad, but Beth asked our three cities: why are these back-ups a problem? 

The cities answered: back-ups are bad because they increase vehicle and bus travel times and make streets unsafe for people walking and biking, as drivers double-parking or stuck in traffic might behave in unpredictable ways. That led the cities to their problem statement: We need to reduce incidences of double-parking in order to improve safety and travel times. 

By always asking “why,” cities can make sure that the data they collect aligns with their goals. 

What’s next for the Collaborative?

Between now and May, Bellevue, Boston, and Minneapolis will work on launching their curbside management pilots. This spring, we’ll gather with them and the 14 “peer” cities in the Collaborative in Bellevue to learn more about strategies for leveraging curb space. 

Connecting people to jobs and services week: The legislative path to make access the goal of transportation investments

A heat map of bike accessibility in the San Francisco Bay Area. Lighter colors indicate fewer jobs can be reached within 30 minutes on “medium-stress” bike routes while darker colors indicate more jobs can be reached. Map via University of Minnesota Accessibility Observatory.

Measuring access—not vehicle speed—is smart policy. But local governments, states, and metropolitan planning organizations need support from the federal government to make this happen. It’s high time for Congress to make robust travel data and analysis tools available to transportation agencies.

It’s “Connecting people to jobs and services week” here at Transportation for America. All week we’ll be exploring why improving access should be the goal of the federal transportation program—not vehicle speed.

Having thousands of jobs within a region doesn’t do much good if residents don’t have convenient, safe, and affordable transportation options to reach those jobs. That’s why the concept of measuring whether transportation investments improve access to jobs and services can be transformative. Improving access to jobs and services, not merely aiming for high-speed vehicle travel within a corridor or minimal delay, should be the goal of our transportation investments.

But right now, the implicit goal of all federal transportation investments is to increase vehicle speed, not improve access. Changing the goal from vehicle speed to improving access requires rethinking our federal transportation policy from the ground up.

With the current authorization for federal transportation spending—the FAST Act—set to expire in 2020, it’s time for Congress to determine transportation policy for the next five to six years. Once passed, this legislation will set federal funding levels and policy for transportation for the bill’s duration. It is critical for this bill to reform the federal program to prioritize access.

We need to determine how well the transportation system connects people to jobs and services, and prioritize projects that will improve those connections. Congress should require USDOT to collect the data necessary to develop a national assessment of access to jobs and services and set national goals for improvement.

To do this, Congress should:

  • Determine national connectivity: USDOT should develop a national assessment of access to jobs and services, and set national goals for improvement.
  • Measure the right things: apply accessibility to the federal transportation program in performance management and project selection.
  • Update standards: Phase out outdated metrics such as level of level of service.
  • Use 21st century tools: USDOT should provide accessibility data to states, MPOs, and local communities.

States such as Utah, Delaware, Virginia, California, Massachusetts, and Hawaii along with the cities of Sacramento and Los Angeles are already utilizing this type of data and seeing results.

Unfortunately, states and MPOs must currently pay to access this data while far less useful congestion data is made readily available by USDOT.

A bill before Congress would pilot destination access; let’s take it a step further

Earlier this year, members of Congress introduced the bipartisan Connecting Opportunities through Mobility Metrics and Unlocking Transportation Efficiencies (COMMUTE) Act in both the House and Senate. This legislation would pilot measuring access nationwide. We are grateful for the leadership of Senators Baldwin (D-WI) and Ernst (R-IA) and Congressman DeSaulnier (D-CA) along with Reps. Curtis (R-UT) and McAdams (D-UT), in the House.

The COMMUTE Act would create a competitive pilot program to provide five states, 10 metropolitan planning organizations (MPOs), and five rural planning organizations with data sets to calculate how many jobs and services (such as schools, medical facilities, banks, and groceries) are accessible by all modes of travel. These data sets will also be made available to local governments and researchers.

In July, Congress took an important first step on transportation policy when the Senate Environment and Public Works (EPW) Committee approved its portion of a surface transportation reauthorization bill (America’s Transportation Infrastructure Act). We were happy the bill included a pilot program based on the COMMUTE Act to help a select group of states and metros measure whether or not their investments are connecting people to jobs and services. This demonstrated the bipartisan support for the common sense idea of measuring the success of our transportation system by whether it creates access to jobs and services.

But we can and should do more. Access to jobs and services has to be the core of any transportation authorization. Support for the pilot in the Senate indicates an opportunity to do much more. That is why we are urging Congress to go further and require USDOT to collect the data necessary to develop a national assessment of access to jobs and services and set national goals for improvement.

The House of Representatives will soon release its proposed surface transportation authorization. This is an opportunity to demonstrate a new vision for transportation, based on modern data and valuing what really matters.

It’s time for Congress to act and hold ourselves accountable for improving access.

Why we’re thrilled to support the Build Local, Hire Local Act

A bike commuter wearing a suit, tie, and a helmet flashes a thumbs up to the photographer while biking on a busy road in San Francisco.

Last month, Senator Kirsten Gillibrand (NY) and Representative Karen Bass (CA-37) introduced legislation that would create transportation accessibility performance measures and a grant program to reconnect communities divided by highways. 

A bike commuter wearing a suit, tie, and a helmet flashes a thumbs up to the photographer while biking on a busy road in San Francisco.

Last month, Senator Kirsten Gillibrand (D-NY) and Representative. Karen Bass (D-CA), chair of the Congressional Black Caucus, introduced the Build Local, Hire Local Act (S. 2404 and H.R. 4101 ), legislation that would use federal infrastructure funding as a tool to hire people who live near new infrastructure projects for high-quality jobs. 

In the process, the bill creates a new access to jobs and services performance measure, and a technical assistance program, and a construction grant program to improve transportation connections in communities divided by highways. We’ve worked closely with the Senator and Representative in developing this legislation and are thrilled to support the Build Local, Hire Local Act.

The performance measure included in the bill requires states and metropolitan planning organizations (MPOs) to assess how well the entire transportation system—roads, public transit, bike lanes and sidewalks—connects people to opportunities, putting a particular emphasis on improving accessibility in low-income communities. States and MPOs must report these assessments to Congress, who will make the data publicly available online. Measuring accessibility would lead us to a transportation system that prioritizes efficient travel and a more equitable transportation system. 

These tools allow states and MPOs to better understand where people are traveling and to design transportation networks to maximize the ability of people to travel. It also allows states and MPOs to optimize their transportation networks to utilize all modes of transportation and even to understand how their investments interact with land use policies.

This connectivity and accessibility performance measure is similar to the COMMUTE Act, a bill that would create a pilot program for states and MPOs to use travel data collected by the U.S. Department of Transportation to measure and improve access to jobs and services by all modes. We’ve been advocating for this legislation for awhile, and a version of the COMMUTE Act is included in the Senate Environment and Public Works Committee’s recently passed long-term transportation policy bill

The Build Local, Hire Local Act’s technical assistance program and grant program take this performance measure a step further. To improve access to jobs and services by all modes, the bill will help communities—especially those bi-furcated by highways—find and build innovative projects that connect divided neighborhoods. 

This is an important step in the right direction. Too often, highway infrastructure tears apart communities, particularly disadvantaged communities, separating people from jobs, services, and connections to other neighborhoods. This not only exacerbates existing inequalities, it worsens air pollution and public health outcomes, turning neighborhoods from places where people want to be into places people want to get away from—via the highway. This bill seeks to fix that.  

“The goal of our transportation system should be to safely and efficiently connect people to jobs and services,” said our director Beth Osborne. “For too long, we have treated vehicle speed as a sufficient measure for this goal. Yet it fails to capture walking, cycling, and transit trips, and inaccurately measures vehicle trips.

“Transportation for America commends Senator Gillibrand and Representative Bass for this innovative legislation to measure and judge performance by what really matters in transportation: access by all modes of travel.”

A bipartisan effort to help states and metro areas determine if their transportation systems get you there

Providing states and metro areas with powerful data and accessibility tools can help them better measure the destinations that their residents can easily reach, equipping transportation agencies to more effectively plan investments that will help address those gaps.

In late September, Senator Baldwin (D-WI), along with cosponsors Senators Ernst (R-IA), Hatch (R-UT), and Markey (D-MA), introduced bipartisan legislation to provide communities with new state-of-the-art data tools that can be used to better assess how well their transportation networks provide access to jobs and daily needs.

S. 3491, the Connecting Opportunities through Mobility Metrics and Unlocking Transportation Efficiencies (COMMUTE) Act, requires the U.S. Department of Transportation (USDOT) to create a pilot program to provide a handful of states, metropolitan planning organizations, (MPOs) and rural planning organizations with data sets to calculate how many jobs and services (such as schools, medical facilities, banks, and groceries) are accessible by all modes of travel.

These data tools can be revolutionary for communities, enabling them to take a truly holistic view of their transportation networks and make more informed planning and project selection decisions. Why?

As we noted when a similar bill was introduced in the House last year, connecting people to work is arguably the most important goal for our transportation system that we generally do a pretty poor job of measuring. But as important as measuring jobs access is, only 20 percent of all trips and only 30 percent of vehicle miles traveled (VMT) are to and from work. This means that 80 percent of trips (70 percent of VMT) are for our other daily essentials—going to the store, visiting the doctor, dropping the kids off at school, etc.

The incredibly blunt metrics that most planners or communities have access to, like overall traffic congestion and on-time performance for transit, paint a grossly two-dimensional picture of the challenges people face while trying to reach their needs within a reasonable period of time. And these limited measures certainly don’t provide enough information to help these agencies make the hard decisions about what to build to best connect people to the places they need to go.

The use of these simple metrics results in the consideration of simple “solutions,” like adding expensive lanes to existing highways and road networks—costly solutions that often don’t solve the problem, or make it worse.

But today, there are precise new tools available that allow communities to more accurately calculate accessibility to employment opportunities, daily errands, public services, and much more, and then optimize their transportation networks and utilize all modes of transportation. (Like the tools used to evaluate Baltimore’s bus system overhaul, for example.)

But unfortunately, states and MPOs must pay for this more helpful accessibility data while the less useful congestion data is made readily available to them. This bill could start to change that by creating a pilot program that will give a handful of states, metro areas, and rural areas free access to the data, helping them make better use of their limited taxpayer dollars to bring the greatest benefits.

With the introduction of this bill, there are now bipartisan bills in both chambers of Congress to provide better data to local communities. Each bill is sponsored and cosponsored by members who sit on the committees with jurisdiction over the bills. This represents a tremendous step forward and we’re grateful for the bipartisan leadership of Senators Baldwin, Ernst, Hatch, and Markey.

Helping cities use data to measure progress and outcomes

The second year of our Smart Cities Collaborative will tackle how new technologies and new mobility are reshaping the right-of-way and curb space via four key topics. Our second post in a series on these topics examines the concept of using data to measure progress and outcomes.

Reminder: Applications for year two of the Collaborative are open until Friday, February 16. Find out more information about eligibility and apply to participate here.

As we continue building a forum for collaboration and providing direct technical assistance to a new cohort of cities, the second year of the Collaborative will explore how new technologies and new mobility are reshaping the right-of-way and curb space. The content and curriculum will be separated into four sub-topics; design, measure, manage and price. (Read the first post on design here.) This second topic will examine the importance of utilizing data to measure project and system performance to ensure that new technologies and mobility options are implemented in ways that help cities make progress on their long-term outcomes.

Measure

A heat map of biking trips logged in Seattle using the Strava app. Via https://labs.strava.com/heatmap/

Automated vehicles, shared mobility options, and innovations in transit have tremendous power to transform both the way we move around our cities and how our cities are designed. Yet, as these technologies become increasingly available, the possibilities for both positive and negative impacts for our communities grow in parallel.

And, although the tools are new and perpetually changing, cities must remain steadfast in pursuing their community’s vision.

These advances in technology are providing a wealth of detailed, real-time data that cities can and should use to measure their daily operations and inform their decision-making. Many cities recognize the value of this data and the impact it can have, but have struggled to find the right way to gather and utilize it effectively. As a result, even though they have access to more raw data than ever before, they are struggling to quantify how particular projects or initiatives are helping—or hurting—as they develop and test new solutions to their major challenges.

By using a robust set of performance metrics, cities can evaluate the impacts of pilot projects and better calibrate them to drive the outcomes they’re seeking. This data-driven approach ensures that cities implement new technologies in ways that tackle regional priorities, are anchored to long-term community goals and mitigate potential negative impacts of new technologies.

This focus on data tied to outcomes helps cities stay rooted and grounded in a climate where technologies are changing every single day.

This year, the Collaborative will continue to refine existing metrics that best indicate success across numerous priorities, such as equity, access to employment, safety, user experience and system performance, while working to develop new metrics and indicators for things such as curb utilization or street redesigns.

We’ll also endeavor to develop shared standards, allowing cities to compare the success of projects across jurisdictions, discover the best applications of innovative technologies and better determine how to affect positive change in their own community.

With these metrics firmly in mind, the Collaborative will introduce participants to the fundamentals of data science and cover best practices in data collection and analysis. We’ll focus on how internal governance can change to reflect a data-driven approach and ensure that resulting analyses are fed back into planning and real-time dynamic operations. We’ll also explore efforts across the country to create third-party repositories of mobility data—like Seattle’s, for example—that include both public and private transportation providers, and how cities are aggregating, anonymizing and utilizing these data.

Stay tuned for our next post on our third Collaborative topic this coming year—manage—and how cities can develop public-private partnerships and use curb management strategies as tools to drive long-term outcomes.

A bipartisan move to give states and metro areas access to better data to shape their transportation planning decisions

Congress took a bipartisan step today to provide states and metro areas with powerful data and accessibility tools that will help them better measure the destinations that their residents can easily reach, equipping transportation agencies to plan smarter transportation investments to address those gaps.

Congresswoman Esty (D-CT) — along with cosponsors Congresswoman Comstock (R-VA), Congressman Davis (R-IL), and Congressman Lipinski (D-IL) — introduced a bill this morning (Friday) to provide communities with valuable tools that can help them understand how well their transportation networks provide access to jobs and daily needs.

The Transportation Access & System Connection (TASC) Act would create a Federal Highway Administration (FHWA) pilot program to purchase new, precise data tools for 15 states and metropolitan planning organizations (MPOs) to calculate how many jobs and services (such as schools, medical facilities, banks and groceries) are accessible by all modes of travel. The bill ensures that at least six small communities are included in this pilot via their MPO.

Connecting people to work is arguably the most important goal for our transportation system, yet we generally do a pretty poor job of measuring how successfully our local roads and transit systems performs this base function. But as important as measuring jobs access is, only 20 percent of all trips and only 30 percent of vehicle miles traveled (VMT) are to and from work. This means that 80 percent of trips (70 percent of VMT) are for our other daily essentials — going to the store, shopping, or dropping the kids off at school, etc.

Until recently, transportation agencies could only monitor incredibly blunt metrics, like overall traffic congestion and on-time performance for transit, and while important, these paint a grossly two-dimensional picture of the challenges people face while trying to reach their needs within a reasonable period of time. And these limited measures certainly don’t provide enough information to help these agencies make the hard decisions about what to build to best connect people to the places they need to go.

Too often, the use of simple metrics results in the consideration of simple “solutions,” like adding expensive additional lanes to existing highways and road networks —costly solutions that often don’t solve the problem, or make it worse.

But today, there are precise new tools available that allow communities to more accurately calculate accessibility to employment opportunities, daily errands, public services, and much more. (Similar tools were used to run this analysis of Baltimore’s new bus overhaul, for example.) They allow states and MPOs to analyze a metro area and produce detailed data to help them optimize their transportation networks and utilize all modes of transportation as well as understand the interaction between transportation investments and economic development.

States like Utah, Delaware and Virginia and the cities of Sacramento and Los Angeles are already utilizing this data and seeing results. But unfortunately, states and MPOs must pay for this more helpful accessibility data while the more limited congestion data is made readily available to them. This bill will start to change that by creating a pilot program that will 15 states and MPOs free access to the data, helping them make better use of their limited taxpayer dollars to bring the greatest benefits.

We recognize Representative Esty and her cosponsoring Reps. Barbara Comstock, Rodney Davis, and Dan Lipinski. Let your representatives know that you support this bill – urge them to cosponor the Transportation Access & System Connection (TASC) Act (HR 4241)

House abdicates methodical policymaking for new regulations on automated vehicles

Congress has taken the first major legislative step to encourage & govern the roll-out of automated vehicles, passing the SELF DRIVE Act of 2017 by a voice vote today. Unfortunately, the House only consulted a narrow range of stakeholders like automakers and technology companies to produce this flawed legislation.

GoogleCar-selfdriving

House policymakers were eager to move quickly after facing heavy pressure from private sector groups like automakers, mobility providers (such as Uber or Lyft), and tech industry groups that are working on self-driving technology.

“This bill was produced quickly and voted upon in committee within hours of replacing the entire bill text with an amendment,” said T4America interim director Beth Osborne. “As a result, the unanimous subcommittee and committee votes are less about bipartisan agreement and more the product of a lack of interest in thoughtfully producing sound policy on a critical issue with the potential to reshape our towns, suburbs, and cities dramatically.”

“Without bringing mayors, city or state transportation officials, law enforcement, and others to the table, the House hastily legislated on an issue about which they’re poorly informed, with impacts that will be felt for decades primarily by people and groups who were never invited into the room,” Osborne said.

Cities aren’t opposed to producing legislation to govern how automated vehicles (AVs) operate on our streets — far from it.

But many are concerned by this rush to legislate without their input. They’re convinced of the long-term benefits that self-driving technologies could offer, but want a legislative framework that allows them to experiment, innovate and bring these new technologies to the market in their cities in flexible ways that help them meet other goals.

While no one wants to see a patchwork of regulations that stifle innovation, one of our primary concerns — and that of many of the cities — is that this legislation will preempt local authorities from managing their own streets and fail to give local leaders the confidence that manufacturers and operators will be aware of and follow local laws and regulations.

As written, depending on how certain terms are interpreted, any state and local laws could be at risk if they are found to be an “unreasonable restriction.” This vague language will almost certainly lead to costly legal battles to determine what that term even means when the rubber meets the road.

AVs absolutely need to be tested in real-world situations. But they also need to be tested in manner that ensures public safety and builds public confidence in the technology. Allowing huge levels of safety exemptions per manufacturer each year, increasing from the current level of 2,500, to 25,000 in the first year, up to 100,000 in just three years, is too much too fast. Especially considering that this technology is still very much in its infancy and these vehicles are likely to be clustered in urban centers and not evenly distributed.

What if three manufacturers all want to test the bulk of their vehicles in one or two cities? Shouldn’t federal safety watchdogs like the National Highway Traffic Safety Administration (NHTSA) have some role to play in assessing their safety along the way and deciding whether or not exemptions should increase based on actual results from testing?

When it comes to safety, cities (and others) also need access to the data on how these vehicles are performing on their own streets. While the bill does require manufacturers testing AVs to report all crashes to NHTSA, it doesn’t require data-sharing on disengagements, near misses or other vehicle movement, safety, and performance indicators. There are also no requirements to share any data with cities, states, academics or relevant parties such as safety advocates for independent review and wouldn’t be subject to the Freedom of Information Act (FOIA) either.

This legislation ensures that no one other than the private companies doing the testing will be able to learn anything from the massive amounts of data produced by the tests. In order to create more hospitable conditions for all modes of travel, especially AVs, cities and states need these data to inform and optimize their planning, policymaking and operations to prepare for the coming wave of automation.

It’s important that Congress take this issue more seriously and bring all the stakeholders together to produce thoughtful legislation that balances the needs of private industry with the public’s desire for safety, transparency, and improved mobility.

The next step will be a Senate version of the bill and we’re eager to work with them and bring cities to the table to produce something stronger than the House’s first attempt.

Going deep with regional leaders on using performance measurement

We wrapped up an in-person workshop today with seven local groups of metropolitan leaders, learning how performance measures and a data-driven approach to assessing the costs and benefits of transportation spending can lead to better decisions and a smarter transportation network.

Transportation Leadership academy boston 1 Transportation Leadership academy boston 2 Transportation Leadership academy boston 3

Throughout yesterday and today in Boston, MA, a team of T4America staff have been joined by some notable experts with on-the-ground experience to dive deep into the topic of performance measures with metropolitan leaders from seven regions across the country. It’s part of our yearlong Transportation Leadership Academy focused on performance measures.

What’s performance measurement? More carefully measuring and quantifying the multiple benefits of transportation spending decisions to ensure that every dollar is aligned with the public’s goals and brings the greatest return possible for citizens.

If you’ve been following along, we’ve been writing regularly about how the transportation law that Congress passed in 2012 (MAP-21) created a new system for states and metropolitan planning organizations (MPOs) to measure the performance of their investments against federally-required measures.

This year’s iteration of our Transportation Leadership Academy is focused on providing these local leaders with tools and support to incorporate this new system into their processes of creating plans, selecting projects, and measuring the effectiveness of each transportation dollar that gets spent. This program, created in partnership with the Federal Highway Administration (FHWA), is educating these seven teams made up of local business, civic, elected leaders, and transportation professionals.

Though the academy is focused on working with regional leaders, a few states also have experience with performance measures. In Massachusetts, as part of a 2013 deal to raise new revenue for transportation, the legislature required the DOT to develop and use performance-based criteria in the state’s transportation investment decisions. Stephanie Pollack, the head of MassDOT, shared her experience with this week’s attendees and why it makes sense to assess transportation projects together and against one another, rather than just sone-by-one.

“Transportation works as a network and fails as a network,” she said. “So why do people think we can fix the network project by project by project? I’m most interested in what is the best suite of projects.” She went on to describe why data matters, but only if you measure the right things. “You should be asking people what matters to them and measure that. If you don’t, you are telling your customers that what matters to them is unimportant. …Data is only useful if it helps you tell a story or make better decisions.”

There are other metro areas that have been using performance measures for years and have valuable experience to share.

The MPO for the Bay Area, the Metropolitan Transportation Commission (MTC), has done more than most metro areas when it comes to using data and sophisticated modeling to aid and assess their decision-making. Participants got to hear the Hon. Steve Kinsey discuss MTC’s deep experience using cost-benefit analysis and their quantitative approach to performance measures.

And Robin Rather, a strategic communications veteran who has done deep research into the topic, explained how the messages and language matter, i.e., making the case for performance measures in economic terms is one of the most effective ways to get skeptical MPO board members or the public to buy-in to the idea.

This second academy workshop wraps up early this afternoon, marking the end of the academy’s in-person gatherings. Training will continue via other forms through the rest of the year, and we’ll be following up with some thoughts on the academy and sharing the perspectives of some of the participants. Stay tuned.

Measuring what we value: Prioritizing public health to build prosperous regions

A new package of case studies released today by T4America, in partnership with the American Public Health Association, showcases a range of strategies that metro area planning agencies can use to strengthen the local economy, improve public health outcomes for all of their residents, promote social equity and better protect the environment.

CDC APHA health case studies

Today, we’re launching Measuring what we value: Prioritizing public health to build prosperous regions, four short case studies that extend our previous work on data-driven decision-making for choosing transportation projects.

Download the four case studies below.

A growing number of the metro leaders, elected officials and citizens we talk to are asking questions like: can the people in neighborhoods more likely to be unhealthy easily get out for a walk or bike ride without having to traverse dangerous streets? Do our regional planners effectively consider the impacts on regional air quality as we choose which projects to build? Is the area putting forward the most competitive possible projects to win limited state or federal funding for walking and biking?

A handful of metro areas have found smart, data-driven ways to better conceive, select and build the transportation projects that can help address these looming questions. We’re happy to share with you four of those stories from metro areas big and small: Sacramento, CA; Broward County, FL; Nashville, TN and Greensboro, NC.

Download each one below.


SACRAMENTO, CA
Promoting health and economic prosperity through data-driven decision-making

Citrus Heights community center groundbreakingUsing a lens of improved economic performance by improving public health, the Sacramento Area Council of Governments (SACOG) adopted several health- and social equity-related performance measures into a rigorous, data-driven process for choosing transportation projects, resulting in more projects that make it safer and more convenient to walk or bicycle.

Download the Sacramento case study. (pdf)

BROWARD COUNTY, FL
Healthy, safe & prosperous by design: Building complete streets

Prompted by a need for safer streets, the Broward Metropolitan Planning Organization (MPO) spearheaded an effort to build regional consensus and political support for planning, designing and building more complete streets projects. As a result, 16 of the MPO’s 31 jurisdictions have adopted Complete Streets resolutions or guidelines, and the MPO increased funding for active transportation projects, with 90 individual bicycle and pedestrian projects totaling $120 million awarded funding since 2012.

Download the Broward case study. (pdf)

NASHVILLE, TN
Prioritizing public health benefits through better project evaluation

Nashville missing sidewalksBacked by data from comprehensive health studies and growing public demand to make biking and walking safer and more convenient throughout the region, the Nashville Area Metropolitan Planning Organization (MPO) designed a new scoring and selection process to prioritize transportation projects that can bring health benefits. The MPO’s new approach substantially increased the amount of funding in the their long-term transportation budget dedicated to making it safer and more attractive to walk or ride a bicycle, making strides toward improving the health of the region’s residents.

Download the Nashville case study. (pdf)

GREENSBORO, NC
Healthy competition: Using data and modeling tools to win funding for active transportation projects

Greensboro sidewalks Guilford CollegeTo make walking and biking safer, more equitable and more convenient in Greensboro, North Carolina, the Greensboro Metropolitan Planning Organization (MPO) developed a rigorous evaluation and data-driven selection process to analyze and select the best possible bicycle and pedestrian projects for the metro area’s available funds, and to help the region better compete for the limited, competitive funding controlled by the state.

Download the Greensboro case study. (pdf)


The development of these case studies was made possible through a contract between the American Public Health Association and Transportation for America funded through cooperative agreement 5U38OT000131-03 between the Centers for Disease Control and Prevention and the American Public Health Association.  The contents of this document are solely the responsibility of the authors and do not necessarily represent the official views of the American Public Health Association or the Centers for Disease Control and Prevention.

Virginia launches program to remove politics from transportation investment decisions

This week Virginia DOT released a list of recommended projects across the state, the result of a new process to objectively screen and score transportation projects based on their anticipated benefits.

It may not sound like big news that a state has carefully measured the results it expects from billions of dollars in capital investments. Unfortunately, nearly all states rely instead on byzantine funding formulas and decades-old project lists, rather than measurable return-on-investment, to award funds for highway and transit projects. That means that this common sense change is a big one for the transportation system.

“This new law [HB 2 passed in 2014] is revolutionizing the way transportation projects are selected,” said Gov. Terry McAuliffe (D) in a statement on the release of the project scoring results. “Political wish lists of the past are replaced with a data-driven process that is objective and transparent, making the best use of renewed state funding.”

hb2 project apps

Fiscal year 2017 project applications and results of the analysis are mapped by location on the HB2 projects page.

It is not just the selection process itself that is novel; Virginia is also opening up its process to public review in a way that few states have. With its consumer-friendly website, virginiahb2.org, the DOT explains the process, eligible projects, and scoring factors used in ranking projects. This week, the list of recommended projects and their scores were also put online. The public will have opportunities to weigh in on the recommended projects before the final project list is approved by the Commonwealth Transportation Board in June.

Some of the top projects, based on total benefits, were adding high occupancy/toll (HOT) lanes along the I-66 corridor in Fairfax County; widening I-64 in Hampton Roads; extending Virginia Railway Express commuter rail service to Haymarket; and adding a second entrance to the Ballston Metro station. The number-one ranked project—the project with the greatest benefit per cost—is a small, locally requested road improvement project at the elementary school in the town of Altavista.

The new objective scoring process is the result of key reform bills passed by the general assembly: HB2, passed unanimously by the general assembly in 2014 and HB1887 passed last year. These bills instructed VDOT and the Commonwealth Transportation Board to create a new process to rank projects of all types, in each region of the state, on five key measures: economic development, safety, accessibility, congestion mitigation, and environmental impact. State funds are awarded to both statewide priorities and local needs that have the highest measurable benefits. We cover both bills in more detail in two Capital Ideas reports.

“We must ensure that every step we take is measured by its return on investment,” said House Speaker William Howell in 2013 prior to HB 2’s introduction. “Resources are too scarce and taxpayer dollars too precious to be thrown away on poorly planned transportation projects. Projects should have clearly defined goals and metrics that can be measured in an objective fashion. A ‘good idea’ is not good enough anymore.”

Virginia’s new process is part of a growing trend. As legislators throughout the country look for ways to get the maximum benefit out of ever-more-limited transportation funds and build trust and accountability in the way the dollars are spent, many are looking to new ways to measure project benefits and prioritize needs. Massachusetts’ Project Selection Advisory Council is developing a new process for ranking projects in that state. Louisiana and Texas each passed new laws last year to add score and select transportation projects.

Virginia’s political leadership deserves great credit for taking on this common sense reform and placing the public benefit in front of short-term political gains.

How civic open data can help make us safer

A federal government commitment to open data — epitomized in a White House “datapalooza” last Friday — has catalyzed the development of apps and tools that can help enrich citizens’ lives and help keep them safer. 

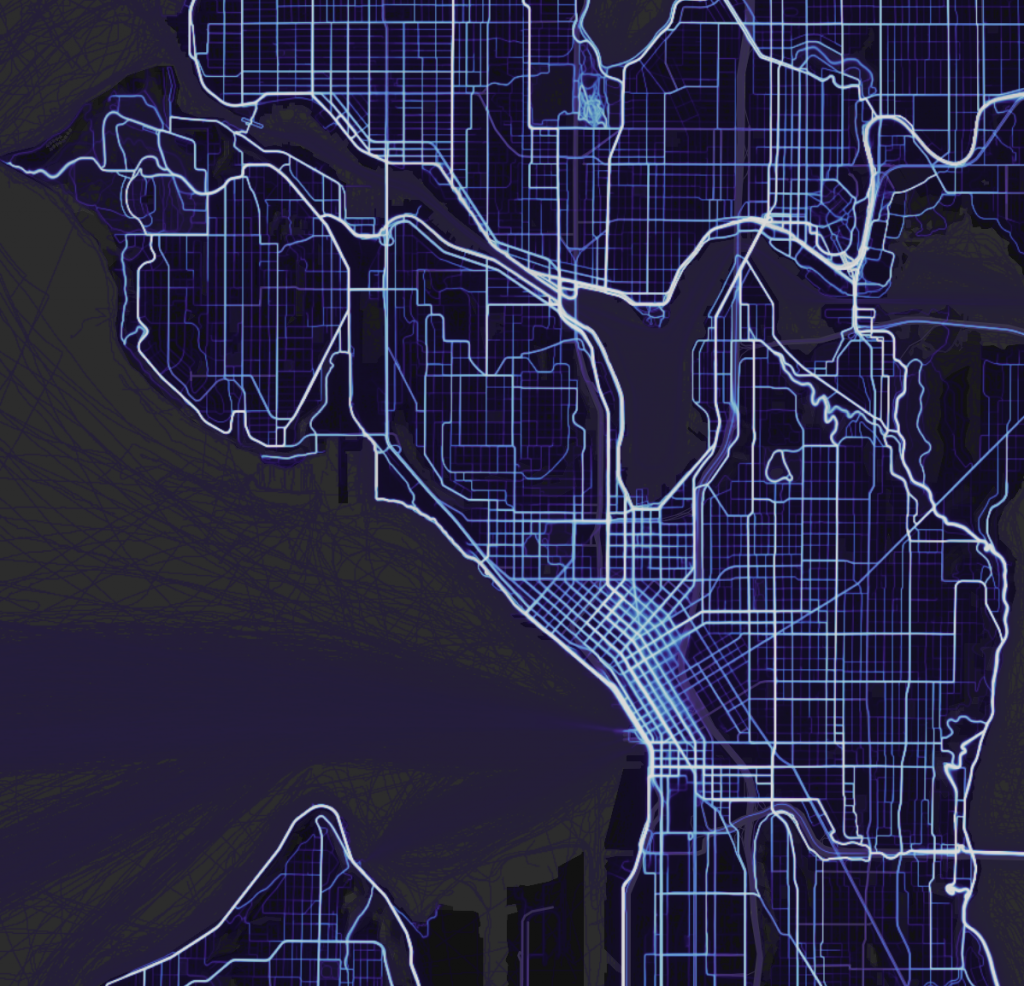
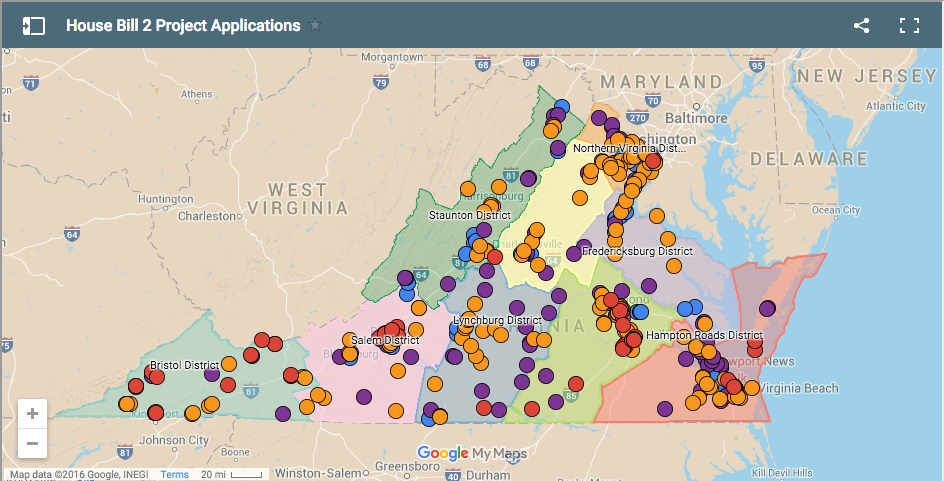
We’re no stranger at T4 America to the idea of using open government data to help ordinary citizens better understand their transportation system and how federal and local transportation policy needs to change to make them safer. We’ve regularly used public data from the U.S. Department of Transportation to seed useful tools, like the interactive map of ten years of pedestrian fatalities (Dangerous by Design) that uses the federal traffic fatalities database, or the nationwide map of all U.S. deficient bridges (The Fix We’re In For) sourced from the regular National Bridge Inventory submitted by states to the federal government each year.

The White House followed up their announcement of safety.data.gov earlier in 2012 with a day-long “datapalooza” in Washington, D.C. last week that brought together organizations and developers interested in safety data specifically.

There were some impressive demonstrations of what nonprofits and developers and public agencies have been able to create via public data sets. The real estate company Trulia showed how they’ve used local crime data to add heat maps to home listings or map searches to show how safe a neighborhood is in a city or town, relative to the rest of the city.

But perhaps the most impressive app on display came in a “the future is here” type of moment. Pulse Point is an app that leverages incredibly valuable-yet-usually-untapped skills dispersed among people all around you (CPR training) to solve the perpetual problem of a limited number of paramedics in a wide area to handle cardiopulmonary crises.

If you have CPR training, you sign up and register yourself and get the PulsePoint app. Partnering with local jurisdictions to make their 911 data available in realtime to the app makes it possible to “dispatch” all nearby CPR-trained people via their smartphone geolocation in the immediate area of someone needing CPR, while paramedics are also concurrently dispatched and en route. For someone in crisis, the 5 minutes between getting CPR from a trained expert at the store next door while waiting for paramedics to arrive could mean the difference between life and death.

It’s a stirring example of the same kind of cooperative sharing that’s made Zipcar and Car2Go and bikesharing and tool co-ops so successful in the last few years, but instead of cars or power drills, people are sharing something so valuable that it can save a life. Needless to say, the PulsePoint presentation received more than a polite round of applause at the end. You could tell that people who hadn’t seen it before were a little stunned.

But what does this have to do with transportation, per se?

Transportation data — and more importantly, having that data organized, accessible and public — is becoming more important than ever as declining transportation revenues have made it more important than ever to measure what we’re spending and see if we’re getting adequate bang for the buck.

MAP-21, the transportation bill passed this summer that goes into effect in just a few days, hopefully represents a transition away from the era of blank checks handed out to states without little accountability for measuring how those dollars get spent. What did they buy? Are we better off after a hundred million dollar project is finished? Is congestion reduced after spending a billion dollars? Are we healthier?

MAP-21 had a lot of references to “performance measures” — though there are still many question marks as to what those performance measures will actually be. But one thing you absolutely must have to measure performance is clear, organized, standardized, and open data. Taxpayers should be able to measure the performance of their transportation spending without having to file open records requests. App developers should be able to easily use available data to provide ever more transparency about decision-making to the very people funding the spending.

Of course, exactly what we decide to measure will have a huge impact on what does and doesn’t get built in the future. What will those performance measures be? What will DOT recommend?

I’m glad you asked. The US Department of Transportation is gathering public input right now on the new MAP-21 performance measures and other metrics with a public, web-based tool that anyone can weigh in with. Their forum closes this Sunday, but if you have the time today, stop by their idea forum for performance measures and offer your two cents. Here are some that we’re supporting and asking our supporters to “vote up”

Walkscore innovators turn to improving public transportation

CItyGoRound LogoFront Seat, the civic software company responsible for the massively popular Walkscore service, launched a new project today aimed at encouraging public transportation ridership. The project makes transit agency schedule data available, accessible, and open to developers so they can create applications to make it easier to ride. CityGoRound.org is a new portal where you can find the many applications developers have created to ease and increase the convenience of riding transit. Their mission, outlined on a newly launched site today, is very simple:

Our mission is to help make public transit more convenient. For example, an app that lets you know when your bus will arrive is way better than standing outside waiting for 20 minutes. If we can make public transit more convenient, more people will ride public transit. More people riding public transit equals less driving. Less driving equals a healthier planet.

To accomplish that, they’re doing three things: cataloging the hundreds of smartphone/web applications people have created to make riding public transit easier, putting pressure on agencies across the country that have not released their public data, and raising awareness of the need for government agencies to open up their data.

By typing in your zip code at CityGoRound.org, you may find, for example, apps that have taken publicly available transit agency schedule data and turned it into a slick iPhone or web app you can check on the go to find out when that next bus is coming, or when the next train will be headed your direction. One major barrier to riding transit is the learning curve that comes with unfamiliar schedules or service. If you’ve never ridden the bus home from work, are you going to wait in the snow at 8 p.m. for your first try, hoping you understood the posted timetable correctly?

The openness of government data might sound like something that only techies need to worry about, but more openness in government both increases accountability to the people and makes services more available and convenient for the public. Just this week, President Obama announced a new comprehensive open government plan, establishing parameters for all federal agencies to open up their operations — and their taxpayer-funded data — to the public.

“We are calling on transit agencies nationwide to open their data and follow the lead of the Open Government Directive issued this week by the White House,” said Mike Mathieu, Founder and Chairman of Front Seat. “City-Go-Round’s transit apps are a concrete example of how open data can improve citizens’ lives on a daily basis.”

Go check out the site today. If your city’s agency doesn’t provide open data for public transportation, they have a petition there you can sign to find out how to get involved in making that happen.

Front Seat created the service with the Transit Developers Group, generously supported with a grant from the Rockefeller Foundation.