About the findings
The findings of this report are significant and complex. There are nine sections on this page. Jump to any of them with these links below:
- How the IIJA increases emissions
- The current results are worse than predicted
- Early spending goes to high-emissions projects
- Urban areas are driving emissions
- Emissions by state
- Breaking down the funding: Discretionary grants
- Breaking down the funding: Formula funds
- Breaking down the funding: Climate and safety funds
- Projecting future highway formula spending
How the Infrastructure Investment and Jobs Act increases emissions
Based on our categorization of funded projects and application of published investments to emissions modeling figures,1 we find that the IIJA is being spent in a way that further exacerbates climate change.
If the IIJA was supposed to help the climate, it is failing. Too much money has gone to projects that worsen our climate problems and burden us with expensive liabilities. Despite positive messaging and attempted guidance, most states are not using funding in ways that will put us on track to avoid the worst consequences of climate change.

Since our initial analysis in February 15, 2024, we’ve evaluated an additional $20 billion in new federal funding awards. In total, we’ve looked at $150,432,593,647 in obligations (or funds designated toward specific projects) from 64,549 grant awards retrieved on June 4, 2024.
Overall, awards to car infrastructure projects make up nearly 70% of all obligations. A quarter (25%) of all obligated funds have gone to projects that increase road capacity in some way (which include highway widenings, new routes, and projects that add lanes). A slightly larger amount (25.5%) has gone to highway resurfacing projects and 18% went to maintenance projects that would not result in modeled emissions changes, like bridge replacements, redesigns or repair without added capacity, safety, or resilience projects.
Transit and passenger rail projects represent about 20% of funding (FTA formula awards have been slow to obligate, or designate funding to projects, so this share is likely to increase over time), and a meager 3% (3.1%) of obligations have gone to shared mobility, active transportation, and travel demand management projects. Further, 1.5% has gone to projects that help shift freight off roads to cleaner modes like rail or projects that enhance the efficiency of existing roads. Less than 1% of evaluated obligations have gone to investments advancing EV infrastructure projects (though, like transit grants, these new project types have been slow to obligate and outlay).
This report uses estimates based on an emissions modeling tool to assume how many tonnes of CO2 equivalent (CO2e) emissions are added cumulatively over baseline, pre-IIJA levels between 2022 and 2040. All references to added CO2e emissions from the IIJA refer to this projection of cumulatively added emissions over the transportation baseline between 2022 and 2040. This baseline was created before the passage of the Inflation Reduction Act, potentially skewing the total added emissions higher than more recent baselines. The projections do not assume additional spending after the IIJA, and results could worsen if the next reauthorization does not address these issues.
We estimate these IIJA investments to build new highways will produce, cumulatively, over 77.5 million metric tonnes of CO2e greenhouse gasses between 2022 and 2040 over baseline, pre-IIJA levels. For the IIJA to be climate-friendly, emissions-reducing investments toward transit, walking, biking, and electric vehicles have to make up for the emissions added from projects that increase driving. Unfortunately, the IIJA is not doing enough.
Only 35.1 million tonnes of CO2e will be reduced based on current levels of investments in emissions-reducing projects. Investments in emissions reducing projects are not even close to offsetting emissions increasing projects. Taking the emissions producing and emissions reducing impact of IIJA project investments altogether, the IIJA will cumulatively add a net 42.2 million metric tonnes of CO2e greenhouse gasses over baseline levels through 2040.
If the IIJA was supposed to help the climate, it is failing. Too much money has gone to projects that worsen our climate problems and burden us with expensive liabilities. Despite positive messaging and attempted guidance, most states are not using funding in ways that will put us on track to avoid the worst consequences of climate change.
The vast majority of projects with poor emissions outcomes in this dataset are those selected by and paid for with federal highway formula dollars. Of $116.6 billion in analyzed Federal Highway Administration (FHWA) formula grant spending, only $6.8 billion of analyzed spending has been obligated to directly emissions-reducing projects (this excludes resurfacing projects) such as electrification, active transportation, and bus lanes. In comparison, over $36.7 billion has been obligated toward projects that add new road capacity.
The highest-emitting scenario
The transportation system remains one of the most significant sources of greenhouse gas emissions in the US, but its emissions are projected to decline thanks to new policies from the Inflation Reduction Act incentivizing the adoption of electric vehicles, Advanced Clean Cars rules, and EPA and National Highway Traffic Safety Administration emissions and fuel efficiency standards. But even as vehicles get more efficient, those gains will be undercut if we continue to invest in projects that make driving the only viable mode of travel.
Vehicle fleets are slow to turn over and drivers are holding on to their cars seemingly longer and longer, making these policies slow to reach maximum impact. Electric vehicle manufacturers are paring down their expectations for sales in the future. Continuing investment in car dependency and putting all of our emissions reductions efforts in the electric vehicle basket means we risk catastrophic warming if we are unable to hit adoption targets. Reducing demand for driving and accommodating multimodal travel not only directly reduces emissions; it helps reduce the risk of missing other targets in other sectors.
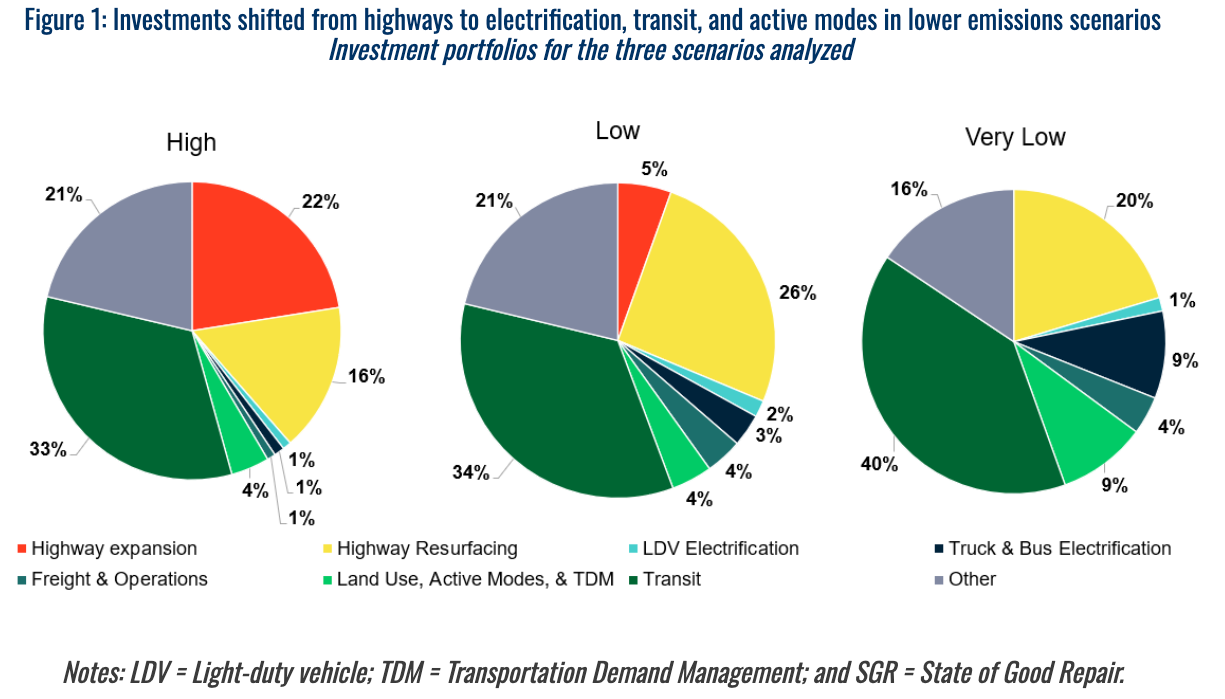
Georgetown Climate Center and the Rocky Mountain Institute’s three investment scenarios
A March 2023 analysis from the Georgetown Climate Center and Rocky Mountain Institute outlined three potential investment scenarios for the Infrastructure Investment and Jobs Act (IIJA): a high-emission scenario, a low emissions scenario, and a very low emissions scenario. Our analysis finds that states are spending more on highway and road capacity expansion than the “High Emissions” scenario (at left in the graphic above), the most pessimistic projection prepared in their analysis.
T4A analysis of over 64,000 IIJA grant awards
Outputs from GCC’s proprietary modeling tool demonstrates how investments in more roads induce demand for more travel, changing how much energy and fuel is used across a vehicle fleet. Even if the fleet grows more efficient over time, more car travel will still tend to produce more emissions than if the same trips had not happened or had been taken on a different mode. Because states are failing to use the infrastructure law at scale to diversify the low-emission options available, states’ overall spending of the IIJA is so far a major hindrance to efforts to combat climate change. This is due to billions in investments that double down on car dependence, inducing more driving and sprawling development. These investments are costly to maintain, make it harder to build emissions-reducing projects in the future, and drag down the benefits of renewable energy and electrification. All of this adds to greenhouse gas emissions that will lead to increasingly dangerous increases in global temperatures.
The Congress that passed the IIJA is responsible for not creating essential policy guardrails to unsustainable spending. Both “sides” traded in their principles for bipartisanship.
Progressives failed to fight for transportation to be more equitable, affordable, healthy, and safe. Conservatives failed to keep big-spending state departments of transportation, like California and Texas, from using federal dollars to ignore their repair needs and expand their liabilities without demonstrating how they would afford to pay for long-term maintenance themselves. If states continue to spend these funds like this, the United States will need another “once in a lifetime” infrastructure investment just to pay for the repair of new highway infrastructure assets built under the IIJA.
Early spending goes to high-emissions projects
Highway expansion projects maintain a consistent proportion of funding across each analyzed fiscal year. However, billions of dollars in federal funding are yet to be designated to projects. Future usage of already appropriated IIJA funds will change the composition of these charts, increasing the amount of money going toward projects that are slower to roll out, like transit and electrification. However, based on analyzed allocation ratios, funding for emissions increasing highway expansion will likely remain a large priority.
Considering funding for FHWA formula projects in future fiscal years and available, unspent funds, there may be between $150 and $160 billion in FHWA formula funding remaining in the IIJA at the time of analysis (June 2024). We do not currently have access to data on how states are transferring federal highway funds between programs or to transit. We assume states are transferring at rates comparable to pre-IIJA levels, based on prior NCHRP research. While it is possible that the remaining funds could be used to bring the IIJA to a breakeven point on emissions, net zero shift from baseline transportation emissions, federal spending on new highway expansion projects would need to decline to zero in very little time and be entirely redirected to emissions reducing projects. Based on states’ current spending patterns and documented plans, this is extremely unlikely.
The faster that transit, biking, and walking projects get built, the faster their emissions reducing benefits offset and reduce future driving. On the other hand, outlayed funds for road expansion projects begin the cycle of induced demand, increasing lane miles, total vehicle travel, and emissions. Unfortunately, emissions increasing projects are faster to obligate than the most impactful emissions reducing projects.
Whether urban or rural, entrenching car dependence increases emissions
There’s a longstanding misconception that rural areas, where people tend to live further away from destinations and have to drive longer distances, produce more GHGs than urban areas. While it’s true that rural areas may emit more per capita, the actual metric tonnes of emissions from transportation in rural areas are an order of magnitude smaller compared to urbanized ones. And for those who live near compact rural town centers, they’re actually more likely to drive fewer miles than those who live in low density urban areas. Emissions increases are not concentrated in rural areas, but instead grow immensely, both per capita and in total metric tonnes of CO2e increases, in urbanized, car-dependent suburbs. Walkable, connected places, whether rural, suburban, or urban are associated with lower per capita emissions and healthier outcomes.
To put it simply, rural counties are not the problem. The true problem is disconnecting infrastructure and a lack of options.
Despite this reality, the misconception that simply tracking greenhouse gas emissions could harm rural communities remains so strong that on April 10, 2024, the US Senate voted 53-47 to pass a congressional review act to effectively repeal the USDOT’s new measure for states and Metropolitan Planning Organizations (MPOs) to track emissions. Not long after going into effect, the rule was struck down by a federal judge from Texas, and as of this report, a final decision is still pending an administrative appeal.
While both rural and urban counties must make further progress to reduce emissions, urban counties make up the vast majority of emissions increases and also reductions.
When evaluating awards with county data included in this dataset, rural counties, which we define as those with a Rural Urban Continuum Code (RUCC) of 4 or higher, are home to projects that will produce only 14% of new net CO2e emissions increases. Urban counties, which are defined as having a RUCC of 3 or lower, make up the remaining 86% of total emissions.
In order to achieve a net emissions reduction, more tonnes of CO2e need to be reduced than increased. In urban/metropolitan counties, emissions producing projects have a disproportionately worse climate impact than in rural counties; there is a 3.1 ton of CO2e increase for every 1 ton of CO2e reduced by projects, relative to baseline levels. In rural/non-metropolitan counties, that ratio is 2.45 tonnes of CO2e increased for every 1 ton of CO2e reduced by projects. Across rural and urban contexts, we need to improve how we choose transportation projects to achieve climate goals.
If most people can only get around using personal, polluting vehicles, then it makes sense that higher populations will correspond with more emissions. In other words, since most Americans travel by car, most emissions will come from U.S. cities where a large number of Americans live and travel.
Fortunately, that’s also where major urban mobility transformations can slash emissions. Benefits of investment in transit, walking, and biking scale up with compact development, regardless if it's in urban or rural areas. Transportation and land use policy as a whole needs to change to incentivize more sustainable ways to get around that are more affordable for people, in both rural and urban contexts.
When considering rural and urban states, the difference is even more apparent. Very urbanized states (like California, Delaware, or Florida), where less than 20% of the population is in rural areas, are projected to lead emissions increases.
Further, when factoring in the emissions-reducing benefits of state-of-good-repair projects, some rural states seem to be spending their Infrastructure Investment and Jobs Act (IIJA) funds in a way that may reduce cumulative emissions over baseline transportation levels by 2040.
With the bulk of emissions coming from urbanized states, it's important to focus on where there is greatest potential for emissions reduction. Canceling expensive highway projects in urban areas would free up billions of dollars that could be reallocated toward transformational projects to reduce emissions and increase transportation options for all types of communities, including in rural communities. Colorado and Minnesota, under new state laws that help put climate goals and transportation programs in sync, have canceled highway projects and are shifting funding and planning practices toward emissions reducing projects.
The majority of awards to road widening projects funded by the IIJA are taking place in urbanized metropolitan areas. To reduce emissions, states, MPOs, and localities should adjust their strategy in these areas and make transformative investments in public transit, compact land use, or active transportation.
Emissions by state
The majority of states, 32 out of 50, are using IIJA funds in ways that will increase emissions due to outsized investment in highway building that will result in more driving, and more emissions. The 18 or so states identified in this analysis that are on track to reduce emissions with IIJA funds are prioritizing state of good repair, transit, and multimodal access before highway expansions.
These maps show projected net emissions increases and decreases for each state according to how they have used their federal infrastructure law investments so far.
This map visualizes, per capita, how much emissions are shifting as a result of IIJA spending. These changes are guided largely by states’ formula fund spending, as it represents the majority of evaluated funds in this dataset.
Texas is using federal dollars to build and widen more roads than any other state, and as such will see the largest increase of GHGs from IIJA investments. Texas’ investments in highway expansion are so large, that it would take the cumulative emissions from the runners-up, Florida, North Carolina, Ohio, and Pennsylvania (13.1 million metric tonnes CO2e, combined), to match the scale of new emissions from Texas (12.5 million metric tonnes CO2e ) alone. What may be surprising to many, however, is that the sixth worst emitting portfolio in this dataset is from California. While California has built a reputation for environmental friendliness, the continued investment in building new or expanded roads indicates a disconnect between supposed climate-conscious values and investments.
Highway expansion, subsequent sprawling suburban development, and car dependency add fuel to the climate crisis. Still, over 19% of California’s portfolio of IIJA investments has gone to capacity-increasing projects like these. Of total investments in highway/capacity expansions, California trails only behind Texas (1) and Florida (2) as the third biggest spender on road expanding and widening projects. If we only considered the total production of emissions from highway expansion, and not any net reduction of emissions from other project types, California would be the third most emitting state. On the other hand, if we only considered the total emissions reduction from transit, system operations, active transportation, and other projects, California would be the second most emissions-reducing state. California’s decisions to invest in highway expansions blunt its climate and environmental ambitions and undermine the benefits the state would receive from other forward-looking emissions-reducing investments they are making.
We find that the states and jurisdictions that are spending the least amount of their IIJA funds on capacity expansion include the District of Columbia (DC), South Dakota, Hawaii, Maine, and Nebraska, and those spending the least, per capita, are DC, Massachusetts, Oregon, Nebraska, and Hawaii. However, the IIJA’s spending is just the tip of the iceberg. Federal funding represents only part of total transportation budgets in some states or the majority for others. Usage of federal funds come with data reporting requirements (which can be onerous for smaller resurfacing projects) and can open projects up to federal environmental review processes. Many projects are funded only with state dollars to avoid federal processes and those projects are not evaluated in this analysis. In California, federal funding only represents about 25% of programmed funds, in Texas, a third of the budget and in Montana, it makes at least 80% of highway and bridge improvements.
If these investment patterns that prioritize new roads above all illustrate anything, it is that this issue does not track with traditional partisan political geography. Perhaps surprisingly, rural states with limited budgets may be more likely to see reduced emissions compared to baseline projections than urban states, as they may be forced to prioritize repair of existing assets before spending limited funds to build new roads (which creates fiscal liabilities as states need to maintain new assets). Meanwhile, urbanized states from California to Florida are continuing broad investments in car-dependent infrastructure. This analysis does not extend to the emissions impact from states’ total transportation plans and projects, missing both good and bad projects. This dataset cannot account for multi-billion highway expansions funded by state and local governments in extremely urbanized areas, like the entirely toll funded New Jersey Turnpike Expansion. Emissions reducing state funded projects and programs, like the California Climate Investments program and transit expansions funded under Move Ahead Washington, are not evaluated in this analysis as well.
Discretionary grants
Because this dataset from USASpending.gov is limited to obligated funds, it does not include announced discretionary grant awards that have not yet been obligated, including large, prominent programs like the Charging and Fueling Infrastructure grants or Low or No Emission Bus Program grants. However, the Biden Administration tracks the rollout of the infrastructure law and Inflation Reduction Act’s programs on the Invest.gov website, which maps out projects across the country, including data on announced but not yet obligated projects. To illustrate the disproportionate significance of formula programs versus discretionary programs, we evaluated a selection of Invest.gov projects from the same USDOT sub agencies (Federal Highway Administration, Federal Transit Administration, Federal Railroad Administration, and Office of the Secretary of Transportation) that we evaluated in the USASpending analysis.
We evaluated 2,944 awards found on Invest.gov from the Build America Bureau, Office of the Secretary, Federal Highway Administration, Federal Railroad Administration, and Federal Transit Administration worth up to $55.2 billion in announced grants. When categorized according to strategies from Georgetown Climate Center’s Transportation Investment Strategy Tool, we found that these awards would reduce transportation emissions compared to baseline levels by a net 18.4 million metric tonnes of CO2e, cumulatively, between 2022 and 2040.

However, for existing FHWA formula program obligations alone, a net 51.2 million tonnes of new CO2e emissions is projected to be added over baseline, more than completely undoing the emissions reductions from all evaluated discretionary grant programs.
When more than 30% of federal formula dollars goes toward emissions increasing projects, discretionary grants cannot overcome the scale of the federal formula programs’ negative climate impact. The scale of emissions coming from the federal highway formula program as a default dwarfs the smaller portion of funding set aside for emissions reducing projects under discretionary grant programs.
As for USDOT’s multimodal discretionary programs, our analysis of Infrastructure for Rebuilding America (INFRA), National Infrastructure Project Assistance (MEGA), Rural Surface Transportation Grant (Rural), and Rebuilding American Infrastructure with Sustainability and Equity (RAISE) grant awards found that over 20% of funds have gone to projects that expand roads.
Many road building discretionary awards address basic access to road networks in disconnected communities where intense development is unlikely (like this road building project linking an Alaskan village to services), while others are designed to mitigate congestion along freight corridors (including freight hauling coal). Though there is obvious nuance to these grant awards (many of which are addressing crucial equity issues), billions in discretionary grant funding is being directed toward applicants' emissions increasing projects.
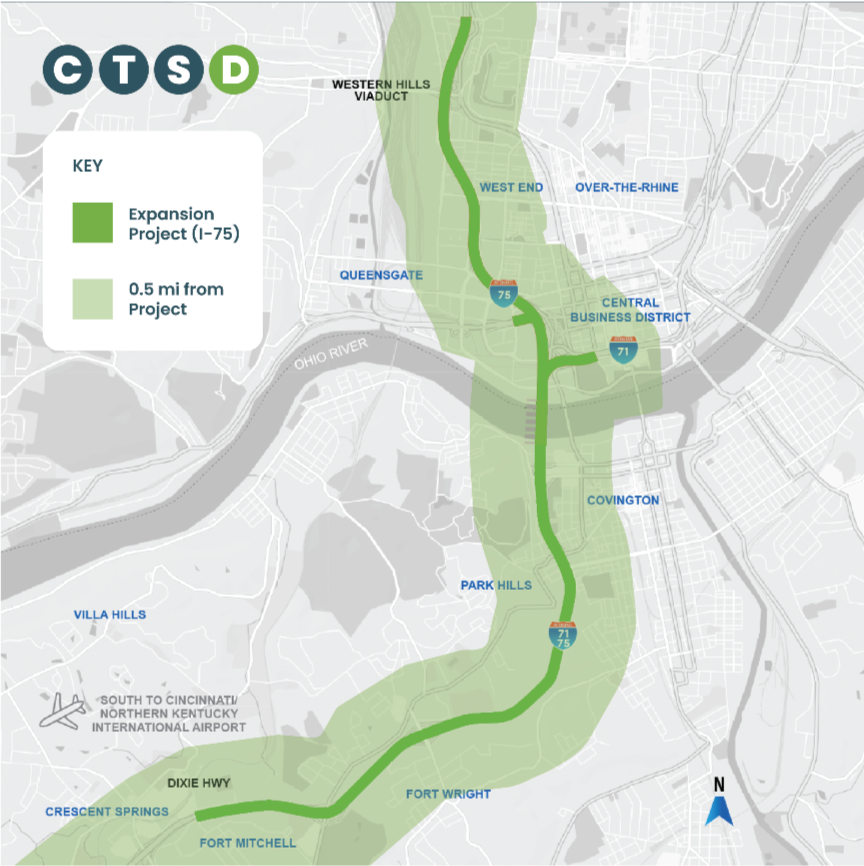
Highway expansions increase emissions and further community divides. Under the Bridge Investment Program, over $1 billion has gone to expansion projects, perpetuating the legacy of urban renewal in places where it has already failed, including known boondoggles like Cincinnati’s Brent Spence Bridge project currently under investigation for civil rights violations.
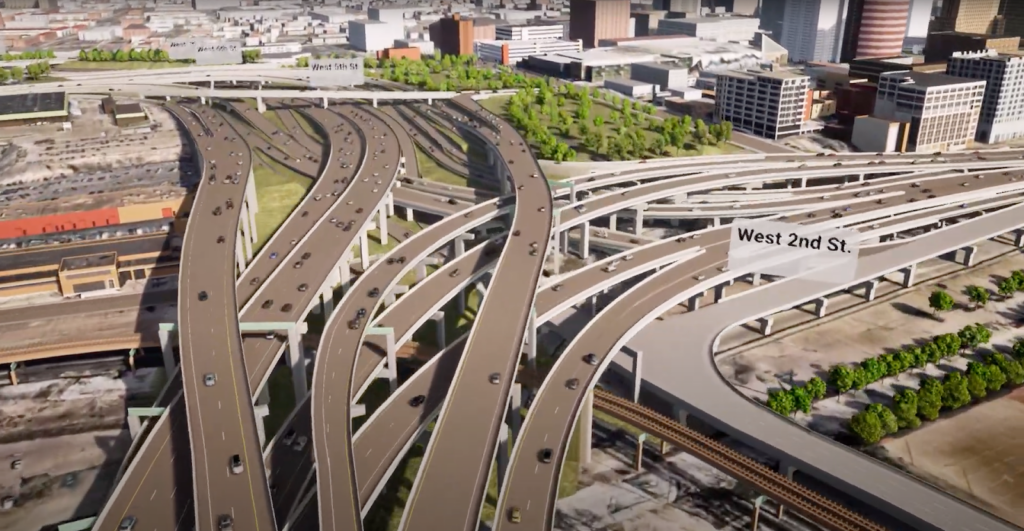
Highway expansions reduce air quality for surrounding neighborhoods. Funded proposals expand on an existing tangle of urban freeways in hopes of mitigating congestion. Source: Coalition for Transit and Sustainable Development & Brent Spence Bridge Corridor.
Finally, this organization strongly supports competitive grant programs as a way to support competition and innovation in the transportation program. Rather than being focused on a “fair” allocation of funds or a mode of transportation, competitive grant programs are about outcomes and benefits. They are also generally more flexible in terms of who can access them and what they can be used for. However there remain challenges that should be considered and addressed.
It takes some work to discern what programs exist, which works best for which project, how to apply for them, and where to find local matching funds. Federal discretionary grant applications can take a lot of resources and time to access, particularly those that require a benefit-cost analysis using the rather rigid approach laid out by USDOT and the White House’s Office of Management and Budget (OMB). Then signing grant agreements and managing federal funds are also challenging. Some under-resourced communities determine it is too much to take on.
USDOT has done a lot of work in this space to assist communities in working through the federal grant system, but Congress and OMB needs to be a part of this too. There is a way to protect taxpayer dollars without the bureaucracy and barriers that overwhelm small communities. Federal grant applications could provide the alternative for applicants to use an online format with directions and questions for grantees to answer, rather than requiring people to develop them from scratch, often requiring the hiring of a grant writer. There could also be an alternative for grantees to do their benefit-cost analysis through an online interactive system, much like tax preparation software. Or there could be a funding threshold before a benefit-cost analysis is needed. Finally, there should be a way to have under-resourced communities that run into funding problems (e.g., when a bid comes in high) to compete for reserve funds to prevent cutting back the project in a way that would undermine the outcomes that competitive grant programs are supposed to produce. Again, much of this will require the active support of Congress and the White House.
Formula funding
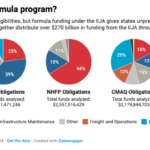
The National Highway Performance Program is the largest federal highway formula program, making up over half of all federal highway formula apportionments that states can expect from the IIJA. Its name is also deceptive: it is extremely flexible and can be used not just to prioritize highways, but projects across a range of types that can reduce emissions, including transit projects along limited access highways. Going further, up to 50% of program funding can be “flexed out” to tackle priorities set in other programs. For instance, funds from the National Highway Performance Program, which has broad eligibilities to fund highway construction and maintenance, could be moved to the Congestion Mitigation Air Quality Program or Carbon Reduction Program, which can fund a wide range of emissions reducing projects including bikeshare systems, transit, heavy-duty vehicle electrification, and more. However, states have so far used NHPP obligations to fund over $22 billion worth of road capacity increases highway expansion projects.
Most would choose not to take out a new loan when they’re unsure if they can plan to pay off existing interest payments. When it comes to federal funds from the IIJA, state DOTs do not have to worry about long term financial sustainability. Provisions from the INVEST Act (the House’s proposal that was ultimately replaced by the IIJA) would have limited states’ ability to use the largest program’s funds to widen or build new roads unless they demonstrated progress toward fixing their existing system, considered cheaper or more efficient options to move people or freight, and actually had a plan to keep the new project in a state of good repair continuously. Had these common sense reforms proposed in the House’s INVEST Act been passed in the IIJA, the NHPP could have been an effective program that kept America’s roads and bridges in a responsible and safe state of good repair. Instead, the program has by far the worst impact on the climate out of any FHWA program, creating new emissions and increasing the cost of infrastructure that states will have to pay to maintain for decades into the future.
The only other program that builds more highways and expands more roads (thus inducing more emissions) per dollar apportioned to the program is the National Highway Freight Program (NHFP), though it is significantly smaller in terms of overall funding than NHPP. Project selection priorities need to shift at the programmatic level to ensure that overall goals to reduce transportation emissions align with selected capital projects.
While different programs have different project eligibilities, formula funding under the IIJA gave states unprecedented opportunities for flexibility within each program. The National Highway Performance Program and National Highway Freight Program are leading in terms of obligations to emissions increasing highway projects.
While data from USASpending.gov shows funds that have been reported as obligated under each program, the flexible nature of FHWA formula programs and data limitations obscures how much funding has been shifted out of a given program in total. Access to internal FHWA data would allow for an analysis of how funds have been shifted to transit programs. Previous analyses found that most states transferred between 4% and 10% of their FHWA formula funds to the Federal Transit Administration, though an analysis of transfers made since the passage of the IIJA is not available.
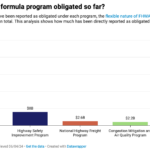
The Surface Transportation Block Grant Program is among the fastest to report obligations compared to total FY22-FY24 apportionments, followed by the Highway Safety Improvement Program and National Highway Performance Program. However, programs that are designed to reduce emissions and improve climate resilience (the Congestion Mitigation and Air Quality Program (CMAQ), and the new Carbon Reduction Program (CRP) and Promoting Resilient Operations for Transformative, Efficient, and Cost-Saving Transportation Program (PROTECT)), are the slowest to obligate.
Based on the proportion of formula funds that remain, and how states have spent their funds in the past, emissions are likely to continue to grow as they have under the first portion of the IIJA. For every million dollars invested in the National Highway Performance Program, there is an increase of 672 tonnes of CO2e added cumulatively over pre-IIJA baseline levels through 2040, based on current trends. The NHPP program has up to $93 billion in funding remaining (depending on how much funding has been flexed out or into the program).
Why are we expanding road capacity under emissions-reduction, resilience, and safety programs?
The Congestion Mitigation Air Quality Program, PROTECT Program and the Carbon Reduction Program were touted as prime examples of the infrastructure law’s commitments to climate and emissions mitigation. However, states transferred millions out of CRP and PROTECT formula programs to fund status quo transportation projects. Even among the funds obligated in the name of these programs, we have identified hundreds of millions of dollars in obligations directed toward projects that may end up worsening climate change.
In part thanks to flawed modeling assumptions that improperly account for induced demand and generous project eligibilities written into the IIJA, climate-friendly programs are actually supporting projects that will worsen the impacts of climate change—whether they are directly funding road widening projects or offsetting costs.
Carbon Reduction Program
At passage, the Carbon Reduction Program (CRP) came with flawed, unambitious project eligibilities, many overlapping with the National Highway Performance Program, and with the ability to flex out up to 50% of funding to other programs. Some states, such as Texas, have announced their intent to transfer out CRP funds in their Carbon Reduction Strategy. This analysis finds that CRP funds have been used in ways that offset softer costs for highway expansions, buying “energy efficient lighting” and new intelligent transportation system technology to supplement major widenings for Wisconsin’s I-43 and North Carolina’s I-85. The CRP has also directly funded new expansions for managed lanes, such as for a new expressway in Washington.
Adding new lane miles, even when managed or tolled, induces more driving and transportation emissions. At the very least, including project eligibilities with minimal or even negative impact, while allowing up to 50% of program funds to be drawn out to programs that outright increase emissions is cause for greater scrutiny of the program in the future. Is efficient lighting or new digital road signage (including the message signs that state DOTs put jokes on) the best use of limited funds to reduce emissions when active transportation and transit infrastructure are far more transformative investments? More efficient road designs, LED lighting, travel demand management, and intelligent transportation systems are already eligible projects under other existing programs. The very purpose of the Carbon Reduction Program is undermined when it offsets costs for programs that increase emissions, like the NHPP.
But the CRP is a young program, and only 20% of states’ available Fiscal Year 2022 through Fiscal Year 2024 funding apportionments have been spent down. States like Maryland are making plans to spend the funds wisely, taking their time to execute projects with maximum impact and benefits to communities, not just plugging them into the status quo program. But as we wait for the CRP’s emissions reducing projects, we often see the same old in the meantime: more lanes, more emissions.
FHWA hosts states’ Carbon Reduction Strategies online.
PROTECT
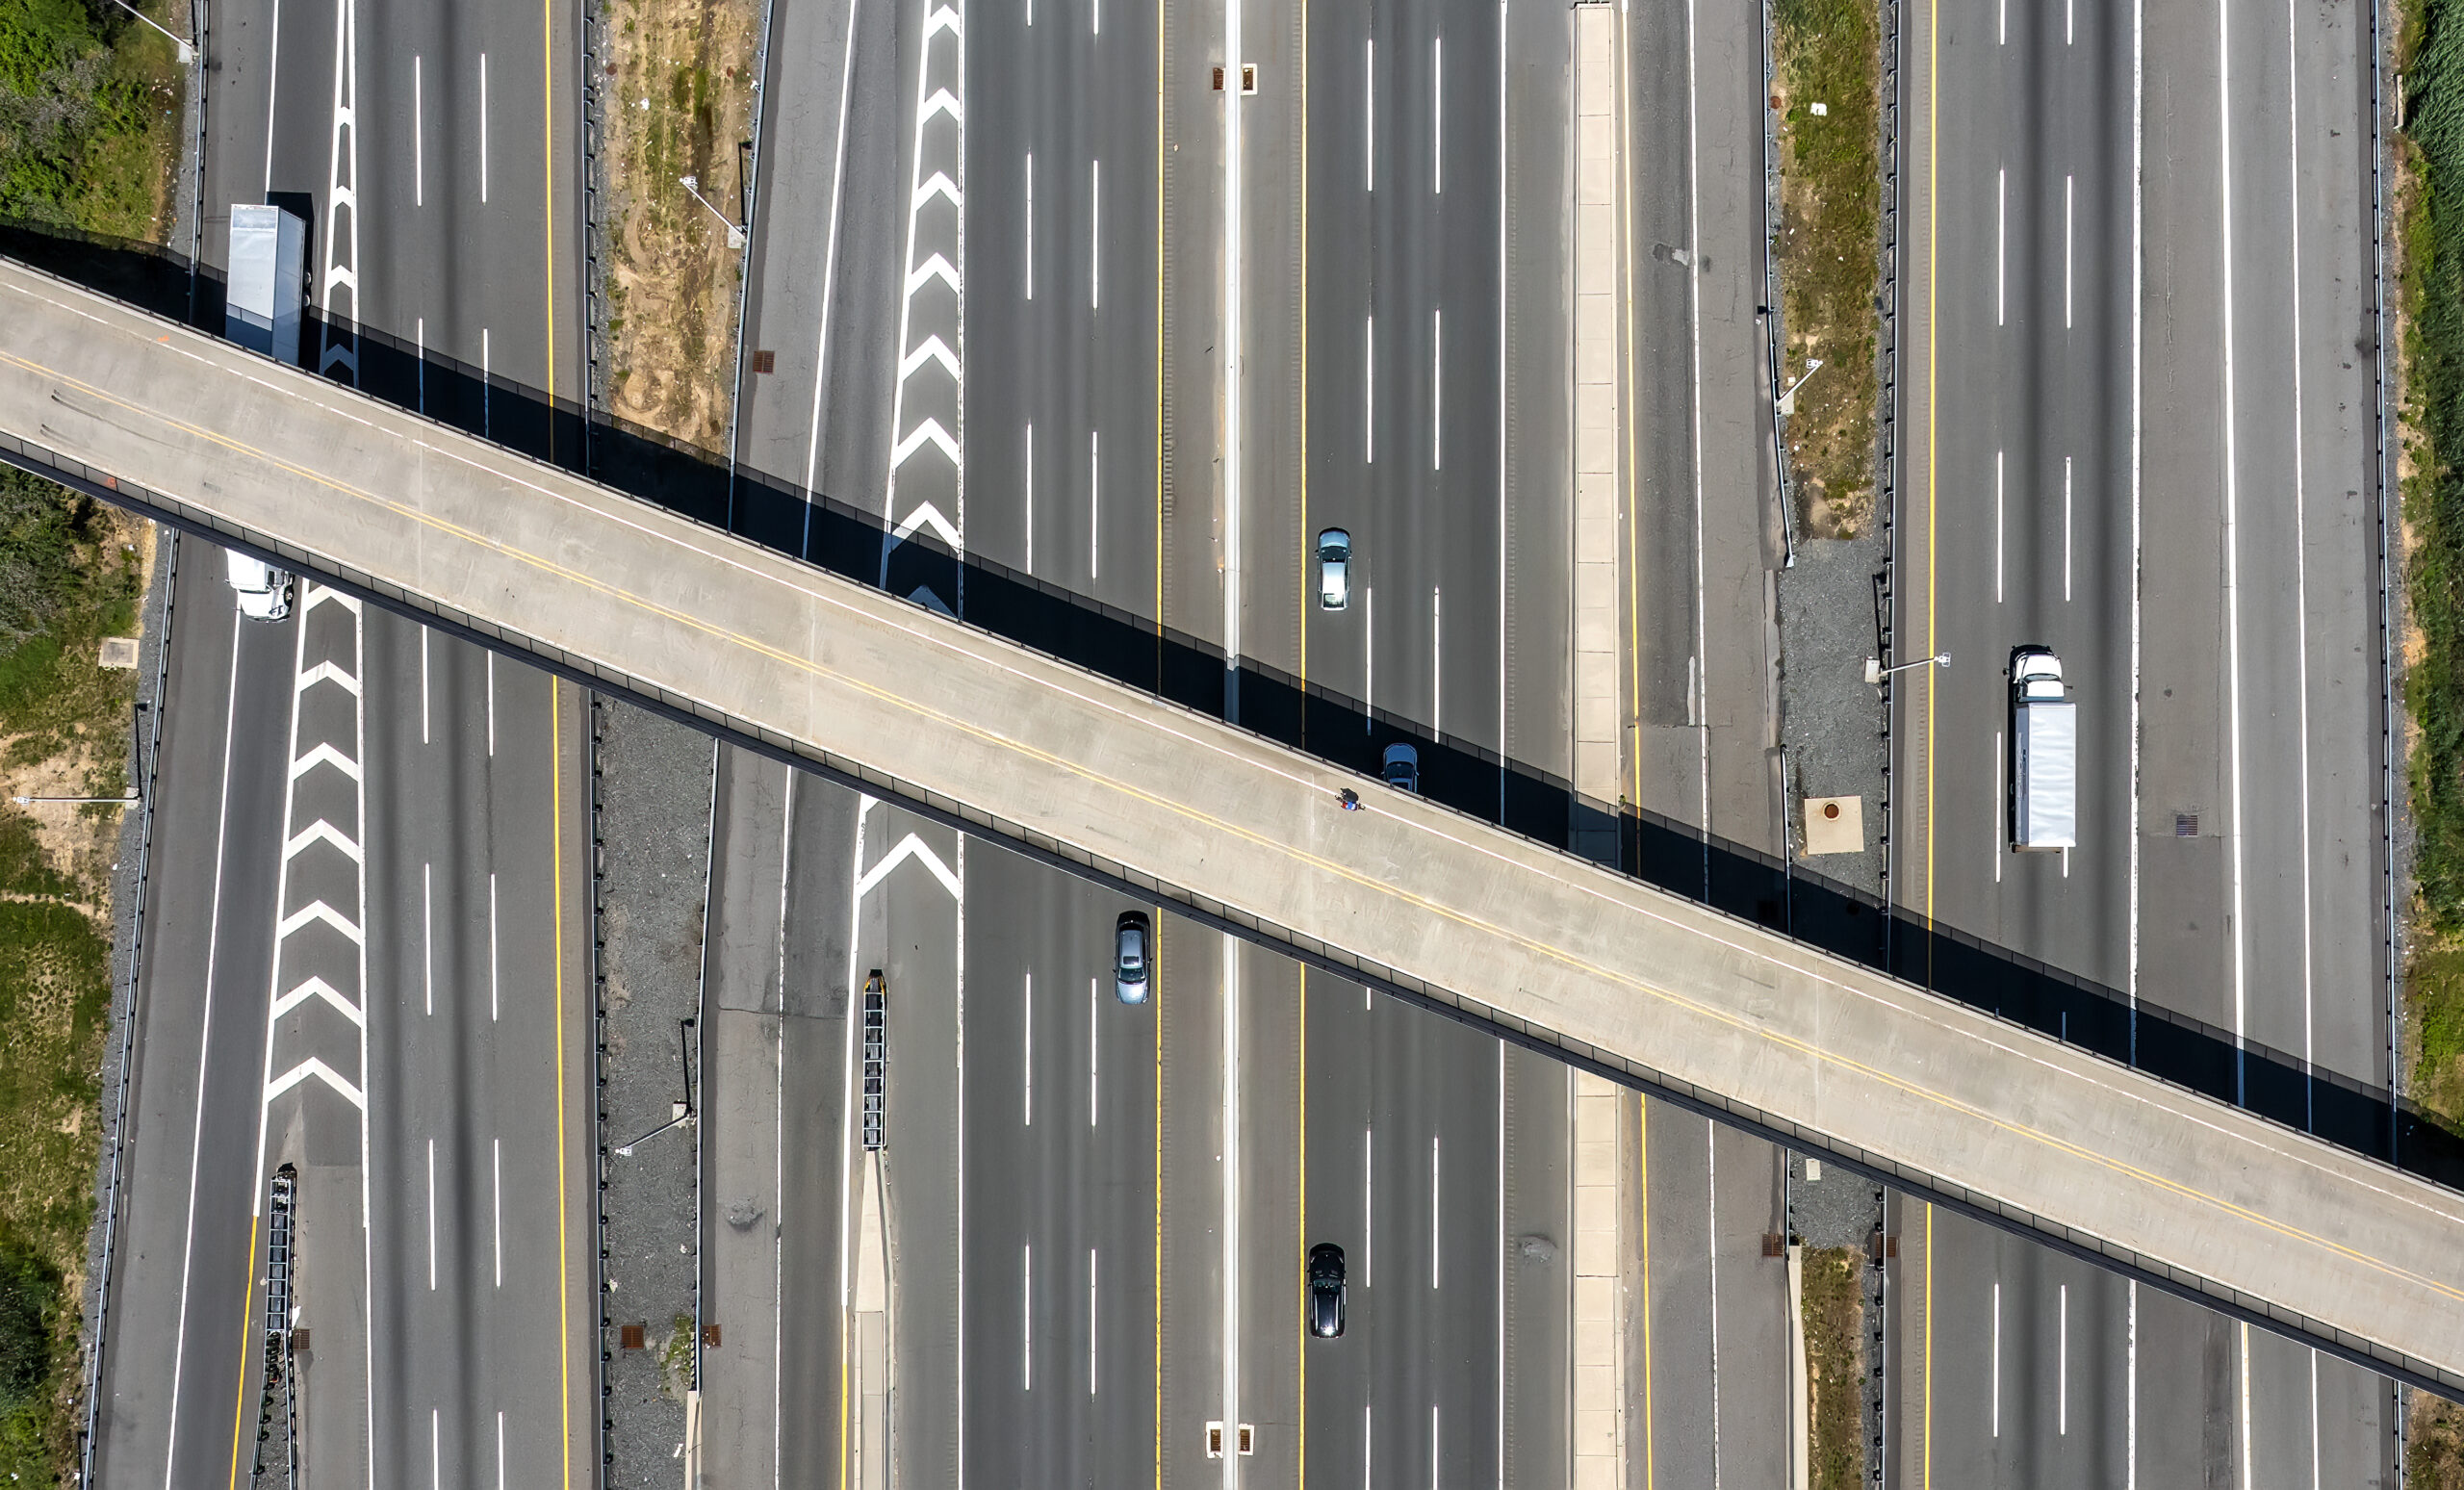
The Promoting Resilient Operations for Transformative, Efficient, and Cost-Saving Transportation Program, or more commonly, PROTECT, is a formula and competitive grant program meant to ensure infrastructure’s resilience in the face of a shifting climate. However, when PROTECT funds are allocated toward projects that expand capacity, those projects meant to stave off the effects of climate change could be contributing to growing transportation emissions. When up to 40% of funding is eligible to go toward new road capacity expansion, this should come as no surprise.
The Hampton Roads Bridge Tunnel Expansion project, the largest highway construction project in the state of Virginia’s history, has received over $23.7 million in PROTECT formula grant funding. In Florida, $2.3 million in PROTECT grant funds are being directed toward a project that doubles the number of lanes and reconstructs interchanges to expand capacity connecting to I-95. Only 26% of FY22-24 PROTECT formula program apportionments have been obligated so far, meaning the program’s distribution of project types may change. However, these trends are not encouraging.
CMAQ
The Congestion Mitigation and Air Quality Program (CMAQ) has been a part of the federal transportation program since 1991, with the express purpose of reducing traffic congestion and improving air quality, particularly in areas where air quality does not meet national standards. Similar to the CRP, there is a wide array of eligible projects to reduce emissions, including transit improvements, programs that incentivize people to drive less, and bicycle and pedestrian infrastructure. CMAQ even saw new eligibilities introduced to the program, including funding for bikeshares and installation of medium- and heavy- duty electric vehicle chargers.
However, CMAQ also funds projects aimed at reducing vehicular congestion through traffic flow improvements. That means that funds that could be spent on expanding sidewalks and bus service are used to widen roads and add new free-flowing lanes to feed interstates, with the logic that reduced idling reduces emissions.
While it is true that reducing congestion and time spent with an idle engine may reduce emissions on a trip-by-trip basis, If people end up taking more trips overall, this benefit is negated. That’s why it’s essential to understand that the built environment shapes how people choose to get around. The models often used by highway planners do not fully factor the long term effects of making driving the only comfortable or time-efficient option, making walking or transit impractical even for nearby destinations.
Air quality improving, emissions reducing projects are slow to have funding designated to them. Like the CRP and PROTECT, CMAQ has had only a relatively small portion of its total funds spent down so far, just 28% of FY22-24 apportionments as of June 4, 2024, which means that the program may change greatly as time goes on and more projects are completed and reimbursed.
Highway Safety Improvement Program
The federal Highway Safety Improvement Program (HSIP) has existed, in some form, since 1966. However, despite decades of investment, road fatalities, especially for those walking and biking, remain high and in excess of our peers.
Our analysis finds that many projects funded by HSIP include elements (such as new turn lanes, auxiliary lanes, shoulder, intersection, and lane widening) that result in increased road capacity. Because general transportation practice values speed over safety, HSIP frequently delivers projects that add more space for cars to flow freely, unimpeded, rather than create a safe environment for all road users. While a new turn lane in an intersection widening project might reduce the amount of rear end collisions and improve traffic flow, pedestrian crossing lengths increase and those crossing are left more exposed to traffic when they cross the street. Further, widened lanes provide more ample opportunities for drivers to speed. As being outside a vehicle becomes less practical and perceptibly dangerous, people drive more, perpetuating dangerous conditions.
Car-centered HSIP projects may reduce injuries for drivers but they can only do so up to a point. Ending fatalities and serious injuries for all road users requires rethinking the role of vehicular speed in design and how people get around. Making inherently safer modes, like walking and biking, more practical and convenient is one of the most impactful safety investments a jurisdiction can make.
Projecting highway formula spending through the end of the IIJA

This analysis evaluates obligations made between FY 2022 to FY 2024, representing approximately 42% of FHWA formula funds apportioned between FY 2022 to FY 2026. What might happen with the rest of the approximately $270 billion in formula funds given to states under the IIJA? While we do not have all the information required to make a conclusive estimate (given that states could change spending patterns and priorities), we can use current spending trends to estimate an upper level estimate.
Assuming highway to transit program funding transfer rates are consistent with pre-IIJA levels, state DOTs could spend up to $89.8 in IIJA formula funds on highway and road expansion projects. Up to $89.8 billion if states transfer funds to transit only at pre-IIJA rates. We made an additional assumption that 30% of Carbon Reduction Program funds would be flexed directly to transit, which is based on state Carbon Reduction Strategy plans and previous CMAQ spending.
Importantly, due to a lack of data, this estimate does not account for transfers between FHWA formula programs. Therefore, this estimate assumes that 100% of a program’s apportionment will be spent as it has so far, ignoring transfers between FHWA programs. For example, transfers from more emissions intensive programs to less emissions intensive programs, such as NHPP to STBG, are not evaluated as FHWA formula fund transfer data is not readily available.
This should be considered a bounding high estimate, as previous research finds the majority of transferred funds go to the Surface Transportation Block Grant, which tends to award slightly less carbon intensive projects. However, under previous transportation reauthorizations, states have transferred over 90% of the funds they could out of the emissions reducing Transportation Alternatives program. Under the IIJA, states have transferred Carbon Reduction Program funds to highway programs, signaling that investment in emissions reducing options may already be a low priority for many states. Publishing state by state data on highway program transfers would allow for more accurate estimates of IIJA emissions and help account for programmatic funding shifts’ climate impact and allow for advocates to keep states accountable.
Converting these assumptions on future spending to emissions, we find IIJA formula funded projects could add an additional 185.1 million metric tonnes of climate pollution to the atmosphere, cumulatively from 2022 through 2040, compared to baseline levels. This is equivalent to running 494 methane gas-fired power plants for a full year, or 47.6 coal-fired power plants running for a year. It is also the equivalent of undoing the annual carbon reduction impact of 48,718 wind turbines.
When including emissions reducing projects, we project net emissions over 122 million metric tonnes of CO2e could be added over baseline levels between 2022 and 2040 due to states’ spending of federal IIJA formula funds in this upper bound scenario.


