
Why we need to prioritize safety over speed

Principle #1: Safety over speed. Any serious effort to reduce deaths on our streets and roads requires slower speeds. Federal funding should require approaches and street designs that put safety first. Cartoon of the grim reaper tipping the scales towards pedestrian deaths while holding a speed limit: 55 sign.

Our roads have never been deadlier for people walking, biking, and rolling and the federal government and state DOTs are not doing enough. If we want to fix this, we have to acknowledge the fact that our roads are dangerous and finally make safety a real priority for road design, not just a sound bite.

Principle #1: Safety over speed. Any serious effort to reduce deaths on our streets and roads requires slower speeds. Federal funding should require approaches and street designs that put safety first. Cartoon of the grim reaper tipping the scales towards pedestrian deaths while holding a speed limit: 55 sign.

Transportation in this country is fundamentally broken, creating a dangerous environment for everyone who uses it but especially for those outside of vehicles. The way we’ve built our roadways has transformed what should be easy trips into potentially deadly journeys. Though our cars have more safety features than ever—cameras, lane keep assist, automatic braking—those advancements have only served to protect people within vehicles. They didn’t save any of the 7,522 people killed while walking in 2022. In fact, as cars become safer for people inside the vehicle, they have gotten even larger and more deadly for people outside of them.

The fact of the matter is that fast-moving vehicles present a danger to people walking. We can’t address this danger if we are unwilling to commit to safer speeds.

We can’t do it all

The policies and practices that inform the design of our roadways often serve one primary goal: to move as many cars as possible, as quickly as possible. That negates the experience of everyone walking, biking, and rolling. Yet, if you asked the same people designing our roadways and dictating these policies whether safety is their top priority, they would absolutely say yes. Our approach to road design, reinforced by federal guidance and manuals, continually tries to juggle both speed and safety, when these two goals are fundamentally opposed.

When we try to prioritize both safety and speed, drivers end up receiving competing messages. Current roadway design requires people to drive perfectly while creating an environment that incentivizes risky behavior such as speeding. Safe roadways don’t ask people to slow down. They are designed so that safe speeds are the most intuitive option.

Less talk, more action

USDOT and other agencies have called for safer streets, but federal funding and policies haven’t led to results. This can be attributed to a variety of factors, including the relatively small amount of money set aside to specifically address safety compared to the much larger amount of money going to build even more dangerous roads.

State departments of transportation are allowed to set safety goals where more people die every year, knowing they will get more funding regardless. Meaningless “safety” targets allow governments to point their fingers and say they’re working on it while building even more deadly roads. The danger is often not addressed until multiple people get hurt. It’s no surprise that the majority of pedestrian deaths occur on federally funded, high-speed state roads.

There are not enough policies to support environments where safe mobility is available for all modes. The Surgeon General called to promote walking and walkable communities and to create a built environment that allows for human connection. The USDOT’s supposed top priority is safety and the Federal Highway Administration has a long-term goal of zero roadway deaths. But there’s no follow through on these statements. We want people to go on walks, and kids to play outside, and for there to be less deaths on the road, but our policies and tax dollars continue to primarily support projects that overlook non-vehicular traffic—at the expense of everyone else. Our transportation system is built on a series of hypocrisies.

If we want a system that moves people without killing them, we need to start putting our money where our mouths are. We need policies that put safety first, placing everyone’s well-being at the center of our roadway design.

It’s Safety Over Speed Week

Click below to access more content related to our first principle for infrastructure investment, Design for safety over speed. Find all three of our principles here.

  • Three ways quick builds can speed up safety

    It will take years to unwind decades of dangerous street designs that have helped contribute to a 40-year high in pedestrian deaths, but quick-build demonstration projects can make a concrete difference overnight. Every state, county, and city that wants to prioritize safety first should be deploying them.

  • Why do most pedestrian deaths happen on state-owned roads?

    Ask anyone at a state DOT, and they’ll tell you that safety is their top priority. Despite these good intentions, our streets keep getting more deadly. To reverse a decades-long trend of steadily increasing pedestrian deaths, state DOTs and federal leaders will need to fundamentally shift their approach away from speed.

  • Why we need to prioritize safety over speed

    Our roads have never been deadlier for people walking, biking, and rolling and the federal government and state DOTs are not doing enough. If we want to fix this, we have to acknowledge the fact that our roads are dangerous and finally make safety a real priority for road design, not just a sound bite.

The loss of transportation choices in the U.S.

A person wearing a hood and heavy coat faces a busy street filled with cars and stoplights with no way to cross

Investments and policies that support car travel at the expense of all other transportation options have helped create a culture of driving in the U.S. Investing in a variety of transportation choices, like opportunities to bike, walk, and take public transit, would improve safety and accessibility for all.

A person wearing a hood and heavy coat faces a busy street filled with cars and stoplights with no way to cross
(Viktor Nikolaienko, Unsplash)

The ghost of walkable streets’ past

Before the car started to take off in the early 1930s, streets were for everyone. Wagons, walkers, bikers, horses, they all utilized the street to get to daily activities and destinations. Pre-Industrial Revolution Americans would walk between 10,000 and 18,000 steps per day, and high rates of walking and biking to work or school continued throughout the late 60s. Because the street was so widely used by many different forms of transport, it functioned as a public space, a place where children could play as much as cyclists could bike to the store.

Three cyclists travel down a wide path in this black-and-white photo
NYC Parks Photo Archive

When cars began rising in popularity in the 1920s, they entered a space not designed for them, posing a danger to other travelers. The public grew alarmed at rising death tolls and vehicle crashes, calling for reduced vehicle speeds and more protections from the car. Automakers, dealers, and enthusiasts flipped their narrative, advocating for legislation and funding campaigns that sought to regulate and restrict where people could walk and bike.

The latter campaign succeeded, but it didn’t make our streets safer. Instead, streets ultimately became a place where quick, convenient car travel is often prioritized over the safety and comfort of all other road users. In 2022, the number of people hit and killed while walking reached a 40-year high.

The illusion of choice

Post-WWII in the United States was a time of world-building, of focusing on creating a brighter future for the country in the aftermath of destruction. The infrastructure that came along with this shift made suburban lifestyles the ideal, and the car a symbol of freedom. A combination of economic incentives and a deprioritization of dense, mixed-use development led to sprawling cities with destinations spread far apart, connected by high-speed roadways.

Today, Americans are driving more for the same basic tasks. Research from Transportation for America and Third Way found that households in both rural and urban areas are driving significantly farther per trip as of 2017 than they were in 2001 to accomplish their commutes and daily tasks. Often, driving is the only convenient, safe, and reliable transportation option available, requiring households to shoulder the cost of a vehicle in order to access their daily needs. When people can’t afford regular access to a vehicle, when their car breaks down, or when they otherwise don’t have the ability to drive, they must navigate a transportation system that wasn’t built for them.

A lack of safe transportation options leads to reduced access to economic opportunity, increased risk of being hit by a vehicle, and higher rates of air pollution. These trends are felt by everyone, but they have the harshest impact on low-income communities and communities of color.

We need Complete Streets

Decisions made in the past have left our streets incomplete, prioritizing one way of travel over a wealth of other options. Complete Streets are streets that are safe for all users and that connect community members to the resources they need. This blog is the first installation of a four-part series on the Complete Streets movement. Keep an eye out for our next blog, where we’ll dissect the origins of the Complete Streets movement and what it aims to achieve.

Dangerous by Design 2024: Deaths of people walking up 75% since 2010

The 2024 edition of Dangerous by Design is out now, combining federal data with lived experience to unpack the connection between roadway design and the ever-increasing record deaths of people walking. The report ranks the most dangerous metros in the United States based on pedestrian fatalities from 2018 to 2022. Click here to access the report’s analysis of the deadliest metro areas and national trends > >

The number of people struck and killed on our roadways continues to rise—reaching 7,522 in the latest available federal reporting, a 75 percent increase since 2010. That’s an average of more than 20 per day. We found that almost every metro in the U.S. was deadlier for people walking in 2022 than in 2021.

Smart Growth America’s rankings of 101 metro areas show that nearly every metro has gotten more dangerous—and those that didn’t get worse have remained about the same.

This year, Memphis was ranked the deadliest city for pedestrians. 344 people died from 2018-2022, an increase of 158 deaths compared to the previous five-year period.

As in previous editions of the report, Smart Growth America found that Black and Indigenous Americans, older adults, and people walking in low-income communities still face the greatest risk.

Read the first installment of the report here to learn more about this year’s metro rankings and how pedestrian deaths impact people from different metro areas, races and ethnicities, income levels, and ages. And stay tuned for upcoming Dangerous by Design releases this summer, sharing analysis for states and congressional districts.

“Short-term action, long-term change”: How quick builds are bringing innovation to safe streets implementation

Two children wheel materials down a closed street as multiple generations work together to install small barriers to protect road users.

Quick-build projects prioritize affordable, rapid, and temporary solutions to inaccessible and unsafe streetscape conditions. Through this approach to project implementation, communities are able to set an example that establishes the need and precedent for continued change in their urban environment.

Two children wheel materials down a closed street as multiple generations work together to install small barriers to protect road users.
Short-term, low-cost projects can deliver valuable insights and bring the community together. (City of Fayetteville, AR)

What are quick builds?

Smart Growth America has a variety of resources on how quick builds develop and what they can achieve. Access them here.

In recent years, the practice of installing rapid, low-cost, and temporary improvements to public space has gained popularity. These initiatives, often called “tactical urbanism” or “quick builds” emphasize action, prioritizing short-term projects designed to improve street safety, public spaces, and enjoyability of the streetscape for all users.

There are many groups around the country utilizing quick builds in their communities, and all share a common goal of using low-cost materials to experiment with and gather input on potential design changes. While quick builds can create impressive changes to spaces, their real power lies in illustrating what works, what doesn’t, and what our urban spaces should look like.

Quick-build projects may look and work very differently depending upon the community’s needs; however, the approach remains similar. These initiatives work in the gray area, opting to avoid bureaucratic processes or expensive materials which delay changes to public spaces. They’re especially useful when a community needs to inspire action because it draws attention to perceived shortcomings, widens public engagement, deepens understanding, gathers data, encourages people to work together, and tests solutions.

Smart Growth America has been integrating quick builds into their Complete Streets initiatives through technical assistance projects across the country, testing new street designs and innovating best practices. In November 2022, Smart Growth America launched their most recent Complete Streets Leadership Academy (CSLA), a series of virtual sessions and in-person workshops designed to support community-led quick-build projects on state-owned roads. One of the goals of these projects was to strengthen relationships between state DOTs and local jurisdictions to help pave the way for further change.

Mike Lydon and Anthony Garcia’s book, Tactical Urbanism: Short-term Action for Long-term Change, illustrates examples of how the approach can be utilized and includes a toolkit to guide project planning and implementation. According to the guide, any initiative utilizing Tactical Urbanism should consist of three main principles: safety enhancement, ability to adapt across project implementation, and constant innovation.

side-by-side photos of Times Square before and after the pedestrian plaza was installed. On the left, cars travel down a busy throughway near a wide sidewalk. On the right, the entire space is filled with people sitting under red umbrellas or walking to nearby businesses.
Before and after image of pedestrian infrastructure added in NYC. (Flickr, New York City Department of Transportation)

Small actions lead to big changes across the nation

Projects like quick builds have been utilized to make significant changes to urban spaces since the early 2000s. Former New York City Department of Transportation Commissioner, Janette Sadik-Khan, has stated that a rapid quick-build-style approach was key to her work in New York City from 2007-2013. Sadik-Khan’s initiatives during the time included the implementation of 400 bike lanes, the launch of CitiBike, the building of 60 pedestrian plazas, and, most notably, the closure of car access on Broadway through Times Square.

The projects utilized quick-build approaches such as rapid implementation and the use of impermanent materials, and with support from leadership and funding to back them up, the eventual development of these initiatives into permanent structures points to quick build projects’ ability to push design changes across the finish line. The precedent set by Sadik-Khan has changed the way the country thinks about transportation, an impact we can see across the nation as multi-modal transportation initiatives expand.

With innovation and adaptation as key principles in these temporary and low-cost projects, it’s no surprise that the advocacy strategies for the approach have evolved over time. One example of this is the work of Vignesh Swaminathan, known on TikTok as Mr. Barricade. Not only have his short social media videos inspired and educated people around the world, but his work as a consultant put more quick builds into practice.

In 2019, Swaminathan worked with the City of San Jose, California to lay ten-miles of temporary protected bike lanes. Swaminathan helped the city save on the installation by coordinating lane installations with planned repavings and the use of plastic vertical bollards and bus stop islands. The city eventually plans to replace the plastic barriers with concrete islands, making the lanes permanent.

Colorful paint along a curb leads to a concrete curb extension in this before and after photo.
At the corner of Church and Center, a temporary project turns led to permanent intersection improvements. (City of Fayetteville, AR)

Shaping progress with community engagement

Some government leaders are using temporary, low-cost projects to put power into people’s hands. In Fayetteville, Arkansas, the city government has created an online application for citizens to gain approval for projects which will ultimately influence the city’s planning and development. The city has also developed a guide to community-led tactical urbanism which helps residents plan and implement projects. If government entities want to have an impactful role in urban infrastructure evolution, they can’t act alone—these processes require mutual trust, community buy-in, and participatory community feedback.

When government officials, practitioners, and community members come together to reap the benefits of quick builds, the practice can bring multimodal streetscapes to life. This provides an opportunity to test the effectiveness and popularity of design changes. Quick builds offer a mechanism to make small short-term safety improvements again and again, teaching us how to make our streets safer in the long term, too.

Press statement: Newly updated MUTCD doesn’t go far enough to protect pedestrians

press release

Washington, D.C. (Dec. 20) — Yesterday, the Federal Highway Administration (FHWA) released the 11th Edition of the Manual on Uniform Traffic Control Devices (MUTCD), a document “that governs how traffic control devices communicate the design intent to the road user to safely and efficiently navigate the roadway system.” Smart Growth America and Transportation for America are glad to see FHWA include more considerations for people outside of a personal automobile and provide additional flexibility for practitioners. However, in the face of historic rates of roadway fatalities, especially pedestrian fatalities, incremental improvements are a lackluster response.

Beth Osborne, Vice President of Transportation and Thriving Communities at Smart Growth America, released the following statement:

“This update to the MUTCD did respond to some of our requests, particularly allowing transportation agencies to paint red bus-only lanes and green bike lanes. There are also long-awaited updates that could have positive impacts, such as new considerations before setting the speed limit at the 85th percentile speed and making it a little easier to justify new crosswalks.

“However, this falls short of the kind of major paradigm shift required to protect vulnerable users at a time when the United States leads the developed world in roadway fatalities. For example, while transportation agencies must consider context and the users of a road before setting speed limits at the 85th percentile speed, they may still do so even if that causes dangerous conditions. The document also indicates great concern about color and designs in crosswalks that would better draw a driver’s attention to those areas, including a misguided fear that pedestrians might actually stand in traffic to look at those colors and designs.

“Some of FHWA’s trepidation around innovation may come from a misunderstanding of how agencies use manuals like this. In our direct technical assistance programs, the MUTCD is cited as a barrier to many common-sense safety interventions in almost every state DOT. New flexibility often goes underutilized for lack of clear and strict guidance. That is because engineers understand the status quo while the flexible option requires an engineer to create something new, something most overworked agency engineers do not have time to do. Even when they do, their general council usually cautions against trying new things because flexibility does not come with the same legal coverage as a standard.

“To achieve safer streets, we stand behind FHWA’s goal to make the MUTCD a living document and look forward to continued partnership to align their intentions with results. To that end, we call upon the FHWA to improve data collection and implement a feedback loop that allows amendments to the current MUTCD as soon as 2024 to prevent more avoidable deaths. We commit to working with FHWA to modernize the MUTCD and with Complete Streets champions in their efforts to make streets safe for everyone.”


Sizing up deadly vehicles

To check the ever-increasing danger on our nation’s roadways, Transportation for America joined a coalition of advocates to call for stronger federal assessments of large vehicles. Read our comment letter.

More than 6,500 people walking were struck and killed in 2020, and the Governors Highway Safety Association projects that even more were killed in 2021, a sign that our streets continue to be dangerous for people traveling outside of a vehicle. As we wrote in Dangerous by Design, deadly street design, which prioritizes vehicle speed over pedestrian safety, is a key factor to these deaths, and people of color, particularly Black and Native Americans, face the worst consequences of dangerous design.

In a contributing essay, America Walks explained how vehicle size also plays a role in the likelihood that a pedestrian will die when struck by a vehicle. Ever-larger vehicles, and increasingly aggressive drivers, have an impact on the safety on our nation’s roadways. However, federal safety ratings have long ignored how vehicle designs impact the safety of people outside of the vehicle. That will soon change.

The National Highway Traffic Safety Administration (NHTSA) has proposed an update to the New Car Assessment Program (NCAP) that would aim to acknowledge the danger the vehicle could pose to pedestrians and other road users outside of the car. The current five-star safety rankings, which evaluate the safety of only the people inside the vehicle, will remain in effect. However, NHTSA proposed adding a “pass” or “fail” symbol to represent danger for people outside of a vehicle.

We joined a coalition of advocates, led by the National Association of City Transportation Officials (NACTO), to submit comments on this proposed update, which highlighted the following suggestions to strengthen NHTSA’s update:

  • Any vehicle that receives a failing grade for pedestrian crashworthiness should be ineligible for a 5-star rating. 
  • Adopt a 5-star scoring system for pedestrian crashworthiness, rather than a pass/fail system.
  • Consider evaluating pedestrian crashworthiness at speeds higher than 25 mph in addition to at or below 25 mph.
  • Incorporate information about other vehicle safety features that are proven to protect people outside of vehicles into the rating system, and ensure no vehicle receives a 5-star rating if it doesn’t include those features. 

This update is a start, but with an ever-increasing number of traffic fatalities each year, the current proposal fails to properly communicate the danger large vehicles pose to people walking and rolling. We’ll continue to call for safer streets for all travelers, whether they’re in or out of a car.

Read our comment letter

Rising fatalities a sign to modernize federal design framework

A young woman holds onto her bicycle, waiting for the ped signal to cross a crosswalk showing signs of wear.

Despite a binding requirement to release an updated version more than a month ago, the Federal Highway Administration missed the deadline to release a new edition of a federal handbook with national influence on street design. There were many positive changes proposed for this edition, but unless this delay comes because further improvements are underway, this new edition might ultimately be another green light for increasing traffic fatalities.

Edit 6/30: Language in an earlier version of this post overstated the power of the MUTCD in shaping street design. While this manual is influential, other important resources inform street design, including the Green Book. This language has been changed.

A young woman holds onto her bicycle, waiting for the ped signal to cross a crosswalk showing signs of wear.
A cyclist waits to cross as cars zip past. Source: Flickr

As Smart Growth America wrote in their 2022 report Dangerous by Design, the number of people struck and killed while walking reached yet another new high in 2020. More than 6,500 people were struck and killed while walking in 2020, an average of nearly 18 per day, and a 4.5 percent increase over 2019. This epidemic continues growing worse because our nation’s streets are designed primarily to move cars quickly at the expense of keeping everyone safe, but change can be made on every level to reorient toward protecting the most vulnerable rather than prioritizing the speed of a few.

There’s one Dangerous by Design recommendation that the federal government can take action on right away: an update to the little-known but highly influential Manual on Uniform Traffic Control Devices (MUTCD), defines standards for traffic control devices, which includes pedestrian crossings and lane markings like green bike lanes and red bus-only lanes. Though the current MUTCD prioritizes vehicle speed over pedestrian safety, the 11th edition MUTCD is an opportunity for the FHWA to make changes that benefit all road users—if they incorporate advocate feedback. Some proposed changes with potential include an update to the notorious 85th percentile speed standard, a decision on colorful crosswalks, and improvements for pedestrian crossing times. However, although these proposed changes might look good on paper, the revised MUTCD will likely leave most existing road networks as dangerous as ever.

85th percentile standard

While there’s no shortage of examples of the MUTCD placing the high-speed movement of cars at the top of the transportation hierarchy, there’s perhaps no greater example than that of the 85th-percentile speed standard. This standard sets what the National Transportation Safety Board calls a dangerous precedent for determining speeds: out of 100 drivers, the 15th fastest driver sets the speed limit. 

The intent behind this is to lower the difference in speed between the fastest drivers and the slowest, with the idea being that the cause of crashes is the difference in speed, not speed itself. But this flawed logic ignores that as speed increases, the probability of fatalities for vulnerable road users increases exponentially.  Blanket application of the 85th-percentile speed to arterials across the country has helped create the current crisis of pedestrian injuries and deaths—the majority of which now occur on state DOT-owned roads.

In the proposed edits for the new MUTCD, the 85th-percentile standard would be redesignated to a “guidance.” While that sounds better, this does not address the fact that unsafe roads in compliance with the new guidance would still be dangerous by design. Without providing engineers with safe design standards (like standards for road diets, raised crosswalks, chicanes, and narrower lanes), it would be impossible for this minor change to undo the speed status quo. The existence of the 85th-percentile rule is proof we know people will drive as fast as they feel comfortable. By softening the standard to a guidance, the MUTCD still fails to address design. State DOTs would still be responsible for choosing where to implement the rule on their roads, and without a change in standard practice or culture, it’s unclear what effect this change could actually have.

Pedestrian crossings

There are plenty of other standards in the MUTCD that foster dangerous design. Pedestrian volume per hour during “peak hours” is a main determining metric of what warrants a pedestrian signal at an intersection or midblock crossing. But peak hours focus on peak times for vehicular traffic, and what might be peak hours for a driver can be the worst, most uncomfortable time for a person to attempt to cross a busy roadway. Worse still, the National Highway Traffic Safety Administration’s FARS data has consistently shown that the deadliest hours for pedestrians are often well outside of what’s considered “peak.”

FHWA graph shows higher rates of pedestrian deaths after 6 p.m.
A graph from the FHWA describing pedestrian fatalities by hour from 2006-2020. Credit: FHWA

This leads to a deadly feedback loop that works against the most vulnerable—if the road feels unsafe or inconvenient to cross, no one will attempt to use it except for those with the fewest options. Hostile design makes it nearly impossible to safely walk the span of a roadway to reach services when you have to contend with multiple lanes of high-speed traffic. 

Just as people are more likely to drive on a wide, comfortable roadway, they’re more likely to walk on a sidewalk that feels safe. However, some MUTCD-compliant designs are so dangerous that cities feel the need to give their pedestrians bright red flags just for them to cross the road—an ineffective solution to a design problem.

Like with the 85th percentile standard, the 11th edition shifts pedestrian volume per hour warrants from a standard to a guidance, and tinkers with  other technicalities. Some changes are good, and could even result in longer, safer crossing times or more flashing pedestrian crossing beacons. But even if the proposed changes are adopted, they lack teeth. DOTs would be left to their own devices to enact the changes, and they could still point to the guidance as reason to not install a crossing.

MUTCD compliant crossing in Knoxville, Tennessee. Would you feel safe crossing here? Source: Google Maps

Colored crosswalks

Research has shown that bright, colorful crosswalks and intersections make streets safer by drawing drivers’ eyes to the pedestrian crossing with the added benefit of creating more vibrant streets. However, since 2001, the FHWA has officially discouraged communities from using art at crosswalks and has consistently sent letters to cities ordering them to remove their art, or lose federal funding. FHWA justified their requests by claiming colorful crosswalks do not enhance safety, despite the fact that the agency has yet to conclude research on the topic. There is no apparent plan for public access to the research underlying the next edition’s ruling.

A roller skater and bicyclist cross a rainbow-colored crosswalk
Colored crosswalks, like the rainbow crosswalk above, can be an attractive way to signal for drivers to stop and look for pedestrians. The right design can also signify community and belonging. Photo source: Long Beach Public Works

If text in other sections of the proposed changes is any indication, the FHWA has an interest in maintaining total uniformity in crosswalks for the benefit of automated vehicles. Automated vehicles (AVs) see the world through artificial intelligence-based machine vision and have difficulty adapting to the dynamic scenarios common to urban environments, even if these are the same scenarios that are more likely to draw the attention of human drivers. 

AVs benefit from road environments with minimal variety and maximum contrast, and the 11th edition will likely propose prescriptive changes that would require road markings to be wider, brighter, and more frequent, explicitly for AVs. It is unclear why the FHWA seems willing to offer new concessions for vehicles that have so far failed to provide a proven safety benefit, but remain unwilling to allow changes that are proving to make vulnerable road users safer.

The bottom line

With speed and throughput of cars as the leading success metric, the so-called best practices outlined in previous editions of the MUTCD have increased the viability of cars at the expense of all other road users, including public transit, pedestrians, and cyclists. We are glad to see changes that allow for safer street design, but in the face of rising pedestrian fatalities, the 11th edition of the MUTCD doesn’t go far enough.

FHWA has made some progress on prioritizing safety over speed in other recent guidance. However, when it comes to the definitive guide to traffic control, making minor revisions in the midst of a crisis of fatalities that seem to increase year after year is a failure to meet the moment. We hope the extra time spent on the new edition has gone toward creating a safer MUTCD.

Eliminating driver error doesn’t work. What does? Part III: The Seven E’s

Cities across the world are arriving at the same conclusion: the only acceptable number of pedestrian crash-related deaths is zero. How can state departments of transportation be part of the solution? In this third part of our blog series, we explore the seven E’s state DOTs should consider when making pedestrian safety infrastructure improvements.

When you are driving down a road that looks like the one above from Memphis, TN, what are you most likely to do? Increase your speed or drive slowly? T4America photo by Forever Ready Production

Changing roadway safety in design will take a change of culture in how Americans view pedestrians from behind the wheel. An essential part of this change in culture will come from how practitioners design our nation’s roadways. Who are we truly designing our roads for? For vehicles or for people?

This post is part III of a blog series, Eliminating driver error doesn’t work. What does? See parts I and II.

The Seven E’s

A comprehensive strategy is necessary to change our approach to road design. To guide state DOT safety efforts, some transportation professionals have suggested seven guidelines, or seven E’s. In part I of this blog series, our post covered the downfalls and areas of improvement for two of those E’s—education and enforcement. While education and enforcement have their place in roadway safety, they cannot be the top priority in a DOT’s approach. The remaining five E’s, evaluation, engagement, engineering, encouragement, and equity, are vital to our roadway’s safety-centric transformation.  

Proper evaluation of America’s roadways is required to create a foundation for change. Currently, there are no national standards for data collection and reporting of pedestrian crash-related deaths that are comprehensive and set tolerable safety goals. Without proper data collection standards, state DOTs are not able to fully comprehend the severity of the issue, or have insight into where the most dangerous roads are located. 

Community engagement has the potential to create inclusive, equitable grassroots movements that are fundamental in igniting the reform of state DOTs to create safer roads for all users, including pedestrians. When state DOTs engage with the local communities identified in their evaluation efforts, a more inclusive design process can evolve to meet the needs of those specific communities, in addition to their safety.

An example of effective community-generated programming is the 11th Street Bridge Park project. Throughout that project, which will build a pedestrian bridge over the Anacostia River, community engagement has been the central focus of the District’s DOT (DDOT). DDOT brought community members in from the very beginning and factored their feedback into the design process. The resulting community-generated programming of the pedestrian bridge includes outdoor performance spaces, playgrounds, urban agriculture, an Environmental Education Center with classrooms to teach students about river systems, public art that tells the rich history of the region, and kayak and canoe launches. 

The engineering of roads and streets directly impacts pedestrian safety and crash-related deaths. While there are myriad factors involved in these pedestrian crash deaths, our streets are designed to move many cars quickly at the expense of the safety of everyone who uses them. Roadway design strongly impacts how people drive, and it’s often more influential on driver behavior than the posted speed limit.

Smart Growth America’s Dangerous by Design report clearly outlines the American epidemic of deaths while walking and its direct relationship to the design of our roads.

Some DOTs, like NYCDOT, have been spurred on by the Vision Zero movement (read more about that movement in this prior blog post) and started implementing design-centered solutions to traffic deaths. NYCDOT’s recent report includes evaluations of specific design interventions and their impact on pedestrian safety. The image on the left recommends design schemes engineered to improve pedestrian safety and reduce crash-related deaths. 

Road designs that are engineered with safety as their priority complemented by transparent data reporting on their related reduced crash deaths are likely to encourage adoption across cities and states. Additionally, federal and state governments could financially incentivize the adoption of such road designs to further encourage safety improvements. 

Last and most definitely not least is the common thread that connects all of these themes together: equity. Everyone, no matter where they live, their income level, or the color of their skin should be safe while walking. When our streets are dangerous, the heaviest burden falls on communities of color. SGA’s Dangerous by Design report found that Black Americans and Indigenous Americans are particularly affected by unsafe roads for pedestrians, indicative of the road safety inequities these populations experience in their communities. To address these equity concerns, DOTs should prioritize change in communities that are most at risk.

What’s next?

State DOTs need to reprioritize how they think about public safety and the purpose of road design. Moving vehicles quickly at the expense of human life is not acceptable. The seven E’s can be repeated and contextualized across state DOTs, creating a framework for evaluating and responding to the endemic of pedestrian deaths. Collecting insights transparently, using the collected data to inform road design and safety improvements, and doing so in a systematic way, while prioritizing equity in all solutions, will help bring needed change.

You can learn more about how state DOTs can help create a transportation system that works better for everyone in Smart Growth America’s report Building a Better State DOT.

Repealing jaywalking laws to refocus on street design

Washington could be the next state to repeal jaywalking laws. While the repeal could address racial and social justice issues, the effort could also lead the conversation toward more just and safe street design.

Photo by Steve Davis from Dangerous by Design 2022

One of the intersections of transportation safety and social justice is how we structure our safety strategy with an emphasis on victim-blaming. American transportation planners and engineers have built roadways that mix high-speed traffic with turning vehicles and people walking and biking, killing thousands of people every year. Meanwhile, collision reports focus on whether the person killed while walking or biking was wearing reflective clothing or a helmet, and police clamp down hard on people “jaywalking” without paying significant attention to street design.

Kansas City and several states (Virginia, Nevada, and California) have taken steps to decriminalize jaywalking, and this year advocates in Washington State are ramping up to follow suit. A coalition of groups called “Free to Walk Washington” has worked with the state legislature to get companion bills introduced in both the house and senate in-effect repealing state and local jaywalking laws across the state.

While safe street design is the primary way to improve transportation safety, jaywalking laws couldn’t hurt, right? Wrong. It turns out that jaywalking laws are problematic in a few ways. Besides being ineffective at improving safety, jaywalking laws are frequently enforced disproportionately on Black and brown people, in some cases leading to well-known stories of violence. In Seattle, more than one quarter of jaywalking citations (2010-2016) went to Black pedestrians who make up only 7 percent of the population. And with government budgets stretched thin, enforcing jaywalking laws is an inefficient use of limited police resources.

In a press release announcing introduction of the senate bill, the bill’s sponsor Senator Rebecca Saldaña said, “While jaywalking laws may appear well-intended, they don’t actually keep pedestrians safe and may instead put them at risk. National data shows that jaywalking laws are disproportionately enforced against Black people and in neighborhoods lacking infrastructure and resources. Our streets and right of ways need to have the safety of all users built into the infrastructure.”

The first three states to decriminalize jaywalking have each taken slightly different approaches. Virginia’s law prohibits police from stopping someone just for jaywalking. Nevada’s law reduced the severity of a jaywalking infraction, making it no longer a misdemeanor. California’s law allows pedestrians to cross the street at places other than an intersection as long as it is safe to do so. Washington’s law as currently proposed would go much further, essentially making walking across the street legal in the vast majority of situations, as long as it is safe to do so, and preempting local jaywalking laws.

The concept of jaywalking was originally advanced by automobile manufacturers in the 1920s to shift the responsibility for safety on city streets from the automobile driver to the pedestrian, thus carving out street space for motorists to drive at higher speeds on city streets. Since then, jaywalking laws have become ubiquitous until the last few years.

Unfortunately, the injustice wrought by jaywalking laws is compounded by the injustice of thousands killed while walking. Smart Growth America’s 2022 Dangerous by Design report found that people of color, and particularly Native and Black Americans, are far more likely to die while walking on America’s dangerous streets.

Planners and engineers need to design streets for people first. That means designs that compel people to drive more slowly since the risk of killing a pedestrian drops significantly as speed drops. Narrow lanes, frequent intersections, and edge features like street trees and bollards tend to cause drivers to go slower. Protected sidewalks, and crosswalks in the places where pedestrians want to cross (at bus stops, for example) create safe space for people walking or rolling.

What final form the Washington law takes and whether it passes remains to be seen. We’ll be watching to see what happens in this state and others. And most importantly, we’ll be watching to see if all of these states can rethink the dangerous high-speed street designs that kill so many.

Assessing safety for the most vulnerable road users

A pedestrian navigates a busy street
Flickr photo by Eric Allix Rogers

Beginning in November of 2023, Vulnerable Road User (VRU) safety assessments will be required as appendices or addendum to Strategic Highway Safety Plan (SHSPs). While the goal of these assessments is to strengthen the Highway Safety Improvement Program (HSIP), recent federal guidance falls short on addressing dangerous road design.

In the United States, pedestrian deaths by vehicles are  at an all-time high, rising more than 50 percent between 2010 and 2020. Change is needed—in road design, in policy, and in policy implementation. Thanks to the highly touted 2021 infrastructure law, there is funding available for improvement, but only if states are willing to budget for safety.

Since 2005, states have been required to set safety measure targets. These targets are intended to help states monitor their progress on road safety, but they face two central issues. First, states can set rising fatality targets—so if fatalities go up, they’ll still be considered “on track.” Second, states don’t face any significant penalty for failing to meet a target. In other words, a state can set a goal to have more traffic fatalities than they had last year, and they face no punishment if traffic fatalities go up even higher than they expected. 

In October 2022, the U.S. Department of Transportation’s (USDOT) Federal Highway Administration (FHWA) released guidance on requirements and recommendations for the Vulnerable Road User (VRU) Safety Assessment. The guidelines are meant to assist states in developing design-focused infrastructure improvements. In comparison to the more general requirement of measuring safety targets, the goal of VRU assessments is to specifically address reducing traffic fatalities and serious injuries on roads that are particularly dangerous for vulnerable road users.

While the guidance is a step in the right direction, limits on data requirements and potential funding streams to implement change will likely hinder the impact of the policy.

Connecting VRU safety assessments to traffic fatalities

The guidance requires states to analyze roadway characteristics in order to identify high-risk areas. Two of the roadway characteristics that must be reported are speed and roadway classification. (Roadway classification relates directly to speed—you’ll never see a freeway where the speed limit is 15 mph, and you’ll never see a residential street where the speed limit is 65.) These are important components of crash data, because the higher a vehicle’s speed, the more likely a crash will end in a fatality.

Watch Smart Growth America’s video on why safety and speed are incompatible goals.

The guidance also requires reporting demographic information—race/ethnicity, income, and age—of the population surrounding the crash area. Fatal crashes disproportionately impact communities of color, the elderly, and low-income individuals, but these impacts are often underreported. If collected effectively, states will be able to more fully consider not only where traffic fatalities occur but who the traffic fatalities impact. An additional category, disability, would further the effort.

In addition to the VRU safety assessment requirements, the FHWA recommends including data such as surrounding land-use patterns, the presence of sidewalks, and the presence of transit stops. These three data references speak to the importance of street design as it relates to pedestrian safety. For example, walking a mile to a bus stop along a busy street without sidewalk access is significantly more dangerous than walking a block on a wide sidewalk.

Projects for high-risk areas

The guidance requires states to propose projects to improve conditions faced by road users in high-risk areas. Complete Streets projects, for example, are proven to reduce safety risks for all street users—pedestrians, cyclists, motorists, and transit riders. Another example of a project aimed at improving road safety for all users is a Road Safety Audit (RSA). The FHWA works with state and local jurisdictions, as well as tribal governments, to conduct RSAs. With guidance and the resources to back it up, jurisdictions do not have to figure out how to meet this requirement on their own.

What’s missing?

Roadway design has a clear impact on safety.  Factors like width, multiple lanes, traffic control at intersections, and the presence of crosswalks all play a part in whether or not drivers speed—and make fatal mistakes. Yet the current guidance does not require states to consider the layout of the road. 

This guidance also fails to provide direction on where to seek funding for safety projects after an assessment is conducted. For example, local public agencies have access to formula funds through the FHWA. States receive 60 percent of their federal highway dollars from the National Highway Performance Program (NHPP). This massive source of funds can and should be used to address designing roads for safety. The Surface Transportation Block Grant (STBG) is another readily available resource, comprising one quarter of the federal money sent to states.

However, these funding sources are often used for projects that make streets more dangerous. Stronger guidance would require states to prioritize funding projects to address the results of safety assessments and provide information on obtaining funding.

Vulnerable road users have the right to expect safety, but by ignoring key design elements, the guidelines fail to provide this. States need to critically assess infrastructure design flaws—and the extent to which they disproportionately impact vulnerable road users—so that funding can be directed towards necessary remedies.

The bottom line

The specific requirements set forth under the new guidance are an overdue upgrade in reporting on vehicle and pedestrian crashes. However, the guidance falls short by failing to require data collection on key safety factors. To address the ongoing crisis of roadway fatalities, states would benefit from more direction, including information on how to access and use their available funds to advance their safety goals.

Eliminating driver error doesn’t work. What does? Part I

That's the temperature not the speed limit sign

Billions of dollars in new federal highway funding are flowing into road safety programs, so we wanted to review the research on which interventions can save lives on America’s roads—and which are failing to do so. All the available data tell us one thing clearly: strategies that fail to accept human error and reduce speeds also fail to reduce road casualties.

Much of the research in this post comes from a capstone project on transportation safety and enforcement by Mae Hanzlik, SGA Senior Program Manager of Thriving Communities, completed during her time at Johns Hopkins Bloomberg School of Public Health.

That's the temperature not the speed limit sign
Photo from WUWM via WisDOT’s traffic cameras

Around 40,000 people died on America’s roadways in 2020. Many state and local departments of transportation, encouraged by the National Highway Traffic Safety Administration (NHTSA), choose to address this crisis by educating drivers, increasing the enforcement of traffic laws, and promoting automated driving technology. But as Smart Growth America’s Dangerous by Design report notes, year after year, traffic fatalities continue to rise. Each of these approaches has its place, but they all have something in common: they focus on addressing human error, and they fail to acknowledge that mistakes are an inherent element of driving. 

This fundamental misunderstanding is fatal, leading to higher speeds and more roadway fatalities, increasingly in recent years. We’ve pulled together all the available data to set the record straight. Strategies that fail to accept human error and reduce speeds also fail to reduce road casualties.

This post is the first installment of a series on road safety programs. For design solutions that can make mistakes less fatal, watch for part II and III.

Education

One of NHTSA and state DOTs’ favorite traffic safety interventions is public awareness and education campaigns like the ones below. These types of slogans can be found plastered across billboards along most state highways and interstates, begging drivers to stop speeding. Advertisements like these are often accompanied by direct outreach through new driver education programs in high schools across the country.

Drive fast finish last ad
Image from NHTSA

Some public awareness campaigns, like those that encourage parents to secure their young children in child safety seats while driving, can be effective. But broader, more vague efforts to get drivers to slow down, make bicyclists wear helmets, or have pedestrians wear high-visibility vests have failed to reduce roadway injuries and fatalities.

State and federal regulators seem to believe that drawing a public connection between behavior and safety will encourage safer driver behavior. But a sweeping 2008 report from the National Cooperative Highway Research Program (NCHRP) found that “information-only programs are unlikely to work, especially when most of the audience already knows what to do.” Drivers know what unsafe behavior looks like, but on roadways that are designed to allow for speeding, doing so is often the most convenient choice. 

New driver education programs, despite being much better targeted at the needs of their audiences than general public awareness campaigns, are not much more effective. In a University of North Carolina evaluation of North Carolina’s Kindergarten-9th grade child traffic education program, researchers found that despite a “significant increase in students’ traffic safety knowledge…behavioral observations failed to reflect this increased knowledge.” 

Researchers have found the same phenomenon to be true for older teenagers in licensure programs, whose lessons learned in driver education programs have limited impact when they encounter roadway designs that incentivize unsafe driving. This stark difference between what young drivers are taught about driving the speed limit and the reality of roads built for speed creates a dangerous contradiction, which NHTSA itself readily admitted in a review of local programs. Of course, driver education programs are necessary to introduce new drivers to the rules of the road. But leaning on them as catch-all solutions to skyrocketing road fatalities is likely to be ineffective at best and counterproductive at worst.

Public safety awareness and education campaigns, often defended as benign public services, require a lot of cash. They cost federal and state agencies millions of dollars a year, money that could be better spent on evidence-based approaches to road safety.

Enforcement

Law enforcement plays a major role in today’s traffic safety paradigm. Police reports are the basis of most traffic violation data. And though cities like Washington, D.C. are trying to take traffic enforcement out of the hands of police officers by giving it to other agencies or automating it, most areas around the country require all moving violations to be enforced by uniformed, armed police officers. 

This approach often harms the communities it seeks to protect. Any limited ability that law enforcement has to make our roads safer is diminished by the harm that it causes in the process. Law enforcement officers killed over 400 non-violent drivers and passengers during routine traffic stops between 2016 and 2021. These impacts fall disproportionately on Black people.

Police reports are not accurate reflections of the causes of vehicle crashes. By nature, police reports focus on individual behavior, aiming to attribute blame to people involved. They fail to acknowledge the role of road design and vehicle size in crashes. For example, if a pedestrian is struck by a vehicle while crossing the street mid-block because the next crossing is a mile away, the police will often blame the pedestrian for not obeying the law. These faulty data lead policymakers to design solutions that try to correct for individual behavior rather than trying to better understand behavior as a symptom of a larger problem. 

Organizations like the American Public Health Association and the Center for Policing Equity have called for and suggested more equitable forms of traffic enforcement. New ideas like these are worth considering.

Technology

Since the invention of the automobile, improved vehicle safety features have saved countless lives. But most of these advancements, like seatbelts, airbags, and frontal and side impact testing have focused on the safety of those inside the vehicle in the event of a crash, doing little to prevent crashes themselves.

With skyrocketing fatalities among vulnerable road users (like pedestrians, cyclists, and wheelchair users), though, NHTSA and other authorities have championed some new driving systems, namely Advanced Driver Assistance Systems (ADAS) and Automated Driving Systems (ADS), as solutions. ADAS and ADS are technologies that can help drivers detect road obstacles and avoid them before the driver can react themselves. Companies like General Motors have even touted their features as a step toward a “vision of zero crashes.”

But the reality of these systems is a lot more complicated. Most vehicles equipped with ADAS or ADS allow drivers to disable those systems. A study by J.D. Power indicates that many drivers are opting to disable their ADAS or ADS out of annoyance. But even when ADAS or ADS are active, their safety benefits are dubious. These systems routinely fail to detect the presence of children, as well as people of color and those with disabilities. Children, people of color, and people with disabilities are far more likely to be killed as pedestrians, so these advanced driving systems have the potential to deepen the inequities on America’s roads. 

Tesla’s ADAS/ADS systems, some of the most popular on the road today, have resulted in hundreds of road fatalities each year. California’s Department of Transportation had to confront Tesla after that company’s ADAS systems, often advertised as fully autonomous vehicles, resulted in several manslaughter charges being filed against drivers that abdicated their driving responsibilities to their “autonomous” systems. 

So without significantly more regulations on ADAS/ADS, their benefits will be minimal and they might actually be counterproductive, since human error is nearly impossible to eliminate from the act of driving, at least with current technology. Policymakers should consider this fact before entrusting the safety of American roadways to new technologies.

So what?

The widely-accepted paradigm of changing driver behavior through education, enforcement, and technology is not making road users safer. So wherever these strategies are currently being implemented, policymakers and regulators should seriously consider whether they are accomplishing desired safety outcomes. Advocates should persistently ask their state and local governments: “Where’s the evidence that you’ve been able to reduce driver error?” Most of the time, the answer will be: “There is none.”

But calls to reduce these ineffective measures are likely to be ignored without alternatives that actually reduce roadway crashes. By accepting the fact that humans will make mistakes, we can plan for those mistakes and make all road users safer by preventing them. Stay tuned for part two and three of this blog series to see how design interventions can get at those solutions, and further advice for advocates who want to push for change.

11/2/22 edit: A previous version of this post erroneously cited a University of North Carolina study as an evaluation from the Transportation Research Board. This post has been updated.

Vision Zero won’t happen without Safe Streets for All

Seattle Vision Zero sign: Look Out for Each Other
Signs like this one, while welcome, aren’t enough to lower the ever-climbing rate of pedestrian fatalities. Fortunately, localities have other resources to make on-the-ground changes. Image from Flickr/SDOT

The infrastructure law created a new grant program to help communities tackle the increasing rate of roadway deaths. The Safe Streets and Roads for All program allows localities to take direct steps to improve safety for all roadway users, whether they’re setting up a Vision Zero plan or actually planning, designing, and constructing street safety improvements. Funding is available now.

Is there a particularly dangerous street near you? We and Smart Growth America want to see it. Share photos and videos of your streets on Twitter with #DangerousByDesign and/or tagging @SmartGrowthUSA. Learn more on Smart Growth America’s website.

In a recent House Transportation and Infrastructure Committee hearing, expert witnesses and representatives alike expressed their commitment to Vision Zero as well as their concern for underserved and marginalized communities. Representative Hank Johnson (D-GA) got the discussion started, and his words are worth repeating:

Rep. Hank Johnson speaking

“While pedestrian safety impacts all Americans, the risks are not evenly distributed. According to a recent Governor’s Highway Safety Association study, Black children ages four to 15 had the highest rates of fatalities involving pedestrians as a percentage of all motor vehicle traffic fatalities.”

Up to this point, localities across the United States had to rely on their own resources or engage in long, frustrating negotiations with their state DOTs to tackle roadway safety issues with existing federal formula funds. Now, localities that want to implement Vision Zero plans have a more direct route to funding and guidance through the new Safe Streets for All (SS4A) program. Created by the infrastructure law, the SS4A program sets aside $6 billion over five years to fund studies, planning, and project construction to increase the safety of all road users and shift the paradigm in road construction to safety over speed.

The Safe Streets for All program is open for business

The USDOT has released a Notice of Funding Opportunity for local authorities, state and local governments, tribal groups, and metropolitan planning organizations (MPOs). Any of these entities can now apply alone or through a joint application with other entities (encouraged). Because of the historical complexities in applying for federal grants, the USDOT’s R.O.U.T.E.S. tools have been made available to support communities needing technical help with applying and processing grants, especially rural and underserved communities.

The Federal Highway Administration (FHWA) requires a Comprehensive Action Plan (otherwise known as a Vision Zero plan) prior to funding the planning and construction of safety projects with SS4A program dollars. SS4A funding opportunities are available for applicants in varying stages of Vision Zero planning. Applicants who are starting from scratch or who require a considerable amount of work to complete an Action Plan should apply for an Action Plan Grant (or a Supplementary Action Plan Grant for plan update work). An Action Plan Grant consists of a safety analysis, equity considerations, planning structure, and other aspects that culminate in a plan to achieve the goal of Vision Zero. Likewise, applicants who are ready to build projects in their Vision Zero plan should apply for an Implementation Grant.

Type of grantMax funding
Implementation Grant$30 million
Action Plan Grant (localities or tribal governments)$1 million
Action Plan Grant (MPOs)$5 million

Drawing from the program’s $6 billion, the FHWA expects to fund hundreds of Action Plan Grants and about 100 Implementation Grants. As shown in the table above, different allotments of funding are provided for different stages of implementation (with the maximum amount of $30 million provided for Implementation Grants). If an applicant is selected for a grant through SS4A, the entity must commit to Justice40 goals including the allocation of 40 percent of funding to low-income or underserved communities.

After the application process, the FHWA will assess applications using criteria considering safety, equity, effective practices and strategies, project readiness and more.

Maximizing the potential of programs like SS4A is essential

An excavator digs a massive hole titled "Dangerous Roads $$$". On the other side of the hole, a man tries to fill the hole with a small pile of dirt (labeled "Safety Improvements $." The comic is labeled "U.S. Approach to Road Safety."
Produced for T4America by visual artist Jean Wei. IG/@weisanboo

While disappointing but not surprising, the majority of funding from the infrastructure law sticks to the status quo of giving states wide flexibility with their federal dollars, which many states use to widen roads, build new ones, and/or prioritize speed above safety, often perpetuating the same problems that programs like SS4A are created to solve. (Dangerous By Design 2022, an upcoming report created by the National Complete Streets Coalition and Smart Growth America, will get into some of these concerns.) For this reason, it’s vital that every dollar of the new SS4A program is maximized, helping as many communities as possible capitalize on this opportunity to create safer, more equitable roads that serve vulnerable road users. USDOT should act upon their commitment to equity within this program and prioritize projects that mitigate danger in marginalized communities, where the most vulnerable road users live and travel.

SS4A applications are due on September 15th. Transportation for America members get hands-on assistance in application to competitive grants such as the SS4A. Those interested in becoming members can inquire on our site.

Transportation for America members have access to exclusive resources that provide further detail on this topic. To view memos and other members-only resources, visit the Member Hub located at t4america.org/members. (Search “Member Hub” in your inbox for the password, or new members can reach out to chris.rall@t4america.org for login details.) Learn more about membership at t4america.org/membership.

Transportation for America members have access to exclusive resources that provide further detail on this topic. To view memos and other members-only resources, visit the Member Hub located at t4america.org/members. (Search “Member Hub” in your inbox for the password, or new members can reach out to chris.rall@t4america.org for login details.) Learn more about membership at t4america.org/membership.

WATCH: Safety and vehicle speed are fundamentally opposed

speed limit 20 mph

Sometimes we have to see it to believe it. How would street design really look if we prioritized the safety of all road users? Smart Growth America and the National Complete Streets Coalition’s latest video illustrates that when streets are designed to move as many cars as possible as quickly as possible, other road users pay the price.

speed limit 20 mph
Still from video

The number of people struck and killed by drivers increased by an astonishing amount during the pandemic, but traffic fatalities were already on the rise long before COVID-19. For years, states and localities have focused on enforcement, ineffective education campaigns, or blaming the victims of these crashes, ignoring the role of the underlying perpetrator in these deaths: roadway design.

Right now, transportation engineers tend to favor “forgiving” street design like wide, high-visibility roadways with minimal features that would slow cars down. When all streets are designed this way, drivers are lulled into a false sense of security and speed up—doing exactly what the designs are encouraging them to do. At the same time, crosswalks and other safety elements that would slow car travel are kept to a minimum, making it inherently difficult for all other road users to travel safely. 

Let’s get one thing straight: this design style isn’t “forgiving” at all. The higher a vehicle’s speed, the less response time a driver will have if they make a mistake. Without stop signs and crosswalks (features that slow drivers down), pedestrians have fewer options to cross streets safely. High speeds are also more likely to result in a fatality than an injury.

Complete Streets are streets for everyone. Complete Streets is an approach to planning, designing, building, operating, and maintaining streets that enables safe access for all people who need to use them, including pedestrians, bicyclists, motorists, and transit riders of all ages and abilities.

One way to limit the risk of pedestrian fatalities is to remove pedestrians and nondrivers from the street altogether, as we do on interstates. But what about every other type of roadway, like commercial and residential streets? 

In our latest video, we take a look at the design elements that enhance street safety, and you’ll notice that they all have something in common. When we install traffic signals, bike lanes, narrower lanes, and crosswalks, drivers naturally drive at slower and safer speeds.

Properly designed Complete Streets can improve safety on residential and commercial roadways. But many Complete Streets have been implemented incorrectly, cutting corners to preserve the convenience of drivers. This unfortunate trend reflects a national culture that prioritizes vehicle speed over all else, a culture that is inherently at odds with safer roadways.

If safety truly is the top priority, streets must be designed in a way that makes dangerous behavior difficult and safe behavior easy. Only then can our streets be safe for all.

The infrastructure law and safety: Will it be able to move the needle?

Image from Vignesh Swaminathan, a keynote speaker at this year’s SGA Equity Summit, of his quick-build bike lanes in Emeryville, California

The new infrastructure law authorizes around $650 billion to fund transportation infrastructure through formula and competitive grant programs, some of which have safety as a core emphasis. Here’s what you need to know about the new money and (modest) policy changes to the safety program, as well as how you can make them work for you.

promo graphic for a guide to the IIJA

This post is part of T4America’s suite of materials explaining the 2021 $1.2 trillion Infrastructure Investment and Jobs Act (IIJA), which governs all federal transportation policy and funding through 2026. What do you need to know about the new infrastructure law? We know that federal transportation policy can be intimidating and confusing. Our hub for the new law will walk you through it, from the basics all the way to more complex details.

Update March 3, 2022: This post was updated to reflect that Safe Routes to School funding is subject to appropriations (see the formula safety programs for details).

We are facing an astonishing safety crisis on our roads. The first nine months of 2021 were the deadliest first nine months of a year on America’s roads since 2006, with an estimated 31,720 fatalities. There’s no reason to think that 2022 won’t continue this same trend, which prompted Secretary Buttigieg to present a National Roadway Safety Strategy to set a goal of zero deaths and end this crisis.1

One reason we are facing this crisis of preventable deaths is that within most transportation agencies, prioritizing vehicle speed over safety for all users is a deeply embedded priority. Our priority is different, and we need to start there if we’re ever going to make good on USDOT’s new stated goal of zero deaths:

The new infrastructure law does include some bright spots for holding states and localities more responsible for improving safety, which we discuss below. But overall, Congress largely decided to uphold the status quo, failing to reorient the giant formula programs around safety. Now it’s up to USDOT to do all they can to prioritize safety within their program guidance and grant programs, and for applicants to submit projects that improve safety.

Note: this explainer and webinar from America Walks is full of practical advice about “how volunteer advocacy groups, or local governments without a full-time planner” can steer these funds into improving safety.

What’s in the law?

The new infrastructure law does include funding for safety improvement projects like road diets and Complete Streets, but these are spoonfuls compared to the giant excavator of overall road funding where safety is just one of many considerations as we illustrated here

An excavator digs a massive hole titled "Dangerous Roads $$$". On the other side of the hole, a man tries to fill the hole with a small pile of dirt (labeled "Safety Improvements $." The comic is labeled "U.S. Approach to Road Safety."
This illustration was produced for T4America by visual artist Jean Wei. IG/@weisanboo

The new bill does not reorient the transportation program around safety.  It allows funding to be used to build safer roads but doesn’t require it. Dedicated safety funding remains a relatively minor amount of the entire program. But the new law does make some alterations to safety policy. One is how we measure state performance and then hold them accountable. If 15 percent or more of a state’s fatal crashes involve vulnerable road users (i.e. pedestrians, cyclists), then a minimum of 15 percent of their Highway Safety Improvement (HSIP) dollars must go toward making those vulnerable users safer.

We’re giving states a small amount of money to improve a problem that transportation agencies can continue to create or exacerbate with a much larger amount of money. 

The law also made several other important changes to how USDOT will evaluate safety. It updates standards for the mandatory Highway Safety Plans to change the word for vehicle collisions from “accident” to “crash” (a small but meaningful shift) and to include more public participation and feedback. It updates uniform standards to acknowledge the role of human error in new vehicle technologies. The law allows USDOT to reapportion (i.e., give away) state funding to other states if a state continuously fails to improve their safety outcomes and prevents states from setting worse/lower safety performance targets than the year before. 2

And the law requires USDOT to set minimum performance targets for states in consultation with the Governors Highway Safety Association. This is not an exhaustive list, but overall USDOT does have several more policy levers to create safer roads across the U.S.—if they use their new powers effectively.

Formula safety programs

Program nameAuthorized funding (over five years)Can be used for:Should be used to:
Transportation Alternatives Program$7.2 billion (10% of STBG funding), up from a flat $4.2 billion in the FAST Act, with 41% going to state DOTs and 59% going to MPOs and localities.Projects that promote modes of transportation other than driving, with notable inclusions being anything eligible under the SRTS program and newly defined “vulnerable road user safety assessments”.Make roads safer for all users by planning for and building facilities for walking, biking, and other modes that protect those users from high-speed vehicles.
Safe Routes to School (SRTS) Program$1 million minimum to states by formula (subject to appropriations), based on primary and secondary school enrollment numbers.Active transportation and complete streets projects, plus education or enforcement activities that allow students to walk and bike to school safely.Give students safe, convenient routes to school by prioritizing their travel over the speed of cars.
Highway Safety Improvement Program (HSIP)$16.8 billion, apportioned to states by formula.Highway safety improvement projects, which are defined very broadly, from rumble strips and widened shoulders to data collection and safety planning.Re-orient highway safety spending toward traffic calming and projects that protect all road users, not just drivers.
Congestion Mitigation and Air Quality (CMAQ) program$13.2 billionAny transportation project that reduces emissions from vehicles, including micromobility (bike or scooter share) and electric vehicles.Focus emissions mitigation efforts on mode-shift away from driving, not on increasing vehicle speed. Specifically, states and localities should use CMAQ funding for micromobility projects.

Competitive programs applicable to safety

Some of the safety funding in the infrastructure law is split between several programs, many of which are made available directly to states or localities as competitive grants (more here on best practices for applying to those). 

Program nameAuthorized funding (over five years)Can be used for:Should be used to:
Active Transportation Infrastructure Investment Program$1 billion, subject to annual appropriations of $200 million each year.“Active transportation” projects.Provide safe and integrated road facilities for pedestrians and bicyclists to access community destinations.
Rural Surface Transportation Program$3.25 billion, with $1.5 billion set aside for Appalachian highways.Most projects on rural roads, including projects that protect all road users but also highway projects with adverse effects.Retrofit roadways to serve the community’s road users vs speed.
Safe Streets and Roads for All$6 billionVision Zero plans and implementation projects.Expand upon road diets, sneckdowns, and other treatments to improve vulnerable road user facilities (through directness to destinations, level of comfort, and intersection visibility).
National Infrastructure Project Assistance$60 billionProjects that provide economic, mobility, or safety benefits.Build safety infrastructure to protect all users on highways (like traffic calming) and across highways (like pedestrian bridges that reconnect communities). But those uses are likely to face headwinds in delivering true safety benefits without accountability.
RAISE competitive grants. (This is the former TIGER and then BUILD program, so is not a new program, but is now funded at a much higher level)$30 billion, up from only $4 billion spent from 2009-2020.Local or regional projects that improve safety, environmental sustainability, quality of life, economic competitiveness, state of good repair, and connectivityBuild projects that accomplish numerous goals including safety. Many of the best TIGER projects over the years made major safety improvements while ticking off other goals.

How else could the administration improve the safety program?

In addition to creating robust guidance for administering all of the programs listed above, the Biden administration should modernize the traffic engineer’s go-to guidance (the MUTCD) to reorient it completely around safety and people, and away from its outdated focus on vehicle speed and flow. Unfortunately, the indication from USDOT is that they are punting more substantial edits to a future revision. USDOT closed comments in May 2021 and have suggested that only modest revisions will be forthcoming, but what they choose to change will still matter.3

In addition, the FHWA Administrator’s vulnerable road user research should make sure the agency’s very good recommended safety countermeasures have teeth and recommend substantial design changes, not just behavioral suggestions.

How can the new money advance our goals?

Equity

The safety of all road users is closely tied advancing racial equity and addressing climate change, among many other goals. Our research in Dangerous by Design indicates that low-income and people of color make up a disproportionate amount of the people struck and killed while walking. So providing safe ways for all people to use our streets is critical for advancing our communities’ goals of being more inclusive and connected.

Relative pedestrian danger by race and ethnicity

Climate

There is incredible interest and demand in switching more trips from cars to bikes or other modes (an important strategy for cutting down on carbon emissions) but if Americans do not feel safe enough to bike or walk regularly, the ones who have the option to do so will continue to drive.

Translating federal funding into projects that advance safety is more complicated. As outlined above, formula grants are mostly controlled by state and regional governments who have other top priorities other than safety, no matter how much they profess that safety is #1. Approaching them with projects that have wide and deep support within a community usually gives you the best chance for success. For the highly flexible competitive grants, the America Walks’ explainer contained some concrete advice:

Ken McLeod of the League of American Bicyclists gave a great breakdown of the biggest opportunities in competitive grants for active transportation. First, he said, start by looking at your existing transportation plans. “If you have a plan that is a 20 year plan, and if you are in phase 3, this is like a perfect grant program to get your phase 4 or phase 5 funded in a quicker timeline than you might working through other federally funded programs,” explained Ken.

National Association of City Transportation Officials (NACTO)’s Sindhu Bharadwaj underscored the importance of coalition building for competitive grants. Advocates in small towns or very car-centered regions might be able to acquire some additional funding. The key to their success, though, is focusing and working together. As Sindhu said, funding opportunities can be a chance to bring together a number of organizations and advocates to pick one big goal, like adopting a new design plan. She suggested that the pursuit of funding can be a galvanizing point for a governing body or advocacy group.

So what?

The most important thing to remember is that every single one of the federal transportation programs can be used to improve safety. Safety is always an eligible use. So as you engage with local, metro, and state decisionmakers, you can remind them: If safety is the top priority then every dollar from every program that they have at their disposal can and should go to improve safety for all users. And then hold them accountable: Congress has given them the complete freedom to prioritize safety, so if safety is getting worse, there is no one else to blame.

Considering the crisis of roadway deaths and the limited funding available for safety, it’s critical that we ensure that 1) the safety funding is spent in the best way possible, and 2) that states and metro areas feel the pressure to tangibly improve safety with their bigger, flexible pots of road funding. Creating a vision for what you want to do is a great first step. More from America Walks:

 ‘I think the most important thing is to have a strong vision locally, and worry about resources next,’ [Beth Osborne of Transportation for America] stated. ‘With good commitment and vision, you can find resources. And…there are tons of places to go for money! You do not have to stay in one tiny pod, you also do not need to make every active transportation effort its own project.’ With that vision, ask your state and local transportation officials how they are planning to seek federal dollars. They ultimately write the grants or propose budgets to elected officials. You need to know if they are working to fund a walkable equitable vision for the community, or are they trying to fund projects envisioned in a prior era. With prompting from community leaders you can help break the inertia of the past.

For planners, engineers, local officials, and other decision-makers, you will be competing with other states, MPOs, and localities for these competitive grants. Understanding the programs in and out will be critical for mustering the financial and vocal support needed to put forth a strong application. That’s how you learn, for instance, that National Infrastructure Project Assistance grants can be used for safety projects. 

One last important note we addressed in our competitive grants blog post: Strong local matching funds (ranging from 20 to 50 percent of project cost) are critical to winning these grants, and the process to raise these funds starts by engaging in state and local budget processes far in advance (6-9 months before the start of the fiscal year.) So advocates, this means you should engage agencies early and often on resource prioritization to realize transit projects.

(Note: For the more policy-minded, read our pre-existing funding memos on the programs that the IIJA can fund. Many of them have the possibility to improve safety if used well, but the active transportation memo contains the programs that can be most easily flexed to fund safety projects.)

If you have additional ideas for how to utilize these expanded programs, or have questions about the content listed here, please contact us. Our policy staff is eager to hear from you. 

Our solutions for congestion are worse than the problem

For decades, transportation agencies have been trying to “solve” congestion by increasing road capacity, even when doing so can obliterate or divide communities, harm local businesses, and make streets more dangerous. Our latest cartoon shows how our “cures” for congestion are often worse than the problem.

While every transportation agency (including USDOT in their new road safety strategy) will tell you that safety is always the biggest priority, you can see what the real priority is by following the money. It’s usually the same goal: reducing congestion. Our latest cartoon in our ongoing series shows just how shortsighted and bankrupt our current approach to congestion is:

Illustration produced for T4America by visual artist Jean Wei. IG/@weisanboo

Follow the money or tear at the seams a bit on many supposed “safety” projects and you’ll quickly find that reducing congestion is often the real consideration.

While the Texas Department of Transportation is certainly on one particular end of the spectrum, this story from last week highlights just how deeply they consider reducing congestion their most important charge. In this case, TxDOT transferred a city street from state control to the City of San Antonio years ago, which is now deep underway on a project (supported by 70 percent of voters!) to increase the value of the corridor and make the street safer by slowing traffic and reducing the number of travel lanes. The project will “allow for protected bike lanes, wider sidewalks for pedestrians, and the planting of shade trees,” according to the San Antonio Report.

So how did TxDOT respond to those plans, after a questionable legal move this week to seize control of the street and put it back under state control? (Bold and italics ours.)

This action is needed as a result of local proposals to convert the existing three lanes to two lanes in each direction and remove turn lanes along SL 368. These local proposals would result in a significant increase in congestion. TxDOT remains focused on strategies to decrease congestion and will work with the City and other local stakeholders to develop solutions for SL 368 that serve to maintain the existing three lanes in each direction while addressing the mobility and safety needs of all users.

Safety is still important, you see. TxDOT is still committed to addressing the “mobility and safety needs of all users,” as long as it doesn’t interfere with having as many vehicle lanes as possible. Safety is ok, so long as it is additive. But if it interferes with their ability to address congestion, safety takes a back seat, every time. And so they are attempting to halt the city’s plans by seizing this road to keep the local government from following through on voters and taxpayer wishes by prioritizing safety and creating a productive, valuable place instead.

Residents and leaders of struggling cities or neighborhoods will also tell you that the only thing worse than congestion is no congestion. Denuded, downtown and near-downtown streets in these kinds of places are exhibit A. They are wide, mostly empty, easy to speed on, terrible to walk on, and lack productive economic activity along many of them. What mayors of those places wouldn’t give for some congestion—a sign that a lot of people want to be there. Congestion is both a sign of economic productivity and perhaps counterintuitively one of the few things keeping more people from dying on streets that are designed for much higher speeds:

And as we’ve chronicled heavily in The Congestion Con and our work on induced travel demand, attempts to solve congestion with more lanes and more capacity are both immensely expensive and never bring the promised results. But worse, congestion reduction is sold as a way to benefit the economy, yet congestion is too often solved by obliterating the local economy.

Do you have a story like this one from Texas to share? We’d love to hear your stories about attempts to “solve” congestion that decimated a place, made a corridor even less safe, or went completely against local wishes.

Please share this cartoon on social media! Download it to your phone or computer (“right click, save as…”)  from this link and upload to Facebook, Twitter or the channel of your choosing. You can link back to this post with it if you like: https://t4america.org/2022/01/31/our-solutions-for-congestion-are-worse/

Behind the scenes on the rise in pedestrian and cyclist fatalities and injuries

A bike on its side after a crash

Driver expectations, higher speeds resulting from less congestion, major gaps in infrastructure, and a systemic criminalization of pedestrian and cyclist traffic on the road have contributed to the alarming, record increases in the deaths of people struck and killed while walking or biking, according to researchers.

Crash at Lincoln Park and Barbee in Lincoln Heights. Photo by Umberto Brayj via Flickr.

Whether for recreation or simply to get from point A to point B, Americans have been walking and biking more, and thanks to COVID-19, this pattern has only intensified.

As more people walk and bike, we’ve also seen a historic increase in the numbers of people struck and injured or killed by vehicles while walking or biking. Researchers have been delving into this worrisome trend and the factors that may be contributing to this pattern, and at the same time, municipalities are rethinking their roadway safety or Vision Zero strategies.

Photo on left: An open street in Georgia. Photo by Joe Flood via Flickr.

Research out of the University of Toronto highlighted a worrisome trend of drivers failing to acknowledge cyclists or pedestrians, especially at turns and intersections. “The results were quite surprising,” said Professor Birsen Donmez. “We didn’t expect this level of attention failure, especially since we selected a group that are considered to be a low crash-risk age group…. Drivers need to be more cautious, making over-the-shoulder checks, and doing it more often…. The takeaway for pedestrians and cyclists: drivers aren’t seeing you.”

They go on to postulate that there is an increased intensity and diversity of demands for drivers’ attention, including signage, diverse modes of transport and their evolving technology, and the presence of more cyclists and pedestrians. (Others have noted that the increase in deaths was coupled with increases in speed overall during the first half of the pandemic as streets emptied out, showing the connection between speed and greater numbers of deaths.) This demand for attention is at odds with the complacency of drivers, many of whom are not accustomed to having to worry about pedestrians and cyclists, and now they’re struggling to adjust. Making matters worse, the pedestrian and cyclist infrastructure that could clue drivers into the need to make room on the road is inconsistent, making it harder (not easier) for drivers to recognize when they’re sharing the road.

The need for consistent pedestrian and cyclist infrastructure is a twofold problem. One, roadway design and transportation policy makes safety and convenience for cyclists and pedestrians secondary to the auto, and at times, normal cyclist and pedestrian behavior is deemed outright illegal, according to Peter Norton’s book Fighting Traffic: “In the early days of the automobile, it was drivers’ job to avoid you, not your job to avoid them…. But under the new model, streets became a place for cars — and as a pedestrian, it’s your fault if you get hit.”

This encourages false assumptions about what belongs and what doesn’t belong on our roadways; as if streets aren’t meant to be shared with other users. If drivers assume pedestrians and cyclists shouldn’t be in the road, they’re less likely to be on their guard.

Image on left: An anti-jaywalking poster created in 1937. From Wikimedia Commons.

Secondarily, according to research by J. M. Barajas‘, the existing engineering, education and enforcement approaches to Vision Zero do not address the root of the issue with pedestrian and cyclist traffic fatalities that are overrepresented by people of color. This disproportionate impact is the result of a failure to invest in safe bike and pedestrian accommodations in marginalized communities. 

Simply adding bike lanes and sidewalks won’t be enough. Safety from crime is another issue of concern for people of color, who often opt to travel on higher visibility corridors, which is where bike lanes and sidewalks are rarely considered because of the impact on the traffic engineers’ sacred cow of vehicle speed. Instead, this necessary infrastructure is more commonly placed on low-volume roadways, which have less public visibility. And for those who do bike, they are subject to police harassment, as cops are more likely to stop Black cyclists than white cyclists.

Since the spike in traffic deaths during the pandemic, pedestrian and cyclist fatalities are getting more visibility. The way we respond to this issue matters. Will we continue to push for only more ineffectual traffic enforcement, which disproportionately harms people of color? Will states and localities continue to push education campaigns that do nothing to address the root causes of driver inattention? Will we finally address unsafe designs as a primary culprit? Under the infrastructure bill, we could easily turn up the dial on these failing approaches and claim progress, even as fatalities continue to worsen.

What pedestrians and cyclists really need isn’t more tickets for jaywalking or lectures about wearing reflective gear. They need infrastructure that consistently makes room for them, prioritizes their safety and comfort above vehicle speed, and that provides greater visibility for all road users when they do mix with traffic, so that when drivers need to share the road, it doesn’t come as a surprise.

Month of Action Week 2: Tackling our deadly streets

With Congress writing long-term transportation policy this month, we need to make sure that this bill doesn’t continue the broken status quo. This week, we need you to take action to support the Complete Streets Act.

With the Senate writing long-term transportation policy right now, our Month of Action is going full-steam ahead. Thank you if you took last week’s action to send our template reauthorization letter to your member of Congress. 

For Week 2, we need you to take action to support the Complete Streets Act. 

The number of people struck and killed by drivers while walking increased by 47 percent over the last decade, as our partners at Smart Growth America found in the latest edition of Dangerous by Design, to be released tomorrow. We are in the midst of an astonishing safety crisis as the United States has become—over decades of broken policy—an incredibly deadly place to walk.

But a handful of leaders in the U.S. House and Senate have introduced a bill that would finally require states and metro areas to design and build safer streets for everyone. The Complete Streets Act of 2021 is desperately needed but it will take your support—and the support of your members of Congress—to get this bill passed into law.

Keep an eye out tomorrow for Dangerous by Design 2021, Smart Growth America’s report showing how dangerous each state and the largest metro areas are for people walking.

Safety over speed week: The U.S. builds death traps, not streets

We took a look at one busy road outside of Orlando where a dozen people have been struck and killed by drivers in recent years. The mix of high-speed traffic with people walking, biking, and taking transit is a dangerous combination; in the event of a crash, people die. The Complete Streets Act of 2019 would go a long way to give local government more resources to redesign these dangerous streets so everyone can travel along them safely.

South Orange Blossom Trail isn’t a pleasant path through an orange grove, as the name would suggest, but rather a busy street in the Orange State that runs south from downtown Orlando. South Orange Blossom Trail is like many similar ‘arterial’ roads across the country: grocery stores, places of worship, clothiers, gas stations & auto repair shops, apartments & homes, restaurants, and a multitude of other businesses have sprouted along the route. And like so many similar streets surrounded by development in cities and towns of all sizes, it’s also a death trap for people on foot.

A street view of South Orange Blossom Trail and the location of this image relative to the 12 pedestrian deaths along this stretch of road from 2008 to 2017.

Between 2008 and 2017, 12 people walking were struck and killed by drivers along a 3,400 foot stretch of South Orange Blossom Trail. This six-lane thoroughfare (three lanes in each direction) is a gauntlet for people walking, and with the multitude of shops and homes in the area and bus stops regularly dropping people off on the side of the road, people walking are everywhere.

The nearest crosswalk isn’t even visible from this bus stop outside an apartment building.

This particular segment has a posted speed limit of 40 mph, but there is absolutely nothing about the design of this road that would encourage drivers to observe that limit. The wide, straight lanes and open skies communicate to drivers that this is a highway and you should thus be driving at high speeds. There are even signs that tell you which intersection you’re coming up on (because you’re certainly driving too fast to see it, as in the picture above). The only two signalized crosswalks along this stretch for pedestrians are at either end, 3,400 feet apart or about a 15 minute walk. While there are some unsignalized mid-block crosswalks, you have to be brave, stupid, or have no other choice to try crossing three lanes at a time hoping drivers going 50+ mph will stop for you. This street was built for speed not safety. It’s no wonder that a dozen people have been killed while walking along it in recent years.

South Orange Blossom Trail is the quintessential example of how U.S. street design standards and a focus on speed above all else have created such dangerous roads and why we have an epidemic of pedestrian deaths in this country. It’s a street designed for speed and to avoid vehicle delay. People walking, biking or taking transit are merely afterthoughts, just guests on this road designed for cars. Simply ask the people waiting to cross in the middle of these six lanes if it feels like this street was designed with someone walking in mind.

two images showing pedestrians attempting to cross the street.

It’s also the quintessential example of a street that the Complete Streets Act of 2019 in Congress is designed to fix. The Complete Streets Act would designate a small slice of federal highway funding to create Complete Streets that are safe for people walking, biking, taking transit, or driving. Any community with a Complete Streets policy—be it a county, city, town, or tribal government—would be able to apply for this funding directly to retrofit dangerous streets with safer designs.

Take action

Under the Complete Streets Act, counties could adopt a Complete Streets policy (if one isn’t already on the books) and then apply for dedicated funding to retrofit roads like South Orange Blossom Trail in unincorporated areas. Depending on the context, a safer street could include narrower lanes, protected bike lanes, signals at mid-block crosswalks, street trees, and other design interventions that can help slow cars and make space for different uses. On locally-owned roads, cities and towns could use the same pot of federal funding to implement similar improvements on dangerous roads.

For too long, prioritizing cars going fast above all else has been the top consideration in the design of our streets. It’s how we ended up with dangerous streets that look more or less exactly like South Orange Blossom Trail in all 50 states (even in Alaska, just add mountains along the skyline). According to current U.S. street design standards, this road and its ilk are designed exactly as they should be; that’s the problem.

We have to start putting safety over speed. Safety—literally keeping people alive—is more important than shaving a few seconds off a driver’s commute. And prioritizing safety is fundamentally incompatible with high speeds on these kinds of streets. The Complete Streets Act of 2019 would be a major step in the right direction, if Congress can pass it.

Send a message to your representatives urging them to support the Complete Street Act.

Safety over speed week: Prioritizing safety is intrinsically connected with improving transit service

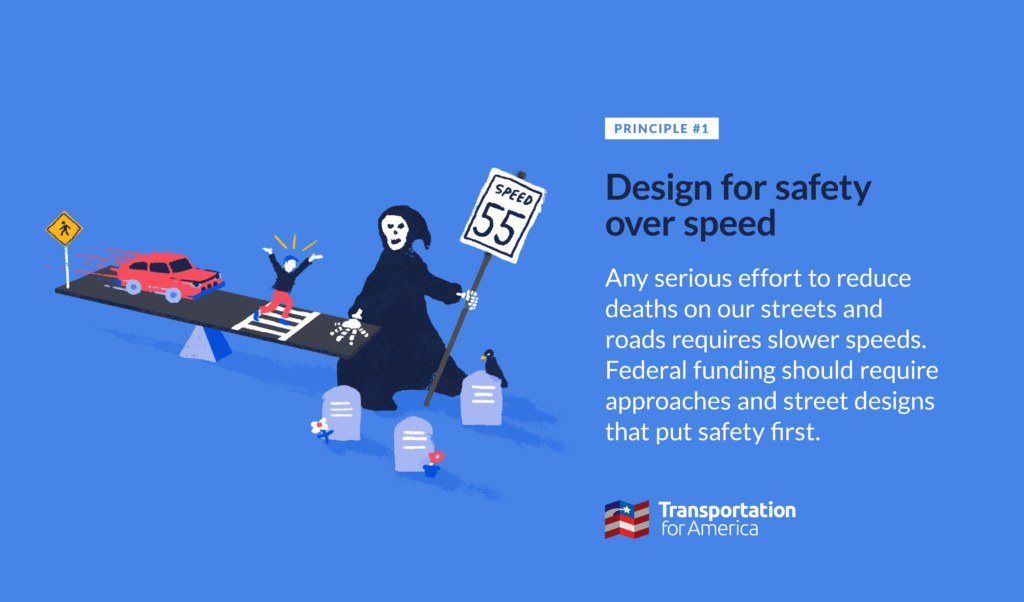
Nearly every bus transit rider starts and ends their trip with a walk, and decisions made to prioritize vehicle speed over safety often have significant impacts on transit. This excerpt from the new book Better Buses, Better Cities helps explain how better bus transit and prioritizing safety over speed are intrinsically related.

It’s “safety over speed” week here at T4America, where we are spending the week unpacking our second of three principles for transportation investment. Read more about those principles and if you’re new to T4America, you can sign up for email here.

The content that follows is an excerpt from “Better Buses, Better Cities: How to Plan, Run, and Win the Fight for Effective Transit” by Steven Higashide, published by Island Press. Steven is a former colleague of ours at T4America as an outreach associate based in New York a few years ago before moving on to the Tri-State Transportation Campaign and then to TransitCenter, where he today serves as the research director. We are proud to see his book in print and are thankful to him and Island Press for letting us share this long excerpt from Chapter 4 entitled MAKE THE BUS WALKABLE AND DIGNIFIED, sourced from pages 59–61 and 74-75. – Stephen Lee Davis, T4America.

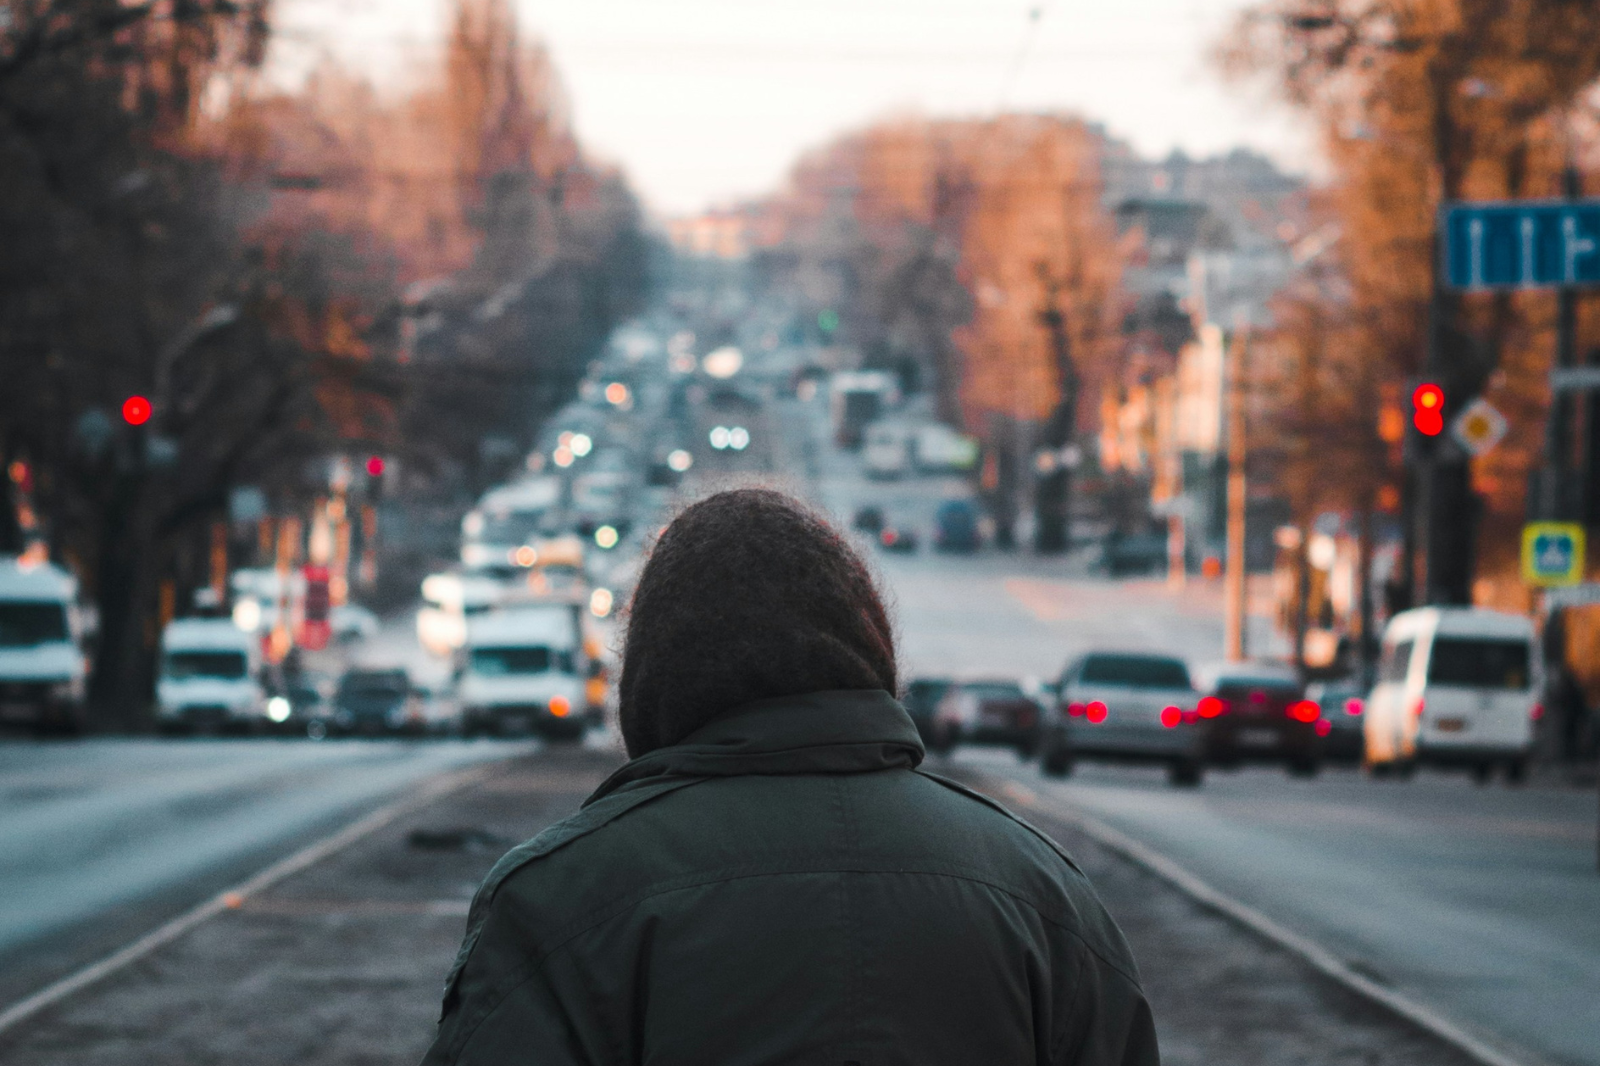
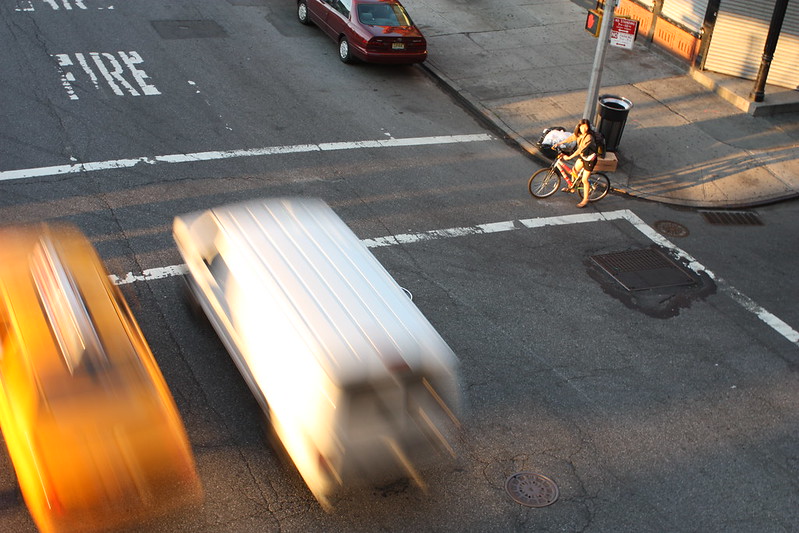
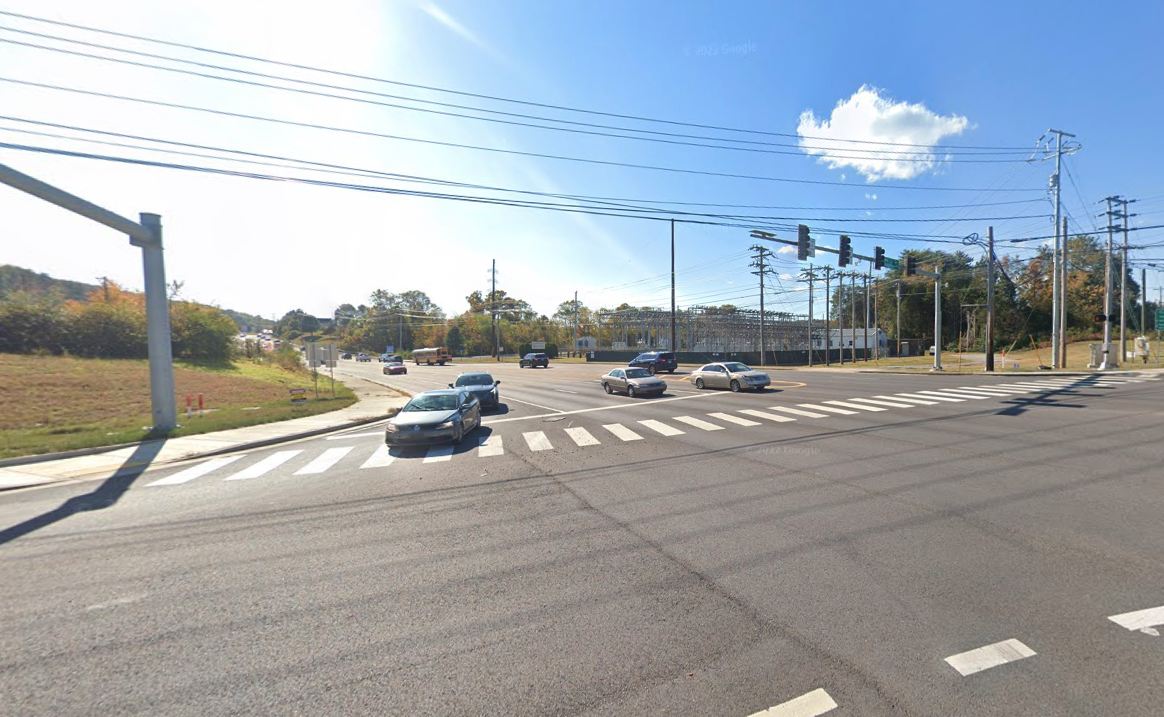
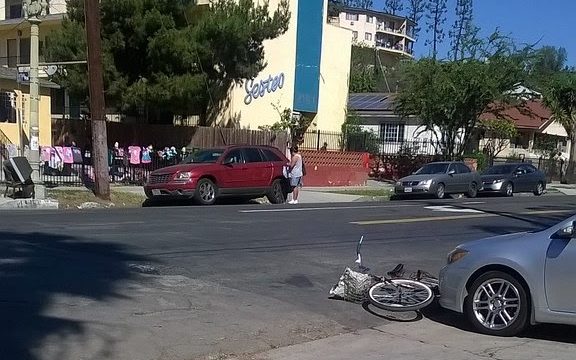
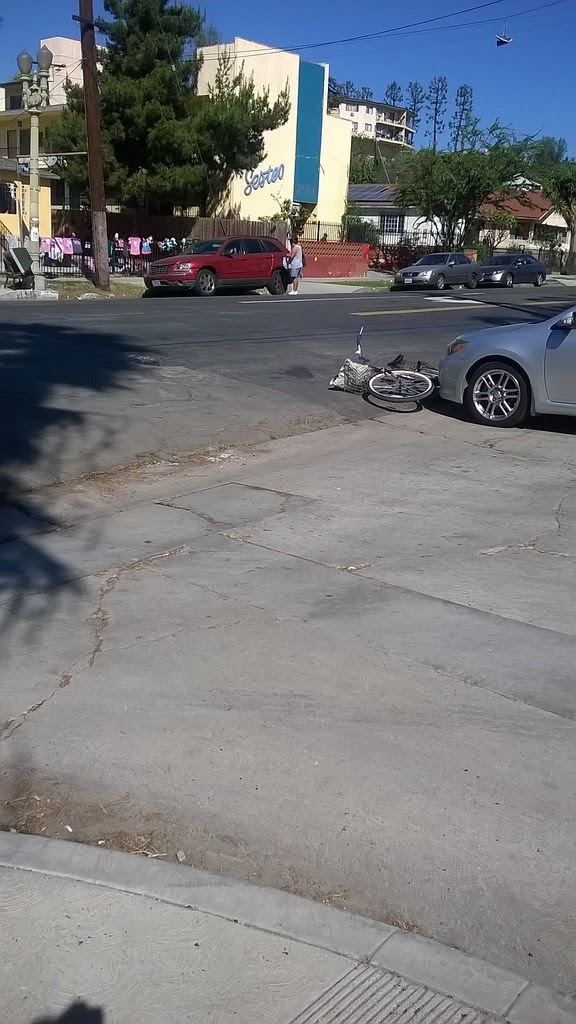
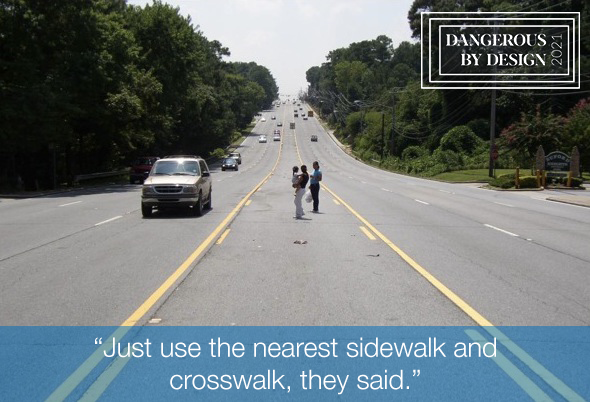
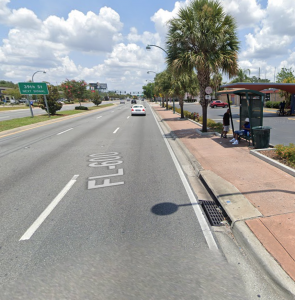
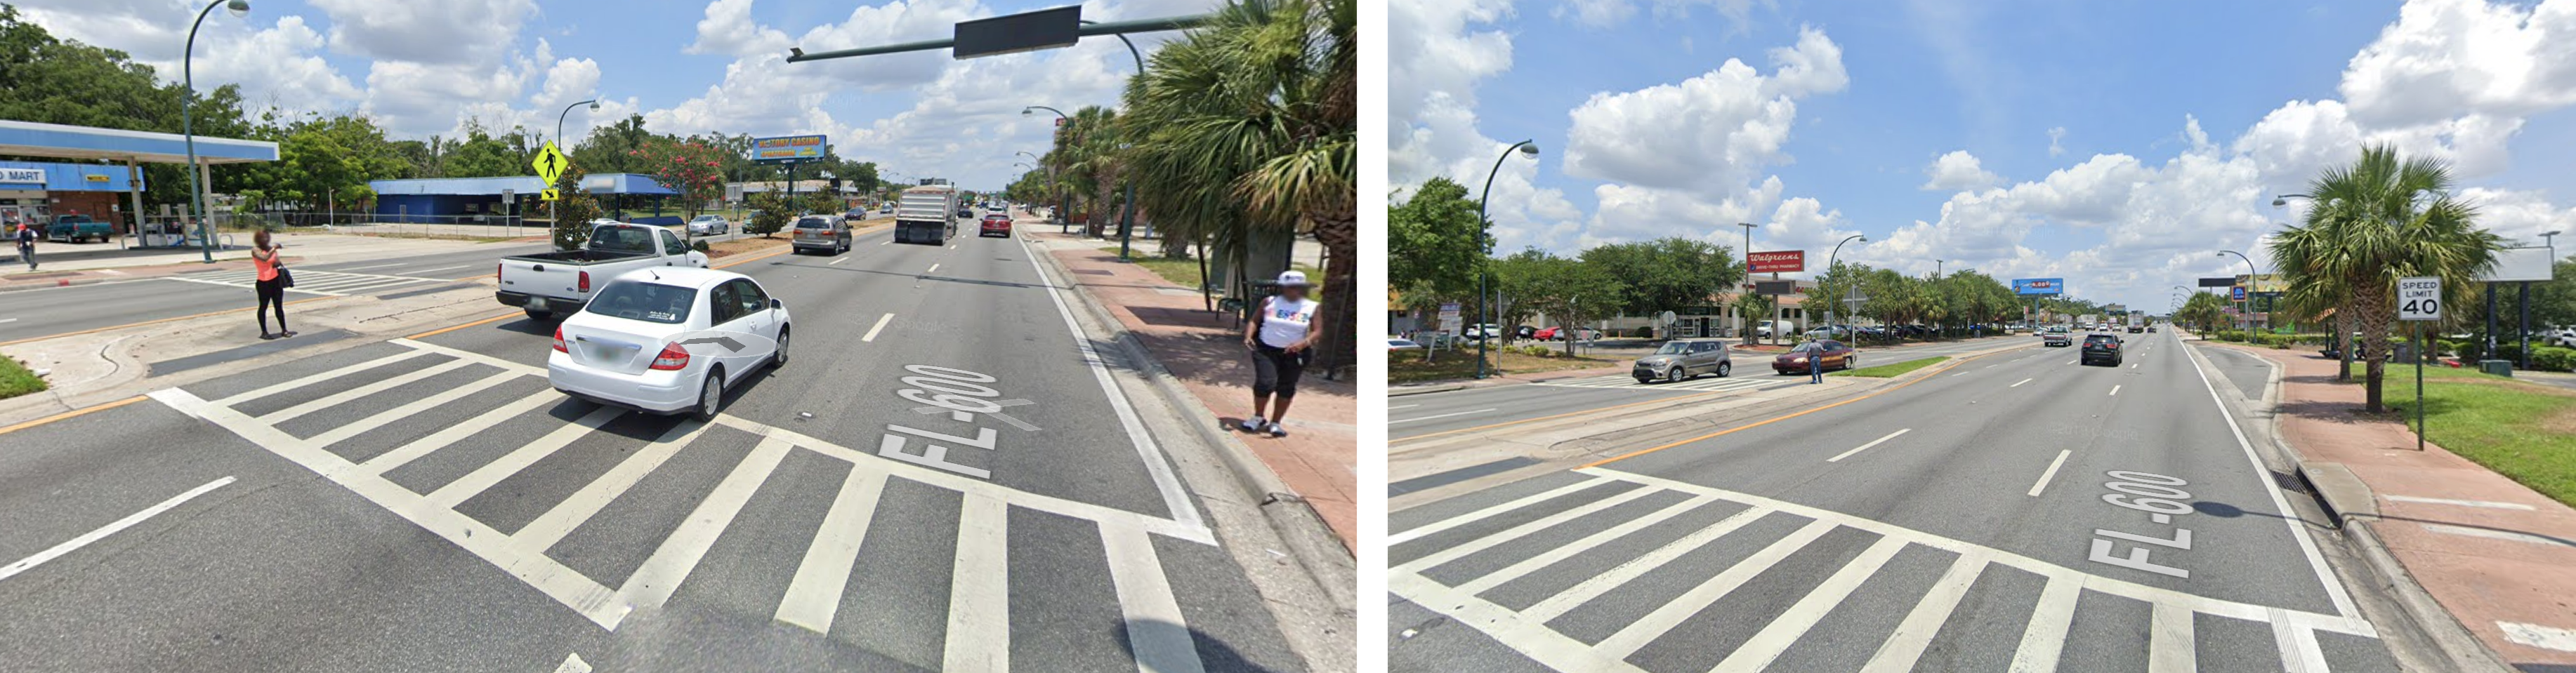
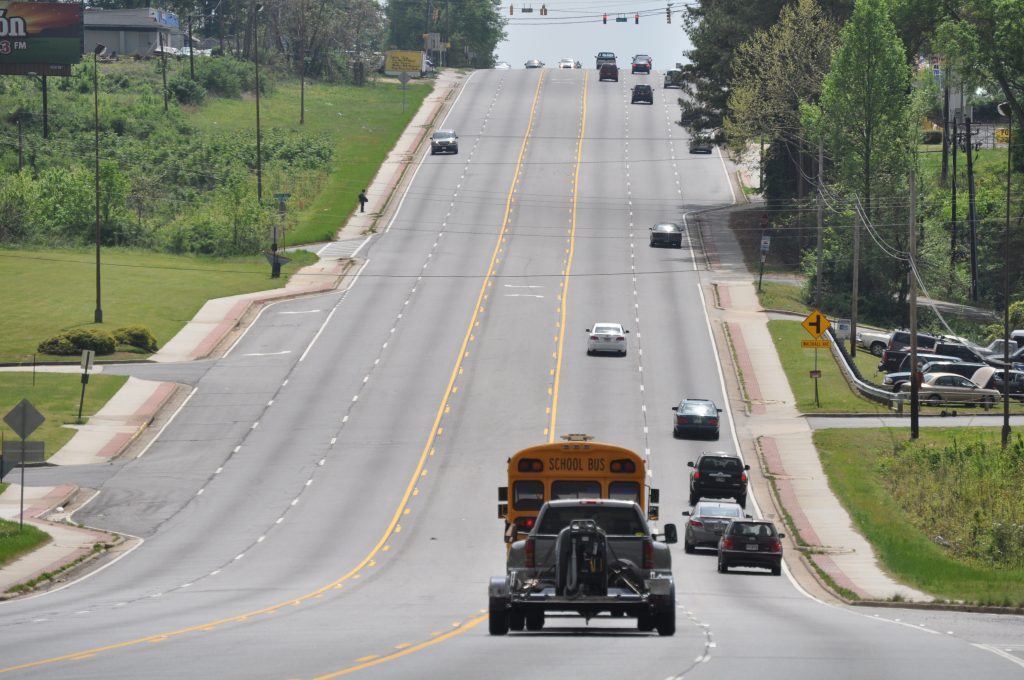
On a Saturday afternoon in April 2010, Raquel Nelson, her 4-year-old son A.J., and her two other children (aged 2 and 9 years) stepped off the bus across the street from their apartment in Marietta, Georgia. It had been a good but long day. Raquel and her children had celebrated a birthday with family and pizza. To get home, they took their first bus from the pizza restaurant to a transit center, where they missed their connecting bus and had to wait more than an hour for the next one.

Home was across a five-lane, divided road. And so, together with several other people who had been on the bus, the Nelson family crossed halfway across the street to wait in the median. As Raquel stopped to gauge traffic, one of the other adults in the group decided to start walking. Raquel’s son A.J. broke free from her grip to follow, and Raquel hurried to catch up.

A.J. was killed moments later, by Jerry Guy, who was behind the wheel of a van despite having “three or four beers” in his system.

Raquel and her 2-year-old daughter were also struck and injured. And yet that was only the beginning of her ordeal.4

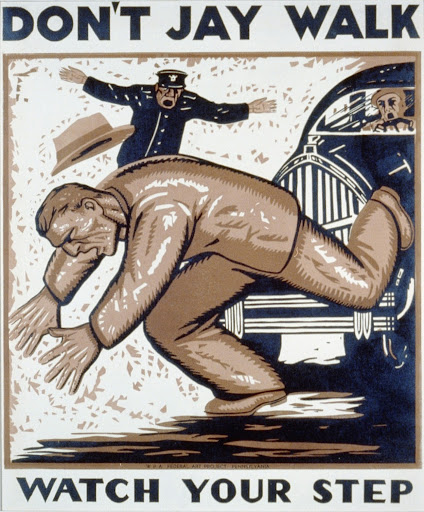
County prosecutors charged Raquel with vehicular homicide, which carried a potential sentence of 3 years in prison. A jury convicted her, and she was sentenced to 12 months’ probation with the option of a retrial, which she chose. Her case wound through the courts for 2 more years before Raquel agreed to plead guilty to a single charge of jaywalking.

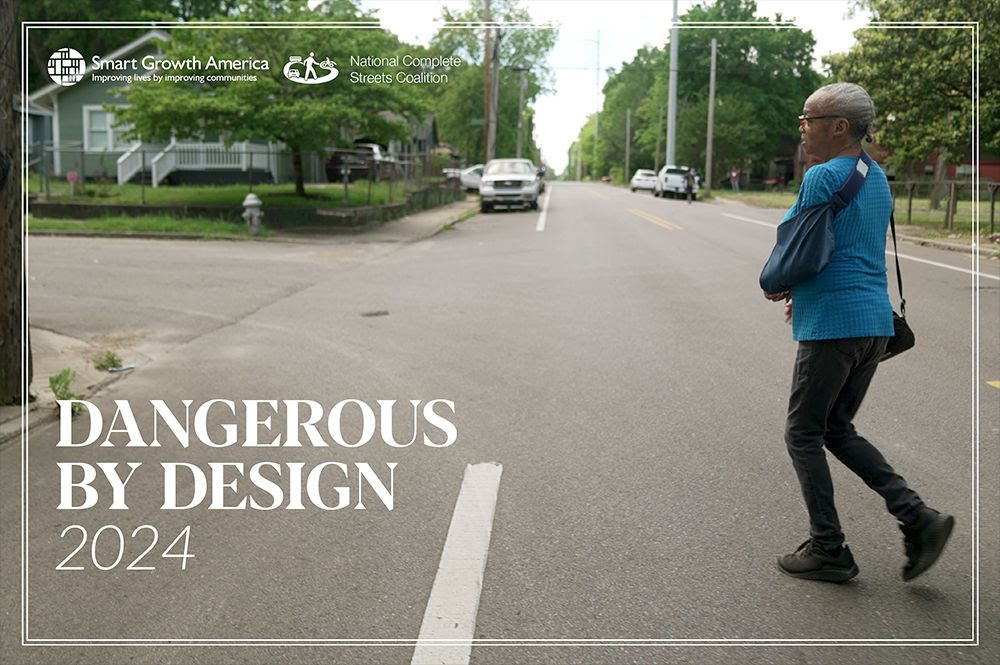
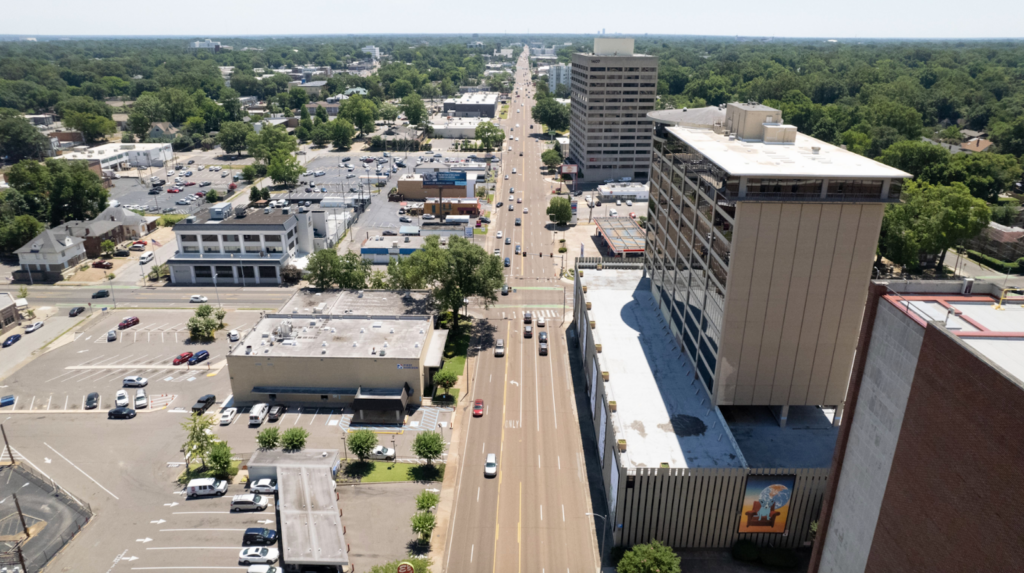
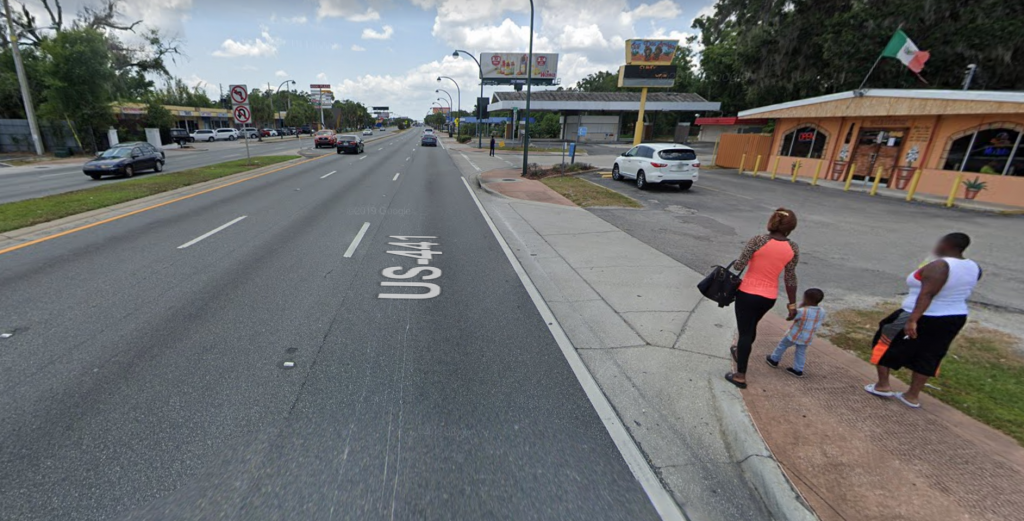
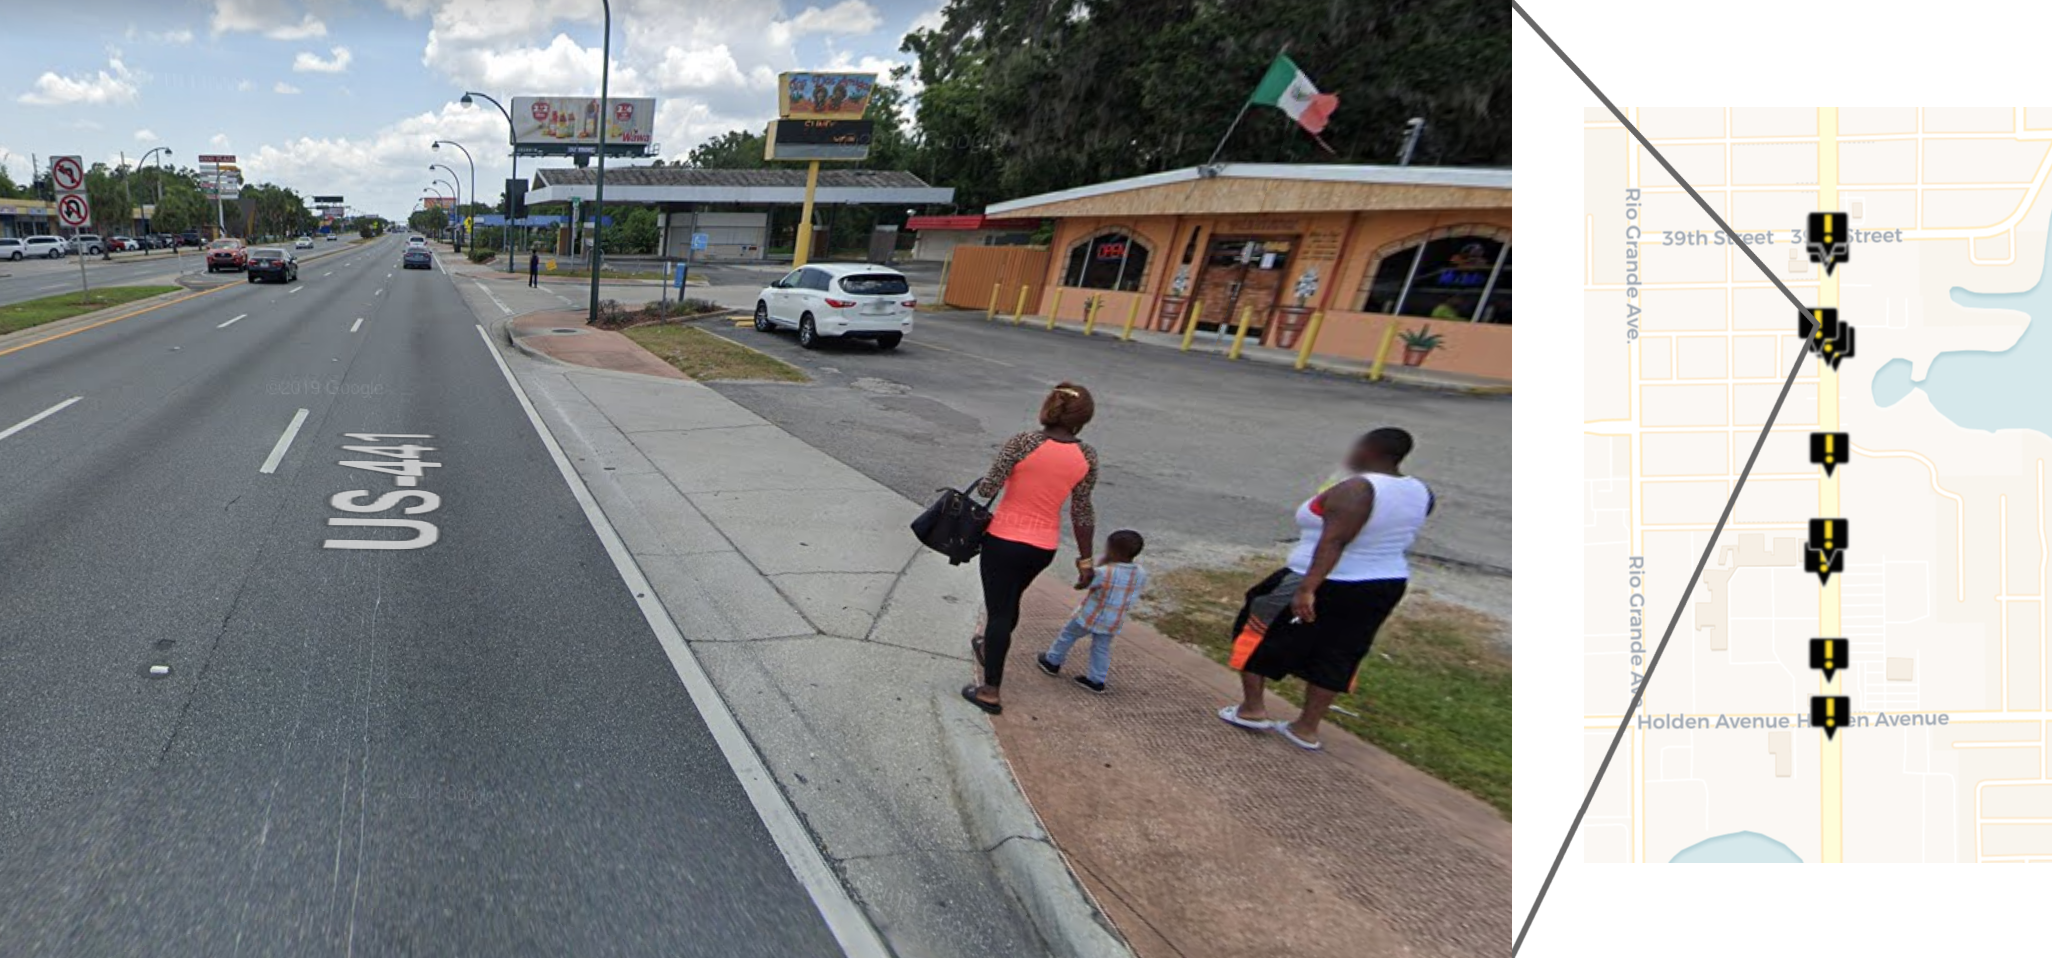
Raquel Nelson’s case made national news. But the loss she and her family experienced is replicated in nearly every city on wide “arterial” roads that encourage high speeds. In the City of Los Angeles, for example, 6 percent of streets are responsible for 65 percent of traffic deaths and injuries. When mapped, pedestrian deaths line up on these roads like dominoes.

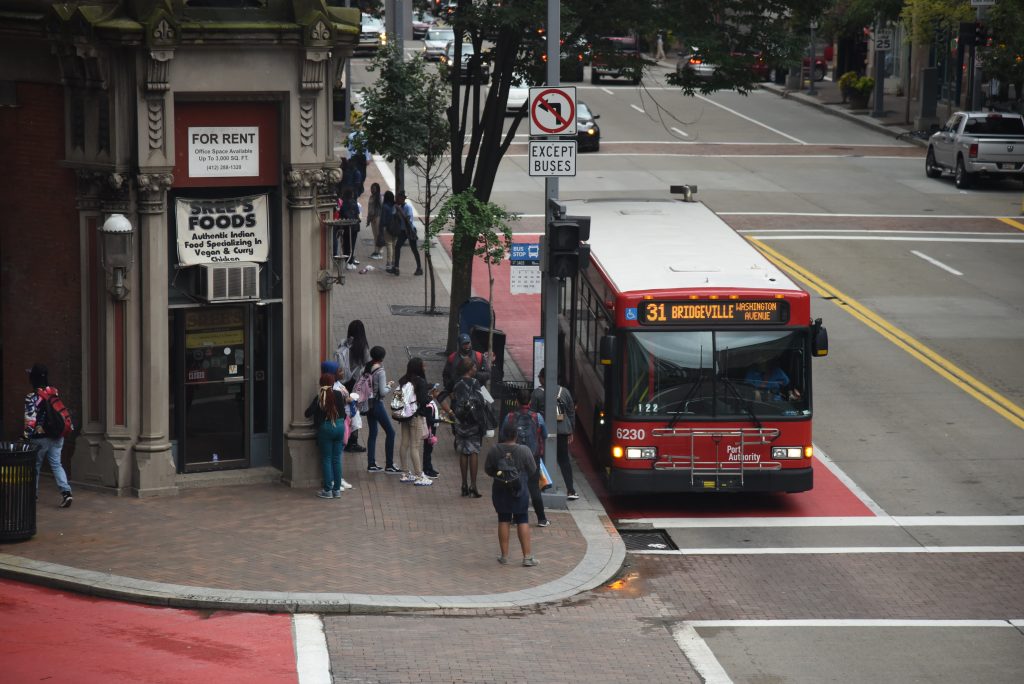
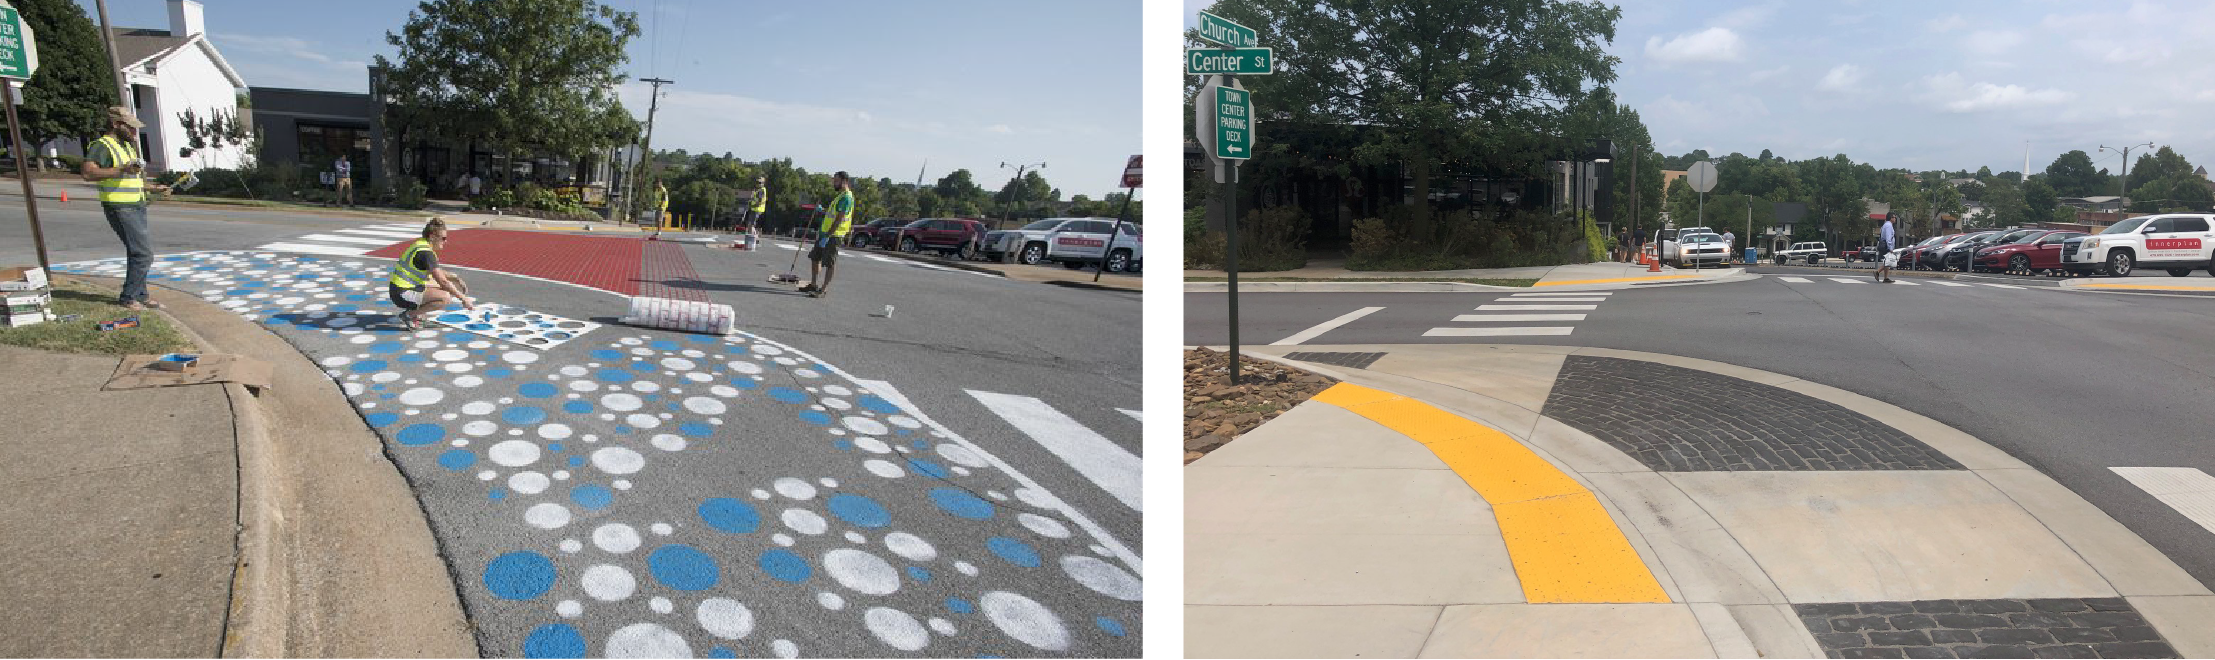
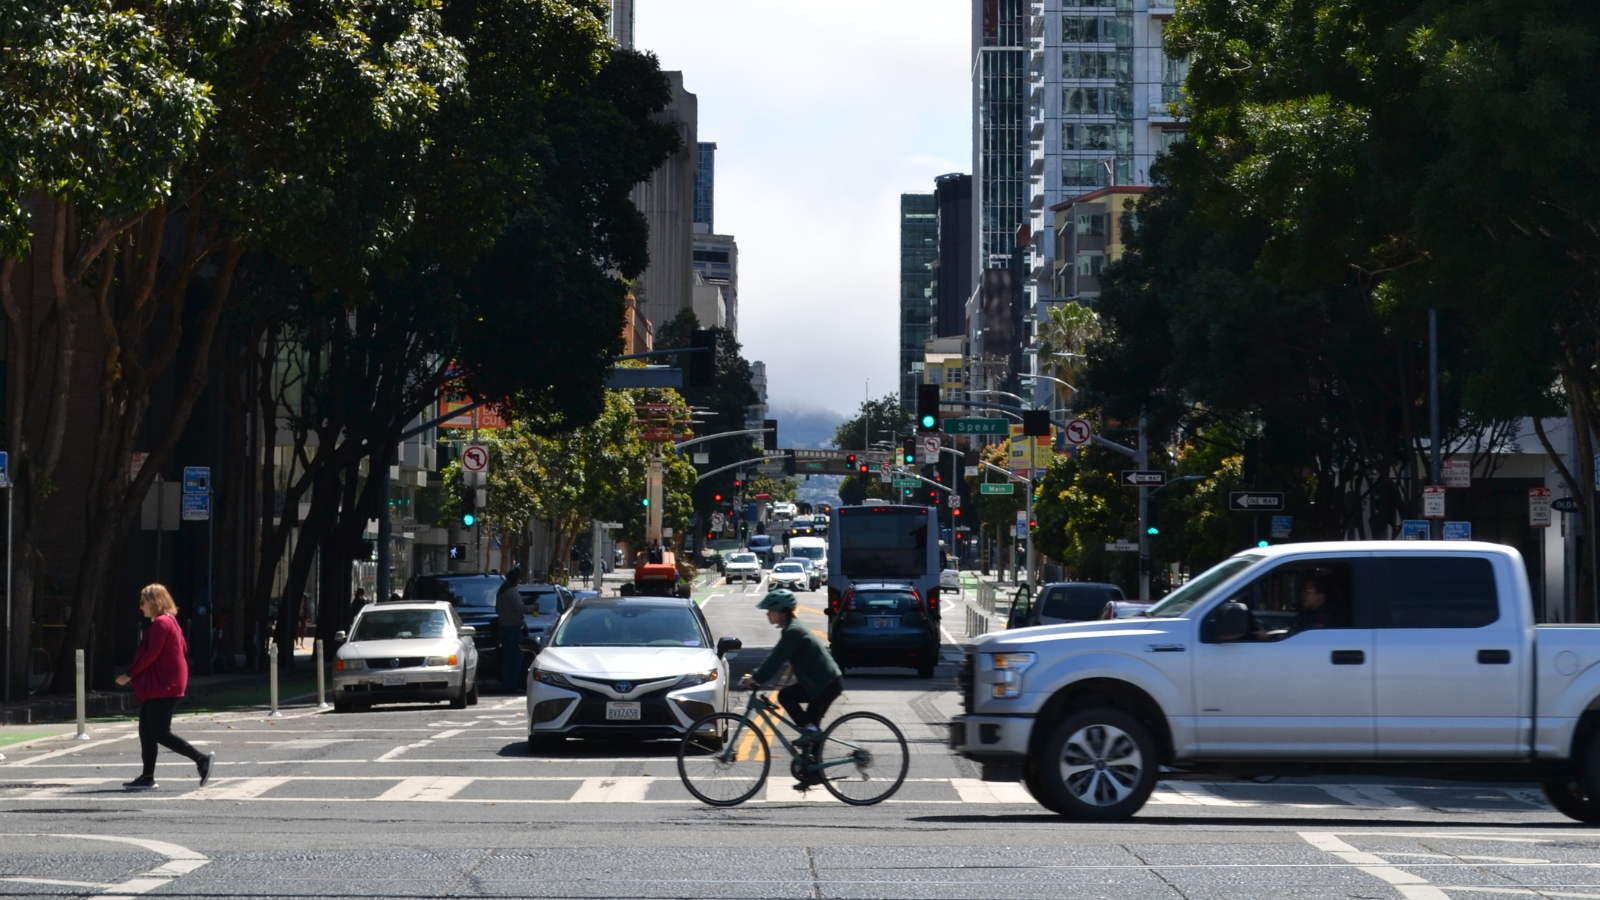
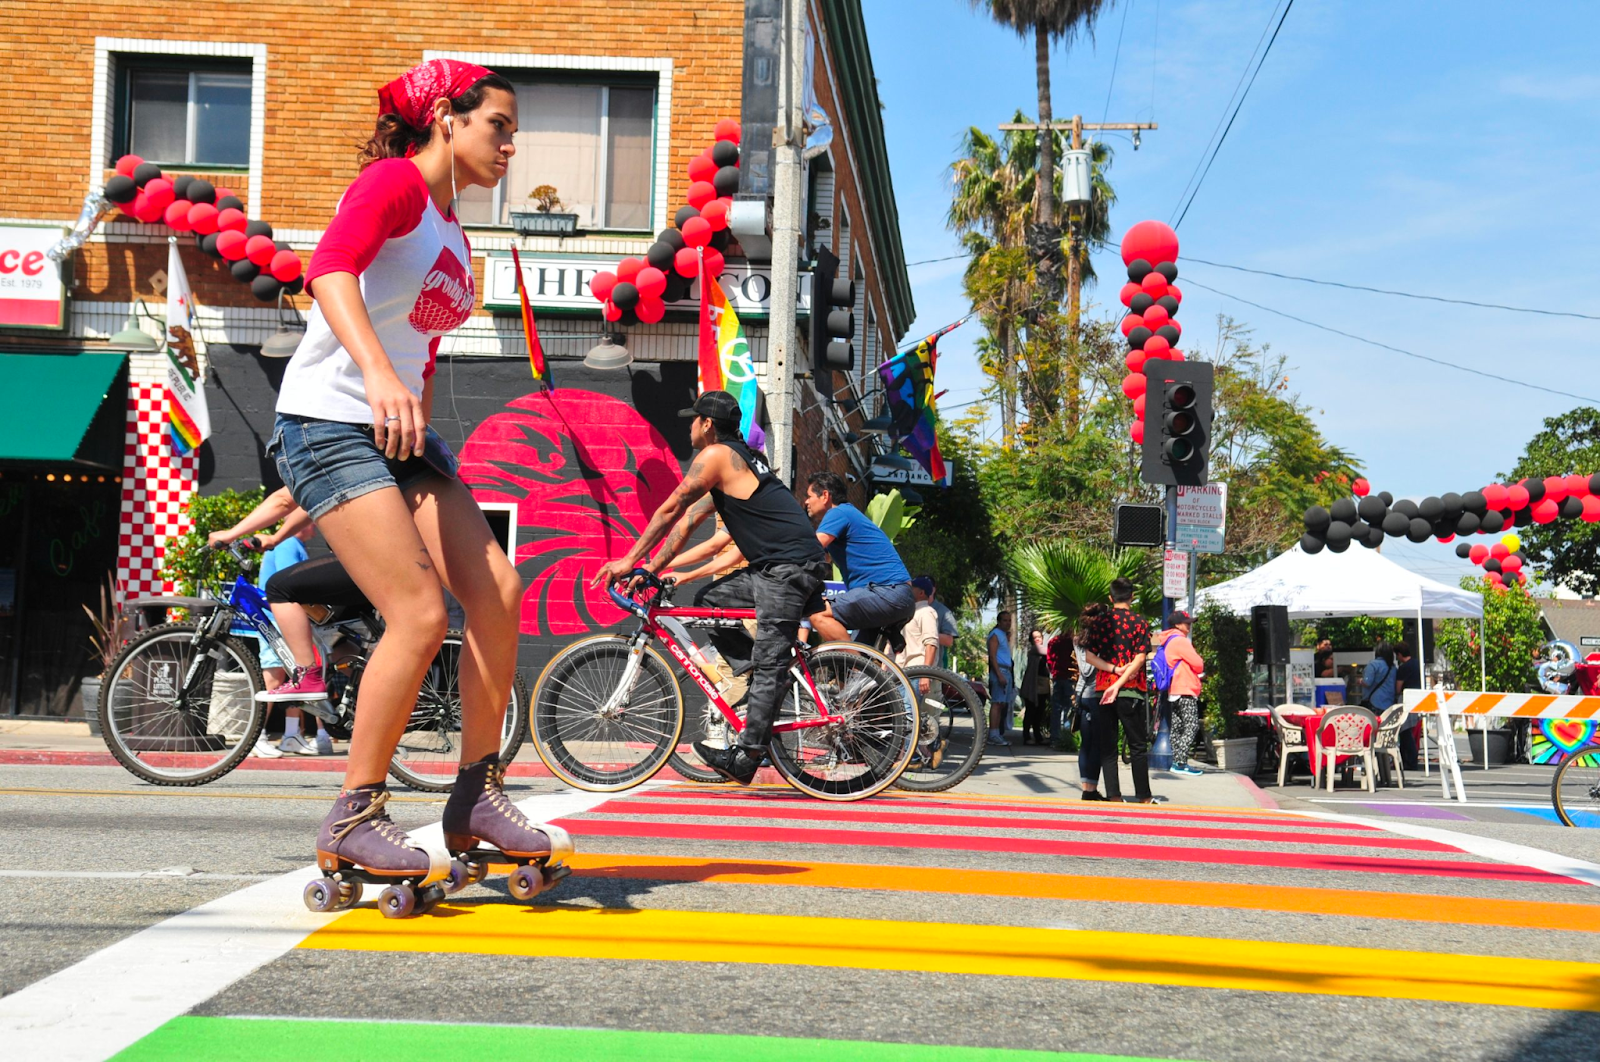
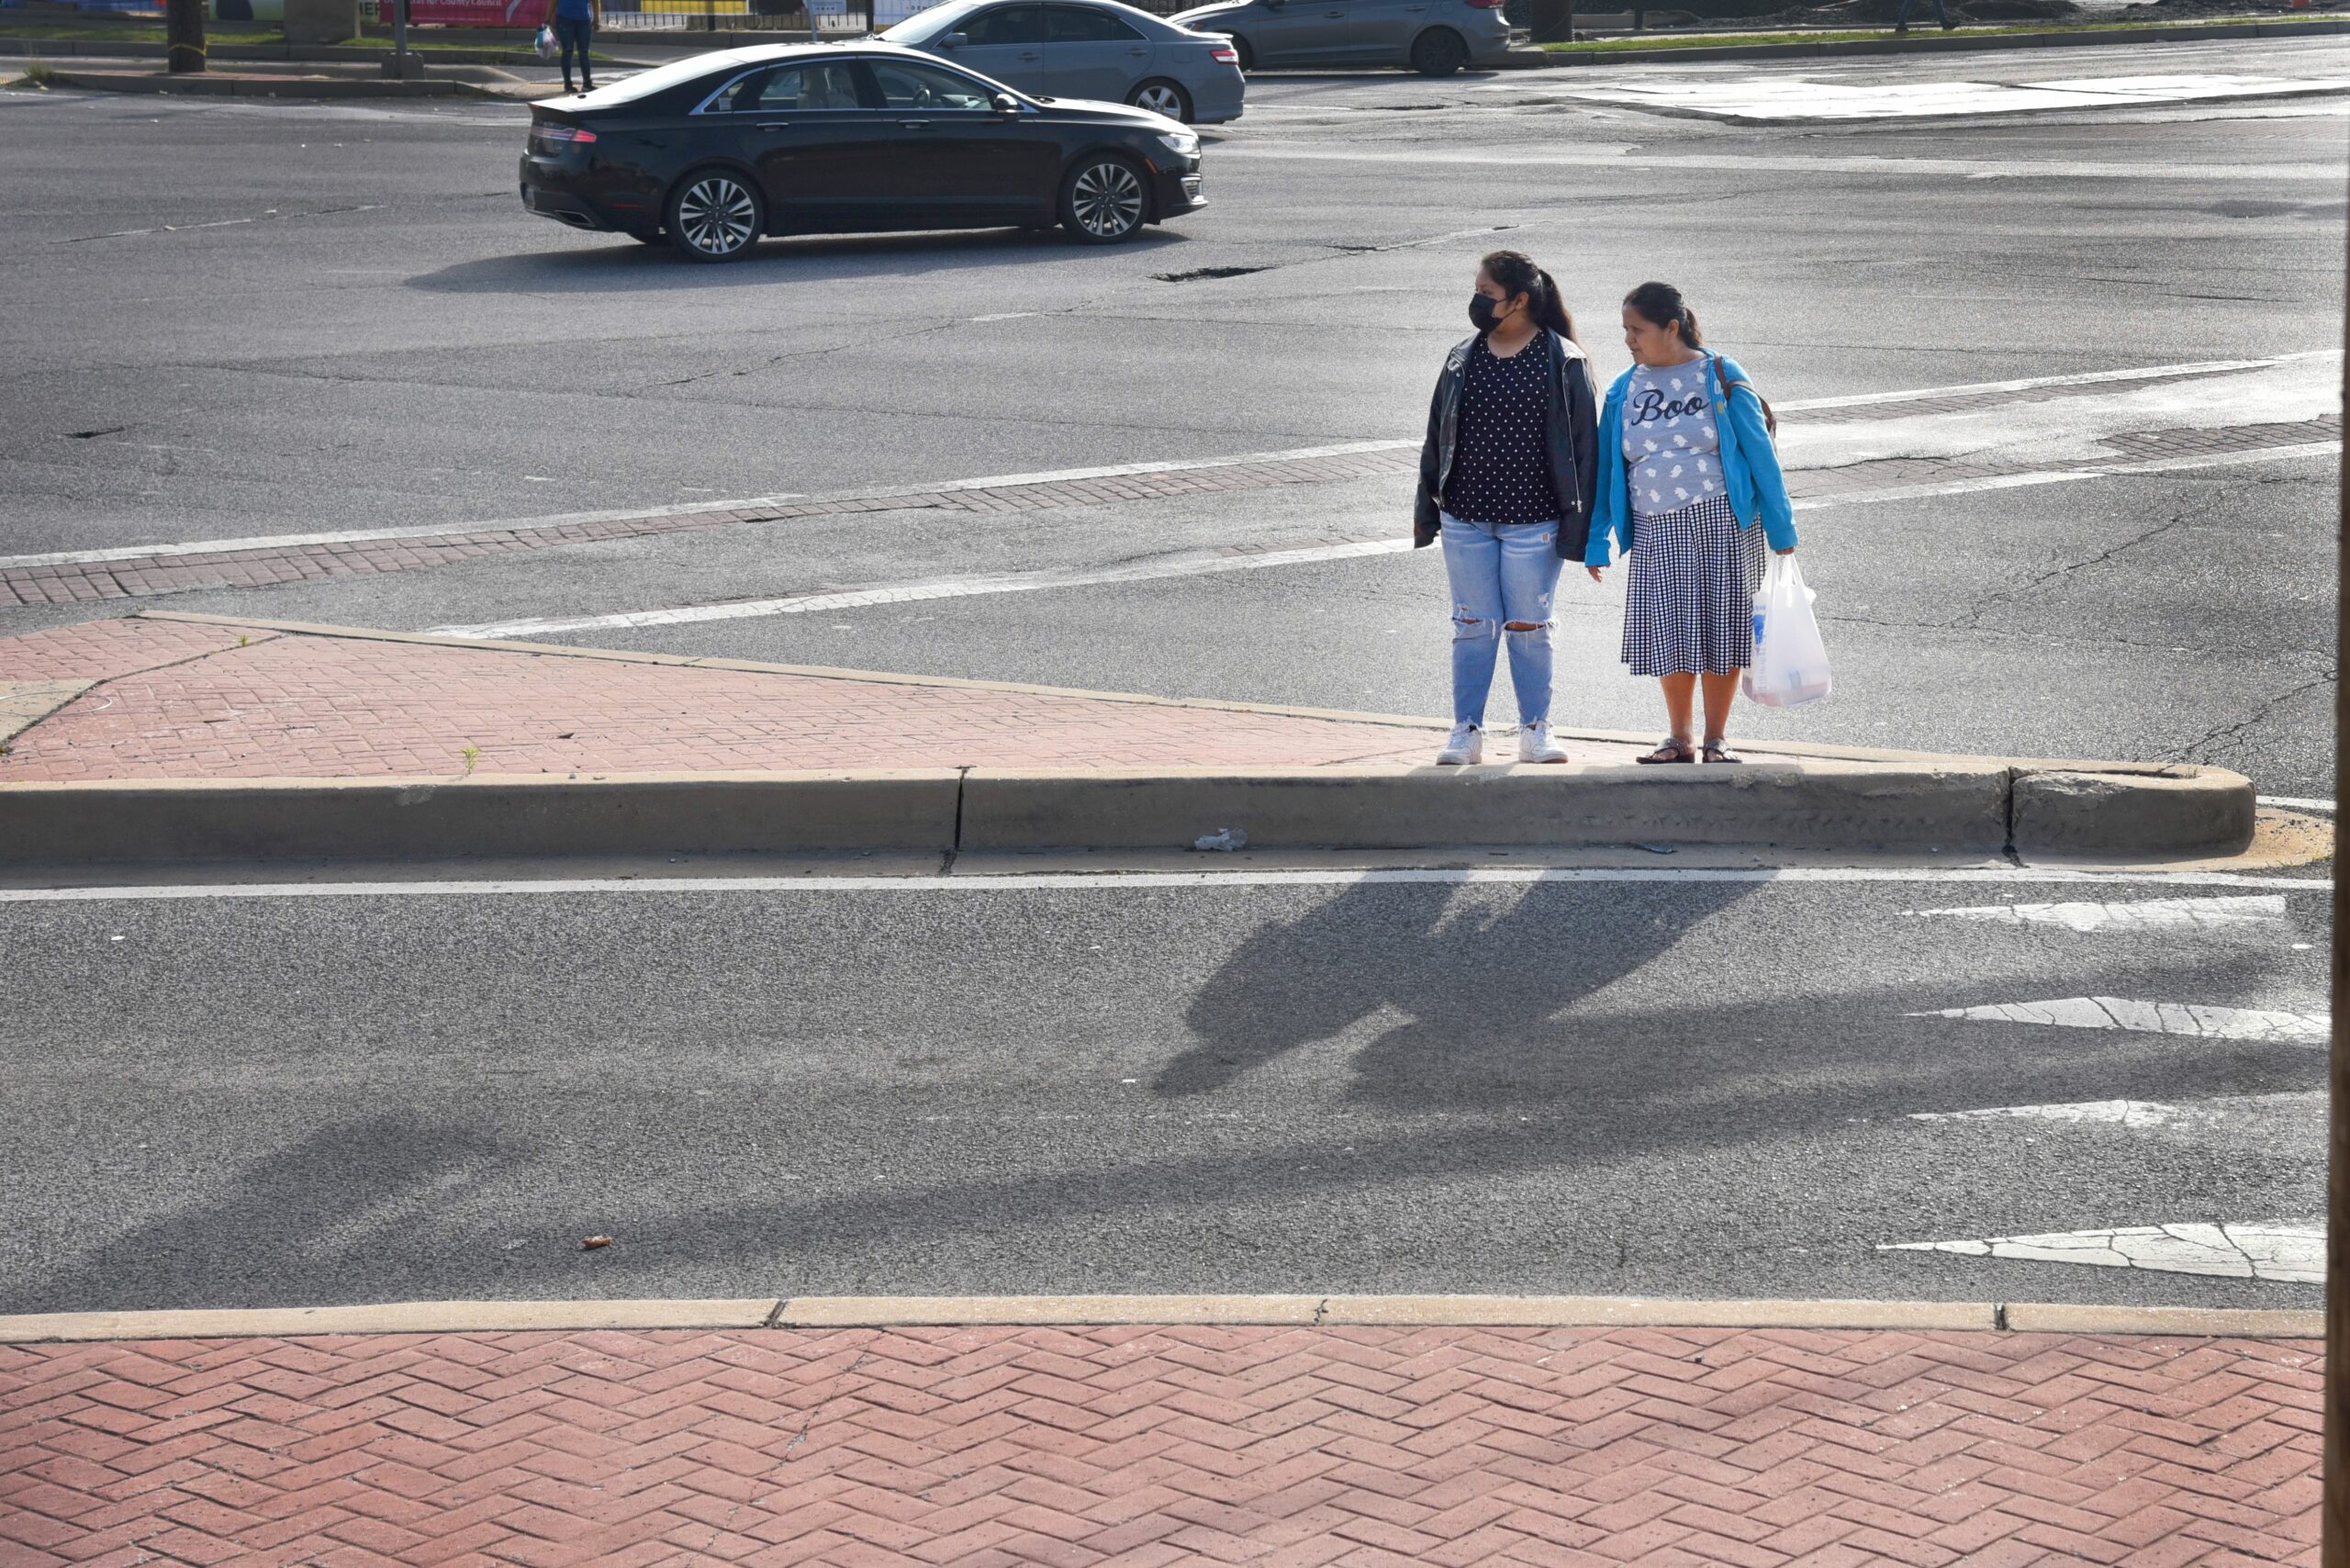
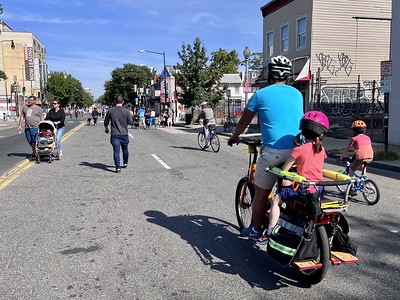
Because they tend to have important destinations on them, arterial roads also tend to carry the most bus riders. But the tie between transit and walkability goes beyond pedestrian safety. Nearly all transit riders are pedestrians at some point during their trip. In Los Angeles, for example, 84 percent of bus riders get to their bus stop on foot.

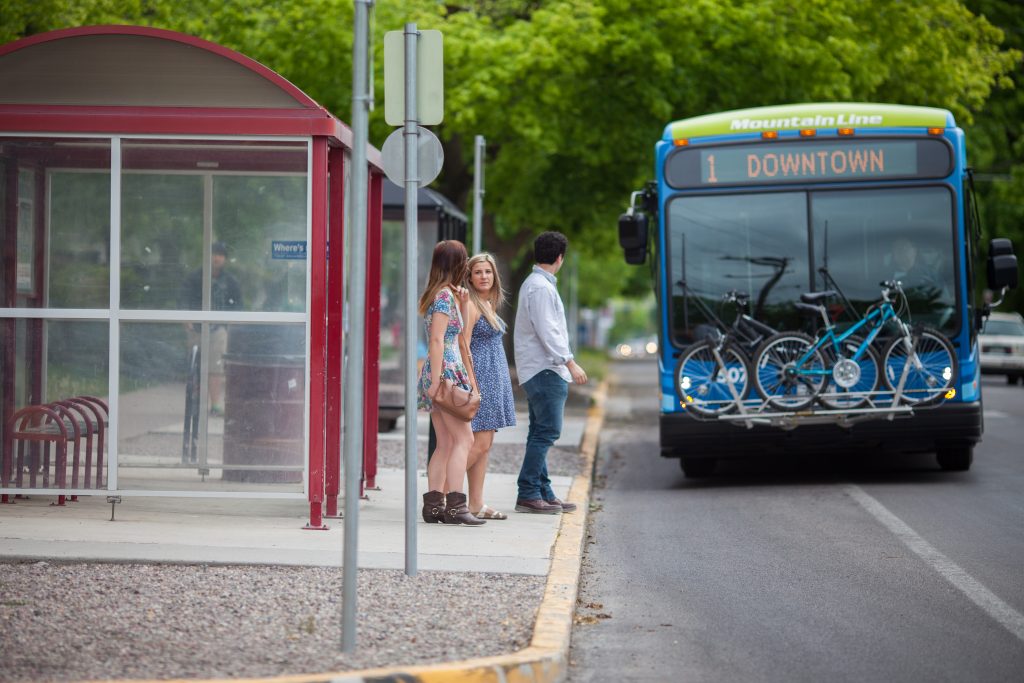
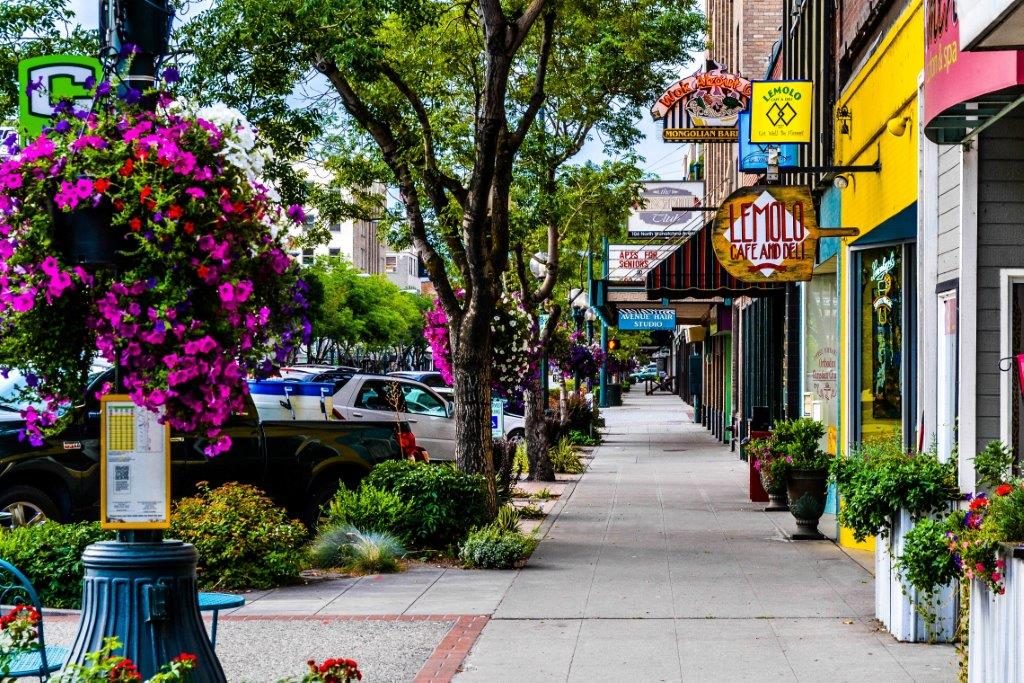
The pedestrian experience is the transit experience, then. A bus rider may appreciate frequent and fast service but still be dissatisfied with her trip if she has to trudge through mud on the way to the bus stop, cross the street with her head on a swivel, and wait in the rain with no shelter. Someone who uses a wheelchair may be unable to use the bus at all if there are no sidewalks leading to the stop.

Poor walkability is corrosive to bus ridership and makes it harder to improve transit service. In Staten Island, New York City, transit planners had to make major adjustments to a redesign of the borough’s express buses after riders complained that the changes forced them to walk in the street or on lawns.

Although Austin’s bus network redesign has generally been considered a success, it ran into the same problems. More than a month after the launch of the redesign, Capital Metro was still moving stop locations in response to complaints that people had to transfer in places without good walking infrastructure. “If you’re going to go to more of a grid-based system and you’re going to have more on-street connections, then you really need to look at the pedestrian experience of those intersections,” Capital Metro’s Todd Hemingson said. (As of April 2019, only about 60 percent of streets in Austin have sidewalks.)

Improving the walk to transit, on the other hand, can have measurable impacts on transit ridership. Ja Young Kim, Keith Bartholomew, and Reid Ewing of the University of Utah found that after the Utah Transit Authority built sidewalk connections to bus stops that lacked them, ridership at those stops grew almost twice as fast as at stops in similar neighborhoods that had not been improved. Demand for paratransit was also stemmed near the stops with sidewalk improvements, saving the agency on its budget.

Although walkability and transit can’t be separated, government usually makes its best effort to do so. Just as transit agencies must convince cities to give transit priority on the street, they must rely on local and state government to create a good walking environment. That’s no given.

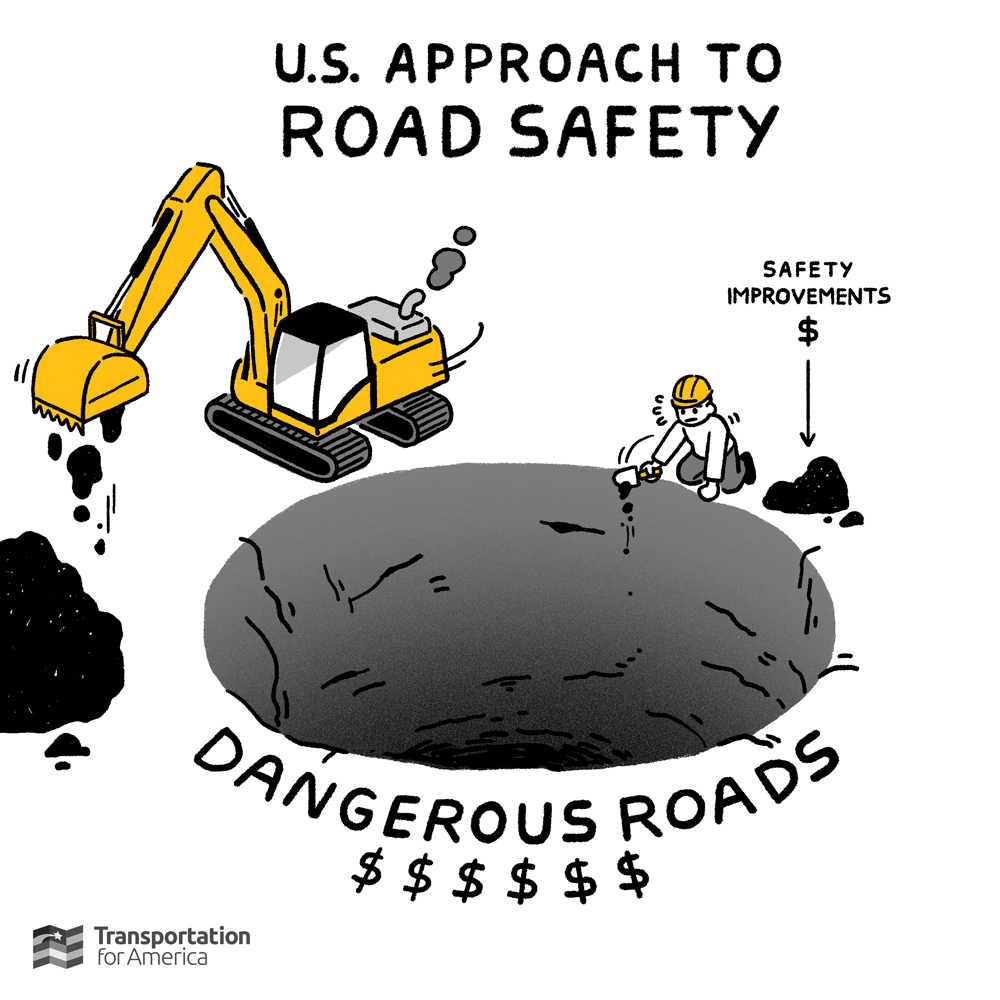
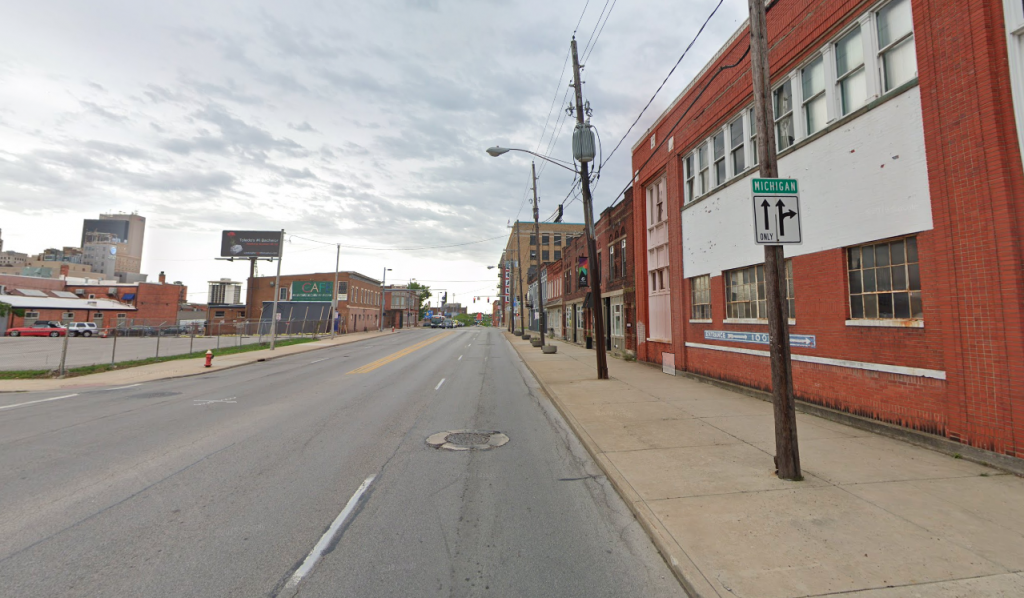
The state of walking in America represents an enormous collective failure. Even in urban neighborhoods where many people walk, engineering practices that favor drivers tend to degrade the experience. Intersections can be designed with slip lanes that allow cars to gun through turns. Zoning may allow curb cuts that turn the sidewalk into a gauntlet of traffic. The default rule at most intersections is “right turn on red,” intrinsically hostile to people walking because there’s never a time when they can be sure cars won’t turn into their path.

These decisions are rooted in a philosophy that prioritizes vehicle speeds and is often baked into engineering measures and practices. Engineers often assess streets using a metric called “automobile level of service,” where an A grade is free-flowing traffic. A major traffic engineering manual recommends against striping crosswalks unless at least ninety-three pedestrians already cross the intersection per hour—or if five people were hit by cars at the intersection in the past year. Peter Furth, an engineering professor at Northeastern University, has pointed out that “Synchro, the standard software [traffic engineers] use, is based on minimizing auto delay, and it doesn’t even calculate pedestrian delay.”

Although most streets are municipally maintained, most cities require local property owners to maintain sidewalks abutting their property. This means that wealthier neighborhoods tend to have better maintained and safer sidewalks. The further you get from downtown, the more likely it is that sidewalks themselves will shrink, decay, or vanish. Property owners may not be required to build sidewalks at all, which means many cities simply lack sidewalks in a huge portion of their territory.

Fighting for People on Foot

Pedestrian infrastructure doesn’t cost much relative to other transportation infrastructure. Houston’s $83 million in backlogged sidewalk requests could mostly be wiped out by nixing a $70 million project to add an interchange on an area toll road. Even the $1.4 billion price tag to build functional sidewalk on every Denver street doesn’t look so daunting when the Colorado Department of Transportation is spending $1.2 billion in just 4 years to widen Interstate 70, which runs northeast of downtown Denver.

Shelters aren’t particularly expensive either, costing roughly between $5,500 and $12,000 each. In 2017, medium and large transit agencies spent $297 million on infrastructure at bus stops and stations, compared with $2.2 billion on rail stations—or about 6 cents per bus trip and 47 cents per rail trip.

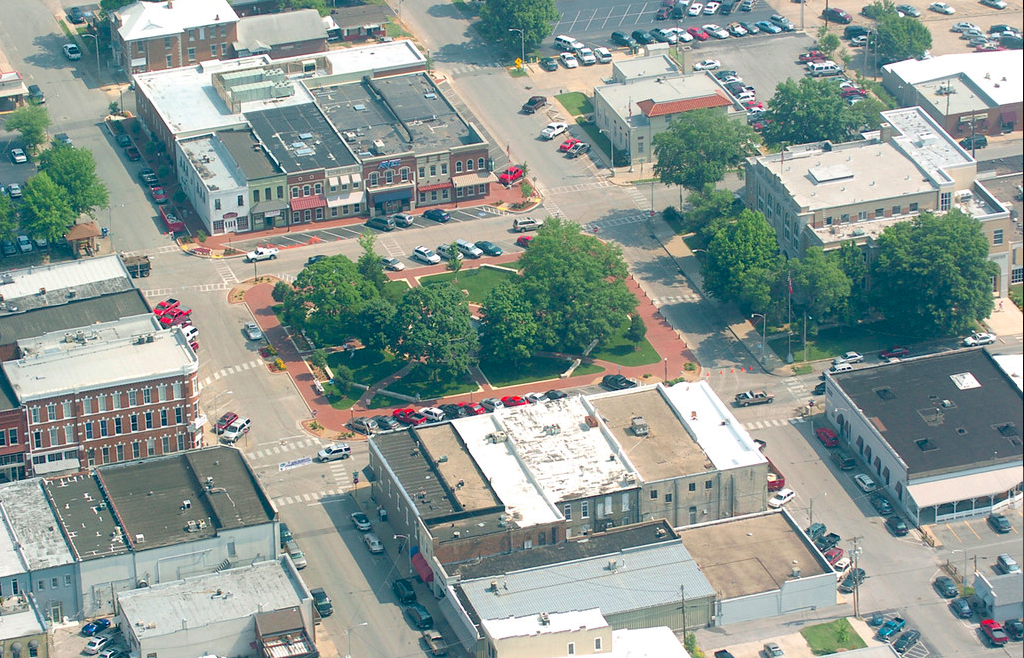
Creating walkable places requires changing municipal processes so that compact planning (creating neighborhoods where there are many destinations worth walking to) and pedestrian-friendly street design become routine.

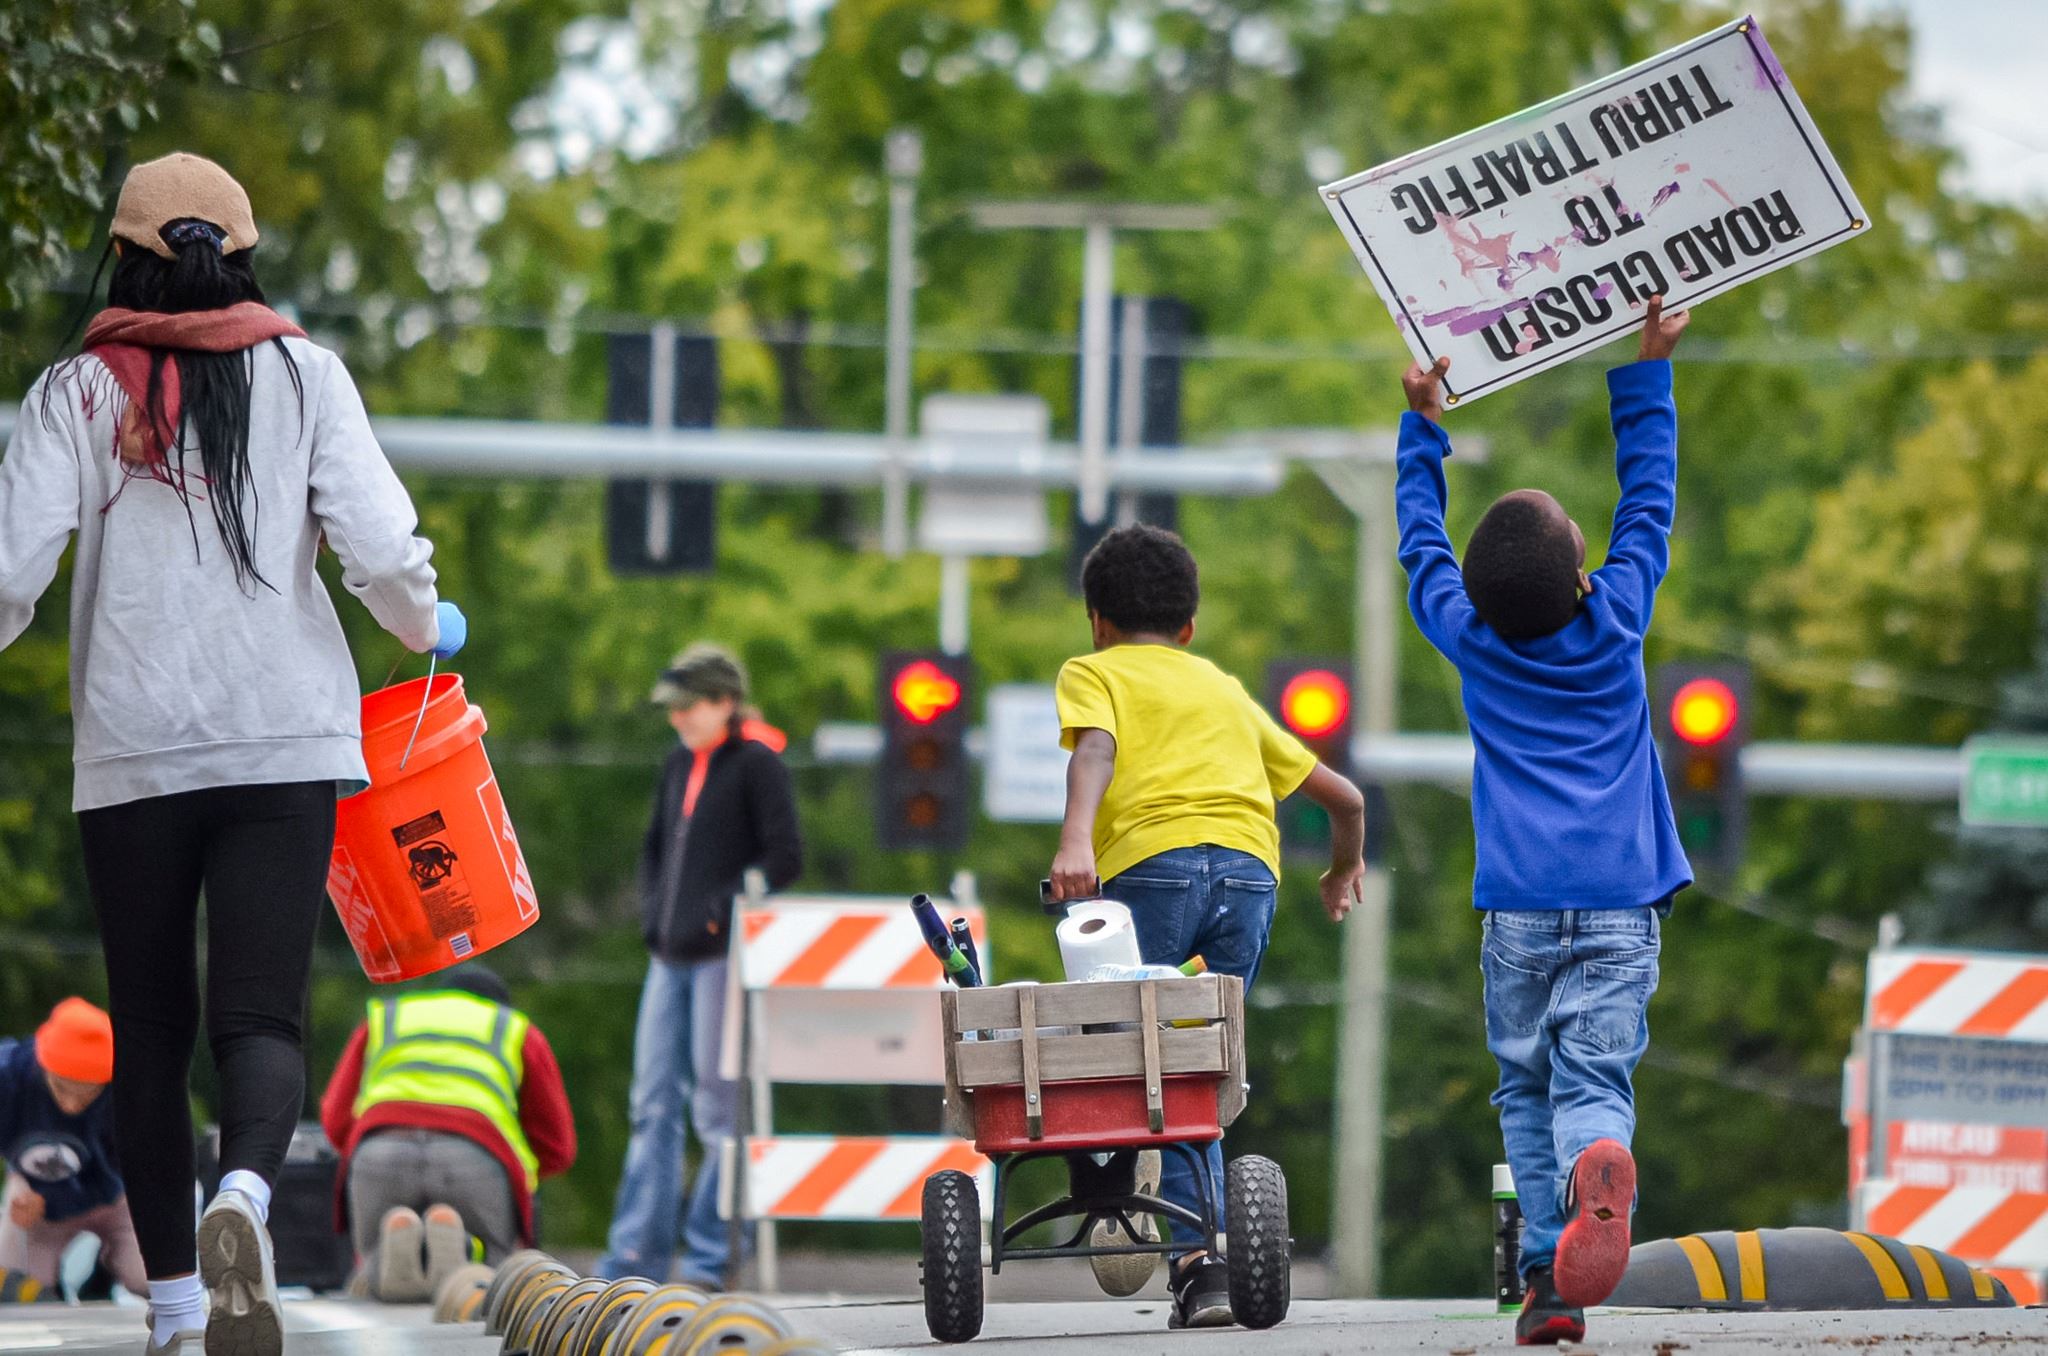
This often starts with outside advocacy and political action.

The do-it-yourself movements I mentioned earlier in this chapter ultimately seek not to supplant government but to prod it to action. A year after MARTA Army launched its “adopt-a-stop” campaign, the state of Georgia awarded the Atlanta Regional Commission $3.8 million for bus stop signs, shelters, and sidewalks. Cincinnati’s Better Bus Coalition doesn’t just build benches; it has also published an analysis showing that shelters are disproportionately in wealthy neighborhoods. Streetsblog USA runs an annual “Sorriest Bus Stop in America” contest that has gotten governments in Kansas City, Maryland, and Boston to address bus stop walkability.

In Nashville, a long-time neighborhood activist, Angie Henderson, was elected to the city’s Metropolitan Council on a platform of walkable neighborhoods in 2015. Henderson later sponsored and passed a law requiring most developments in inner-city neighborhoods and near commercial centers to include sidewalks or pay into a citywide sidewalk fund. Denver’s City Council created a $4 million fund to help lower-income homeowners fix the sidewalks in front of their houses and budgeted for three new Public Works employees to manage the program and step up enforcement of sidewalk regulations throughout the city. And Seattle’s Department of Transportation has broken with the engineering guideline that says crosswalks should be striped only where many people already cross or where there are frequent pedestrian crashes.

Within transit agencies themselves, it’s important to raise the profile of the walk and the wait. Metro Transit’s Better Bus Stops Program is a great example. The decision to elevate a routine process into a branded program gave bus stops new stature throughout the agency.

“[The process of siting bus shelters] could be thought of as very dull and unimportant,” Farrington said. “But to package it, to get a great little logo and have it be a substantial program with its own name and people, it’s been a positive spiral of more resources and more support of the work.” She said that staff who had previously worked on park-and-ride stations were now spending more time on bus stops. True, in some ways the program was an outlier, funded by an Obama-era discretionary program, Ladders of Opportunity, that no longer exists. But transit agencies could replicate it using funding from many other sources.

Metro Transit’s program also offers a clear example of how well-resourced, well-planned public engagement can strengthen and educate both the transit agency and the communities it operates in.


Thanks again to Steven Higashide and Island Press for allowing us to run this excerpt. You can buy his book direct from Island Press or find links to purchase at other various outlets there. -Ed

Safety over speed week: Drive like your kid business lives here

Economic slowdowns are generally a bad thing. But slowing down might be good for the economy, so long as we’re slowing vehicle speeds. Streets designed to accommodate (slow) drivers, people walking and biking, and transit riders are better for businesses, save money on health care costs, and can help businesses attract and retain talent.

It’s “safety over speed” week here at T4America, and we are spending the week unpacking our second of three principles for transportation investment. Read more about these principles and if you’re new to T4America, you can sign up for email here. Follow along on @T4America this week and check back here for more related content all week long.

Imagine a vibrant commercial corridor, with people window shopping, eating at a sidewalk cafe, or chatting in a plaza. Perhaps there are cars parallel parked under trees planted next to the wide sidewalk. Some are locking up their bikes while others are waiting at a clearly marked bus stop. Cars are traveling slowly and crosswalks are frequent. 

Now imagine that place where the slow traffic is replaced by high-speed vehicles on the nearby roadway. The sidewalks no longer feel like a place to stroll and window shop and outdoor seating is unpleasant—the people have disappeared because it feels unsafe. The sidewalk might be narrowed and trees removed to accommodate more lanes to move more cars quickly past the once vibrant corridor. The people may be gone, but the businesses are still there and struggling to hang on. 

In America today, we are much more likely to build the second lifeless street that prioritizes speed than we are to build the first vibrant street that prioritizes safety.

Our transportation policies are designed primarily to move vehicles as quick as possible while ignoring other users. Instead of sidewalk cafes and cyclists locking their bikes, the street is empty. Instead of parking and shopping, motorists speed through, on their way to somewhere else. Public transit riders have disappeared too, as this is no longer a destination, it is a place to drive-through. 5

Our focus on keeping cars moving above all else harms local economies. Study after study has shown that business sales at worst stay the same but often increase when we redesign streets to lower speeds and safely accommodate people walking and on bikes. Getting more people (i.e potential shoppers) on the street is key.

Streets with slower speeds are more inviting for everyone, including people walking, biking, and taking public transit, creating the crowds which spend and invest in the corridor. Streets with slower speeds enable environments where people will spend time and linger, creating a sense of civic community, a sense of place. Streets like this are the basic building block of creating and capturing long-term value. And most cities and towns, whatever their size, would never survive without having these incredibly financially productive corridors.


Downtown Erwin, TN photo by Brian Stansberry. Licensed with Creative Commons 3.0

Healthy streets are good for business

Beyond these direct economic impacts of safer streets, making it safer for people to walk or bike can improve community health and reduce medical costs, freeing up public and private dollars to be invested in other ways.

A 2010 report from the National Highway Traffic Safety Administration (NHTSA) found that bicycle and pedestrian crashes caused “$16 billion in economic costs and $87 billion in comprehensive costs, accounting for 7 percent of all economic costs, and 10 percent of all societal harm (measured as comprehensive costs).” Imagine all that money, which could otherwise be spent in local communities. 

Making your downtown a safer place to walk is a key component of economic competitiveness in today’s economy. Research indicates that companies of all sizes are increasingly relocating to walkable and transit-accessible downtowns because that’s where talented workers want to be. Amazon’s recent search for a second headquarters—where access to transit was a core requirement—is just one example of this larger trend. We wrote about State Farm’s similar move to consolidate dozens of offices in just a few transit-connected, walkable locations a few years back.

Congress urgently needs to decide whether or not to prioritize safety over speed with the billions in transportation dollars they give to states and metro areas each year, but fortunately, we do not have to choose between safer streets and our economy. We just have to choose safe streets.