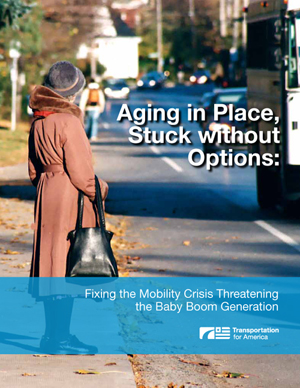
By 2015, more than 15.5 million Americans 65 and older will live in communities where public transportation service is poor or non-existent. That number is expected to continue to grow rapidly as the baby boom generation “ages in place” in suburbs and exurbs with few mobility options for those who do not drive.
 |
| • Download the report (pdf) • Read the press release |
Aging in Place, Stuck without Options ranks metro areas by the percentage of seniors with poor access to public transportation, now and in the coming years, and presents other data on aging and transportation.
The analysis by the Center for Neighborhood Technology evaluates metro areas within each of five size categories. It shows that in just four years, 90 percent of seniors in metro Atlanta will live in neighborhoods with poor access to options other than driving, the worst ranking among metro areas with populations over 3 million. In that size category, metro Atlanta is followed by the Riverside-San Bernardino, CA metro area, along with Houston, Detroit and Dallas. Kansas City tops the list for metros of 1-3 million, followed by Oklahoma City, Fort Worth, Nashville and Raleigh-Durham.
The transportation issues of an aging America are national in scope, and cash-strapped state and local governments will be looking for federal support in meeting their needs. As Congress prepares this summer to adopt a new, long-term transportation authorization, this report outlines policies to help ensure that older Americans can remain mobile, active and independent.
Metropolitan Rankings by Percentage of Seniors Age 65-79 with Poor Transit Access in 2015*
| Rank | Metro | Percentage of Seniors (65-79) with poor transit access in 2015 |
| NEW YORK METROPOLITAN AREA | ||
| 1 | New York, NY | 41 |
| METROPOLITAN AREAS 3 MILLION AND OVER | ||
| 1 | Atlanta, GA | 90 |
| 2 | Riverside-San Bernardino, CA | 69 |
| 3 | Houston, TX | 68 |
| 4 | Detroit, MI | 68 |
| 5 | Dallas, TX | 66 |
| METROPOLITAN AREAS 1-3 MILLION | ||
| 1 | Kansas City, MO-KS | 88 |
| 2 | Oklahoma City, OK | 86 |
| 3 | Fort Worth-Arlington, TX | 85 |
| 4 | Nashville, TN | 85 |
| 5 | Raleigh-Durham-Chapel Hill, NC | 80 |
| METROPOLITAN AREAS 250,000-1 MILLION | ||
| 1 | Hamilton-Middletown, OH | 100 |
| 2 | Montgomery, AL | 99 |
| 3 | Hickory-Morganton, NC | 95 |
| 4 | Augusta-Aiken, GA-SC | 90 |
| 5 | Fort Pierce-Port St. Lucie, FL | 89 |
| METROPOLITAN AREAS LESS THAN 250,000** | ||
| 1 | Waterbury, CT | 90 |
| 2 | Greenville, NC | 87 |
| 3 | Houma, LA | 87 |
| 4 | Merced, CA | 86 |
| 5 | Jacksonville, NC | 85 |
* Rankings are based on an analysis conducted by the Center for Neighborhood Technology (CNT). Poor transit access was determined using the Transit Access Index (TAI).
** Kenosha, WI did not provide transit data for its bus service and was therefore excluded from the top five.


