
Beyond the pump: Evaluating fresh approaches to transportation funding

An empty gas station with rows of abandoned power blue pumps glowing with neon lights in the middle of the night

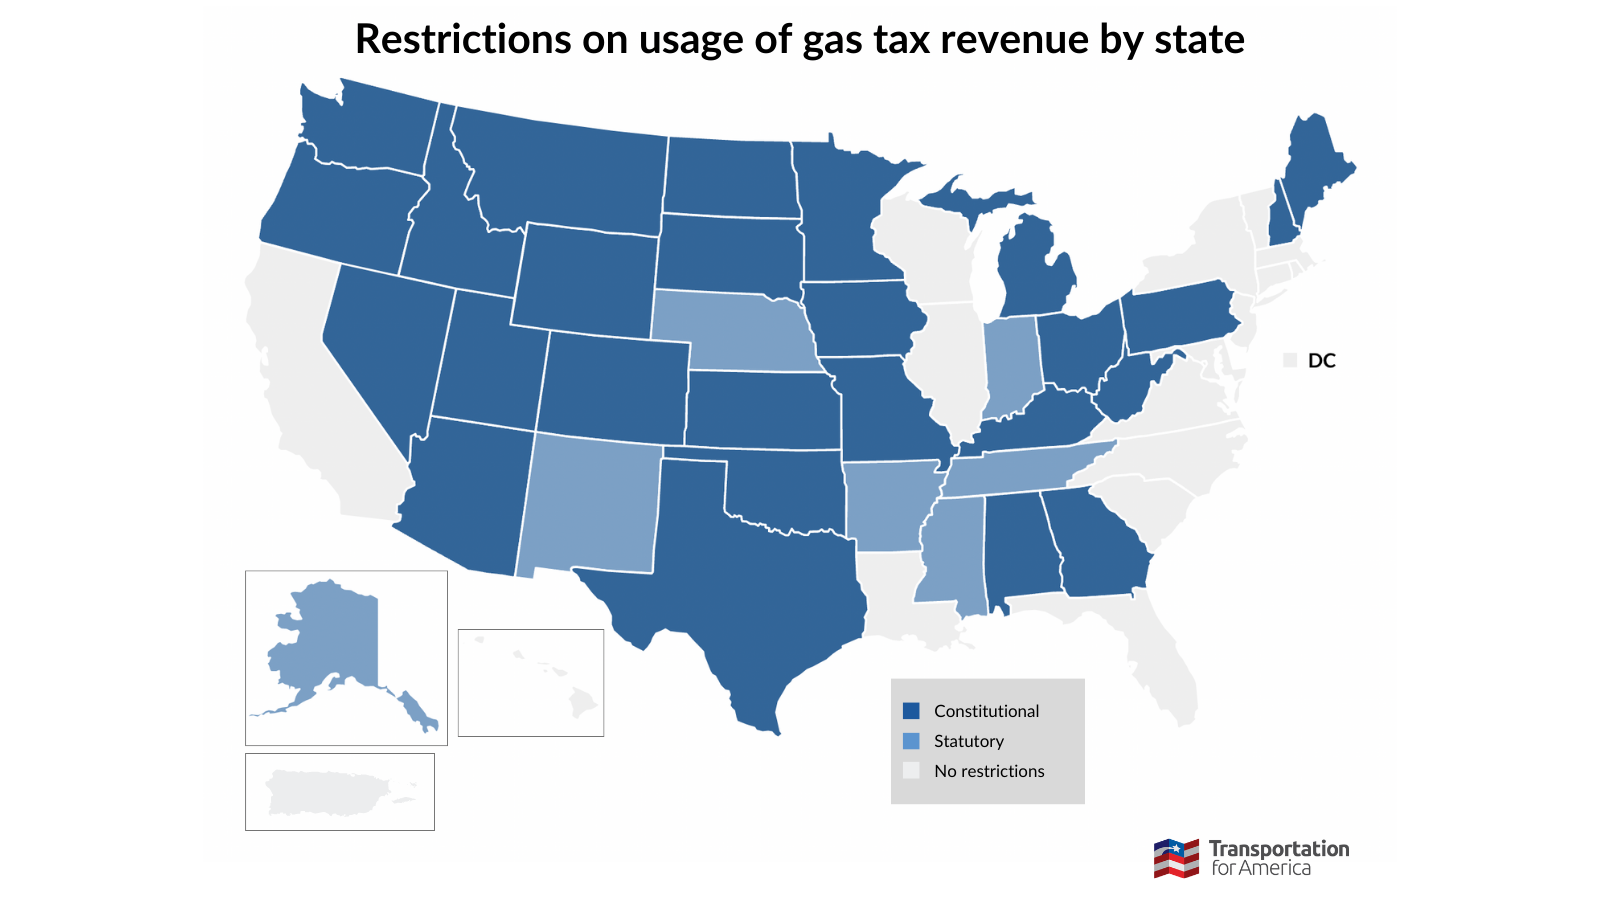
Current state gasoline taxes aren’t enough to cover our transportation funding needs. Evaluating alternatives needs to involve taking five key principles into account. Read our policy evaluation framework, created by T4A Policy Associate Stephen Coleman Kenny with support from T4A Policy Director Benito Pérez, NRDC Senior Transportation Advocate Zak Accuardi, and T4A Policy Intern Julia Camacho.

An empty gas station with rows of abandoned power blue pumps glowing with neon lights in the middle of the night

Our transportation systems are largely funded by motor fuel taxes that finance the federal Highway Trust Fund. Since the 1980s, these funds have been allocated using a roughly 80/20 split between highway and transit spending under the assumption that drivers were paying a larger share and deserved to receive more investments in return. However, after a crisis in 2008 when the national fund ran out of money—requiring billions of dollars in bailouts ever since—this system has proven to be outdated and unstable.

Why the gas tax status quo needs to change

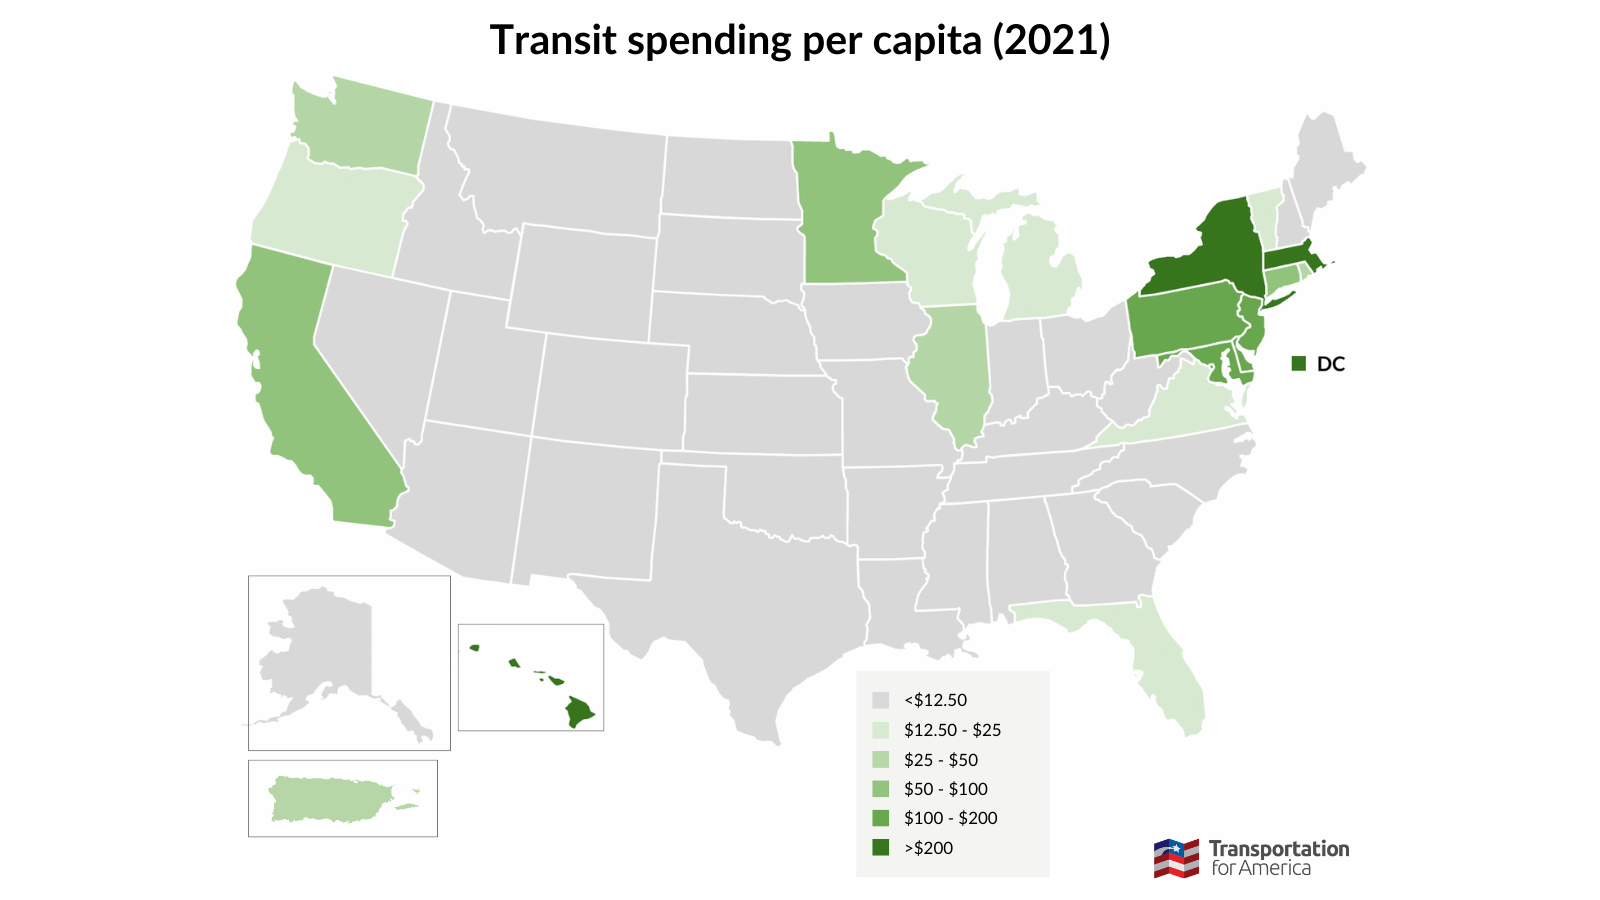
In 2008, the National Surface Transportation Infrastructure Financing Commission wrote that the United States has an “ever-expanding backlog of investment needs” that then-current transportation funding policies would only cover one third of. As of 2016, public transit systems have faced a backlog of over $105 billion for maintenance and replacement costs.

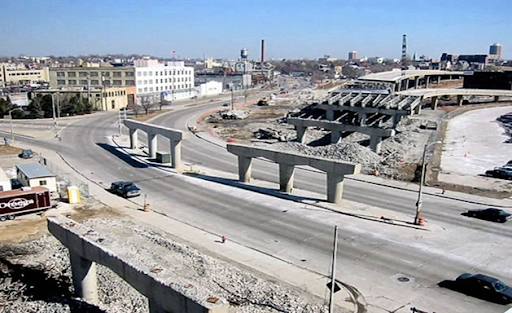
Today, this problem is only worsening. America’s reliance on gasoline taxes in order to fund roads and transit systems is proving to be unsustainable. As vehicles become increasingly efficient and electric vehicles (EVs) become more commonplace, overall levels of fuel consumption are decreasing—thus lowering gas tax revenues and further widening the infrastructure funding gap. Without a change in our revenue-raising systems, our roads and transit infrastructure will crumble. It’s critical we act now. 

As policymakers explore potential alternatives to the gas tax, a variety of options have emerged, including the following: 

  • Road pricing, or taxing by vehicle miles traveled (VMT)
  • Adding new tolls
  • Congestion pricing
  • Flat vehicle registration fees
  • Indexing the gas tax to inflation
  • Taxes on external costs of driving like emissions and accidents
  • General revenue subsidies
  • Duties on fuel sales

Many of these proposals are not new—for instance, T4A wrote about raising the gas tax or indexing it to construction fees back in 2014. But save for some VMT-based road pricing pilot programs in Oregon, Virginia, and most recently Utah, little progress has been made.

Choosing the right option

There are a variety of possibilities, but no one option fits every regional context. Rather, the process of evaluation has to be sensitive to the goals and priorities of state and federal transportation programs. With that in mind, there are five main needs that new proposals will need to address, which we compiled into a policy evaluation framework:

  • Outcomes: How the funding scheme changes road user behavior by incentivizing one of the following outcomes: electrification (EV adoption), mode shift away from personal vehicles, or maintaining the status quo.
  • Fairness: Ensuring that the funding scheme is fair to all users by having road users (including drivers of internal combustion engine (ICE) cars and EVs alike) pay user fees in accordance with the wear and tear they impose on the road system.
  • Stability: Estimating the revenue projections of the proposed system and whether or not it raises enough money to maintain the transportation system in both the short and long term.
  • Equity: Examining how the structure of the funding scheme impacts different socioeconomic groups, and how the benefits and burdens are distributed. 
  • Feasibility: Considering the administrative costs, jurisdictional issues, technology for implementation, political popularity, and public support for the proposal. 

There are tradeoffs between these goals, but looking at the possible alternatives to the gas tax through these five lenses provides a starting point for choosing a new policy. Find examples of our policy evaluation framework in action here.

Taking a closer look at a VMT tax and its implementation in Oregon

Among the options mentioned above, road pricing, or a tax on VMT, has emerged as a popular frontrunner among policymakers and thought leaders. A VMT tax would impact ICE cars and EVs equally, would include usage of all roads—not just interstates or toll roads—and would result in a precise user charge, especially if adjusted for vehicle weight, that drivers pay based on their wear and tear on the road system.  However, the shortcomings of a VMT tax lie in the other four aspects—equity, outcomes, feasibility, and revenue stability. 

A VMT tax would be regressive, penalizing people who need to drive the furthest—in other words, rural households and those who live farther from city centers—and already have to pay high transportation costs as a result. Additionally, a VMT tax only incentivizes mode shift for that same group of people, who are the most likely to not be able to shift away from driving due to a lack of transportation alternatives.

Furthermore, a simple VMT tax doesn’t incentivize EV adoption over ICE cars or even just more efficient vehicles over heavier ones that use more fuel, since all vehicles are treated the same. With regards to feasibility, VMT taxes have faced technology challenges, high administrative costs, and public opposition. And in terms of revenue stability, a VMT tax is sufficient only if we maintain high levels of driving in the long term.

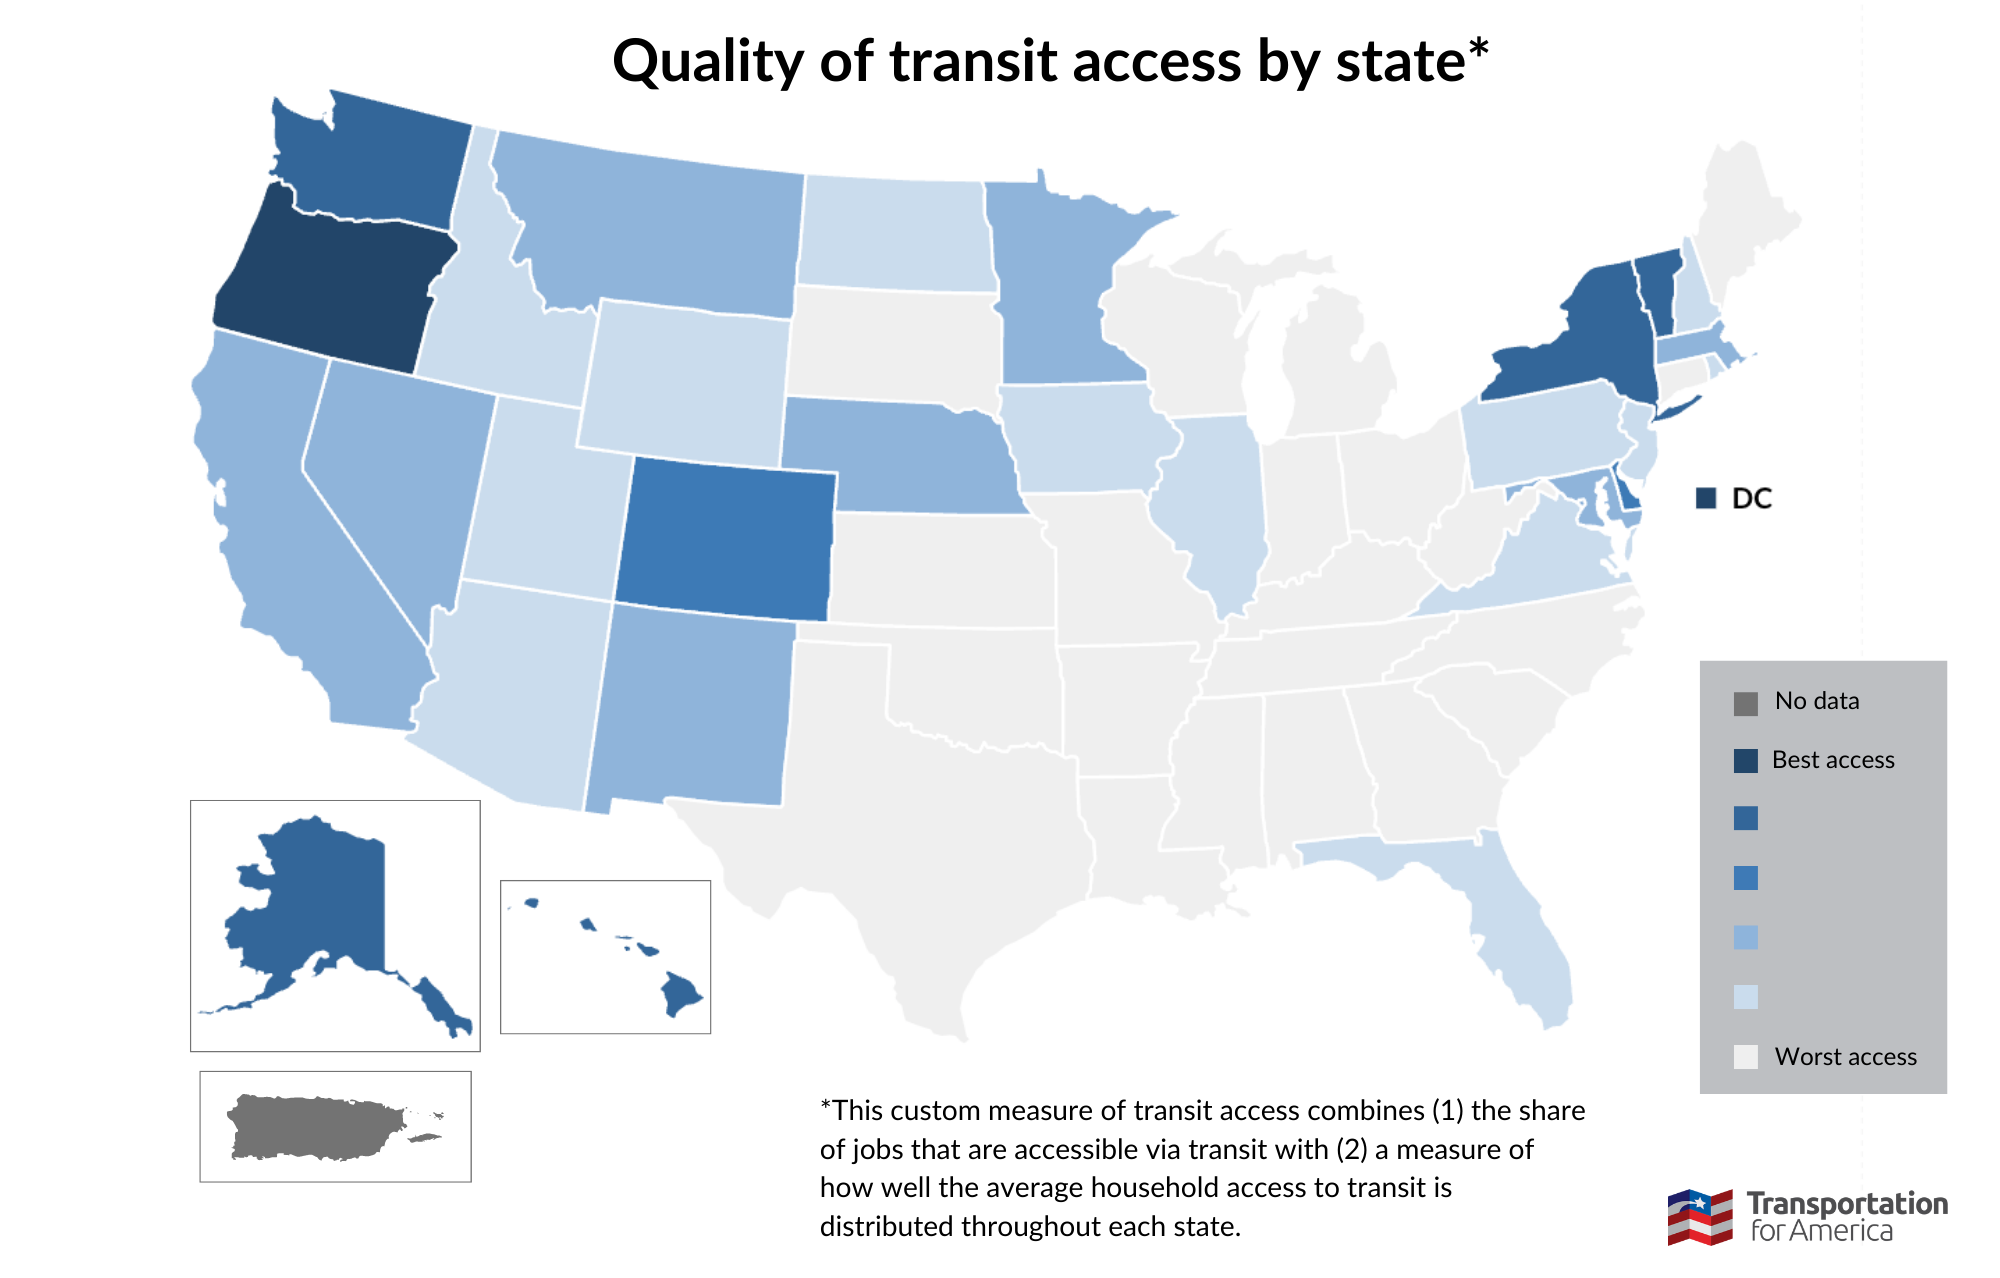
Oregon, a state that has historically been especially reliant on the gas tax for transportation funding, has tested out a VMT tax. In 2001, Oregon created a Road User Fee Task Force (RUFTF) in order to evaluate possible alternatives as hybrid vehicles and EVs began to rise in popularity. RUFTF decided to try implementing a road usage charge and launched a VMT pilot program in 2012 that succeeded in four areas: policy and public acceptance, technology, operations, and cost. This led to the creation of the voluntary OReGO program in 2015 that now enables drivers of EVs and efficient vehicles to pay a per-mile charge in exchange for reduced vehicle registration fees or gas tax rebates.

It’s notable that one of the aspects that wasn’t considered was outcomes—how the funding scheme changes (or doesn’t change) the behavior of road users, incentivizing electrification or mode shift or neither. Oregon’s eventual vision is to have a dual tax system—VMT for EVs and efficient vehicles, and a gas tax for all other vehicles.

When asked whether a VMT tax for fuel-efficient vehicles punishes drivers trying to do the right thing environmentally, Jim Whitty, who led the implementation of these programs at Oregon’s DOT, said that “making the great choice to buy a less polluting vehicle doesn’t make it a great choice to let the road system crumble.” And when asked why people who will pay more under a VMT system would volunteer to participate in the program, Whitty didn’t have a clear answer.

Notably, as of 2020, only 701 drivers were actively participating—well under the 5,000 that the program had initially envisioned. Oregon is now considering making OReGO into a mandatory policy, but other states should still try out other options before rushing to commit to a VMT tax.

Reevaluating America’s transportation funding systems

It’s of course critical that we act now to resolve this growing funding gap in order to address pressing maintenance needs and invest in the future of America’s transportation systems. When choosing an alternative policy (or combination of policies) to replace the current gas tax, it will be important to consider these five aspects—outcomes, fairness, stability, equity, and feasibility.

However, federal and state leadership will be as critical as funding. Both levels of government have a crucial role in transportation funding. Much innovation is fostered in localities, but without an overarching vision and approach, this can result in a patchwork of approaches that can spur inequitable outcomes.

It’s also important that we consider the ultimate impacts of this transportation funding system: namely, how the money is actually used. In a foundational 2006 report on possible alternatives to the fuel tax, for example, the Transportation Research Board acknowledged that their analysis prioritized problems related to highway financing over public transit. 

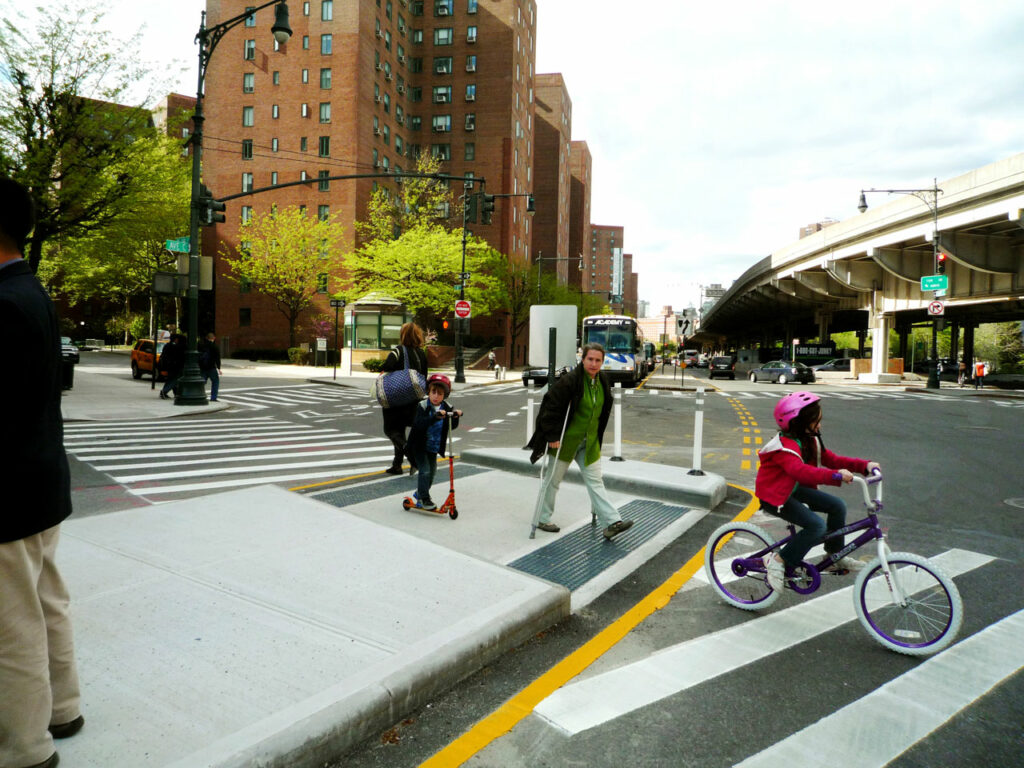
We can’t afford to pour money into expanding highways and worsening America’s transportation woes. Even if we achieve an optimal policy that maximizes revenue raised for transportation funding, we need to ensure that the money raised by any of these proposals is actually used for projects that prioritize maintenance and repair and make advancements towards reliable, affordable, and frequent transit systems that connect people to the places they need to go.

Learn more about how to evaluate alternatives. Read our policy evaluation framework here.

How does U.S. transit support compare to our peers?

Two passengers board a night bus in Brooklyn, NY

Our Transit Report Card analyzes how states compare on transit access and support. To understand how our figures match up in the context of other countries, we took a look at one of our peers: Australia.

Two passengers board a night bus in Brooklyn, NY
Photo by Jurien Huggins

In part 1 and part 2 of this series, we compared U.S. states’ support for transit based on funding and access. Those figures are hard to understand without context, so we found ourselves asking: how do U.S. states compare to similar jurisdictions in other countries when it comes to transit policy?

But “similar jurisdictions” don’t exist in many other countries. Most other industrialized countries either control all transit policy at the national level (think the United Kingdom, France, and Japan) or cede only limited power to sub-national governments (think Germany, Mexico, and India). 

We were, however, able to find one country with sub-national governments that have primary control over transit policy. That country is Australia, which funds its transportation infrastructure much like the U.S. does. Their national government distributes transportation funding directly to states and territories in the form of block grants. States and territories, in turn, direct that funding to specific projects, including public transit. Though the Australian system is different from ours in meaningful ways (like their more streamlined federal investment approach), their structure is similar to our own, where state governments dictate the vast majority of transportation spending and policy.

So we partnered with Movement & Place Consulting, a Melbourne-based transport consulting firm, to rate Australia’s nine internal states and territories on some of the same metrics that we used to rate U.S. states.

VMT

Americans drive more miles and ride less transit than Australians. Pre-pandemic, over 76 percent of Americans drove alone to work, compared with only 62 percent of Australians. On the other hand, 5 percent of Americans used public transit to get to work, compared with 12 percent of Australians commuting by train or bus. 

To better understand this phenomenon, we measured how much Americans and Australians drive, measured in annual vehicle miles traveled (VMT) per capita in each U.S. and Australian state.

As we explained in part 2 of this series, most American states see over 10,000 miles per capita, with just a few exceptions. Washington, Oregon, Alaska, Hawaii, Illinois, New York, DC, Pennsylvania, and Rhode Island all had less than 8,500 VMT per capita in 2019, the year before the pandemic changed driving patterns around the country. But how does that compare to other countries?

Map of vehicle miles traveled by state. Highlight: nearly every U.S. state has an average of more than 8,500 VMT per person. More specifics can be found in the table linked at the bottom of this post.

Map is not drawn to scale. Based on 2019 VMT data.

Australia, despite being far more sparsely populated than the U.S., does not even come close to our VMT per capita. The highest VMT Australian state, Western Australia, drives about the same amount (6,430 miles per person per year) as the lowest VMT U.S. state, New York (6,373 miles per person per year). And every Australian state fits within the lowest category of our U.S. map. So the Australian map looks stark in comparison:

Average vehicle miles traveled per person in Australia. The entire map is the same color of gray, showing that every state has less than 8,500 VMT per person. Specific highlights listed in the paragraph above

Australians are able to have a significantly reduced VMT per capita as residency is highly concentrated within a single point in each state. While in most U.S. states, 20 percent of the population lives in their largest city, approximately 67 percent of Australia’s population lives in each state’s capital city. 

These sort of dense land use strategies are proven to help reduce carbon emissions by making it easier for people to drive less. They are also proven to help grow local economies, improve access to recreation and exercise, and prevent traffic deaths (in all sorts of communities, not just urban ones).

Access

VMT per capita provides the most straightforward comparison between the U.S. and Australia, but what about access? For our U.S. analysis, we took a look at federal data to get a sense of how well transit was connecting people to their essential destinations. This gave us a transit access index, which we converted into state rankings.

Australia does not have a database equivalent to what we used in our U.S. access analysis. But we can learn a lot about Australians’ access to transit by examining its land use strategies. Land use is in fact so central to transit quality that the Federal Transit Administration (FTA) has made it a core priority.

Let’s compare two metro areas of roughly the same population: Greater Phoenix (pop. 5.01 million) and Greater Melbourne (pop. 5.03 million).  Melbourne’s transit system, Public Transport Victoria, carries around 600 million riders per year. Even prior to the COVID-19 pandemic (which reduced transit ridership across the country), the Phoenix region’s transit system, Valley Metro, carried only about 66 million people per year.

Why do Melburnians ride public transit so much more than Phoenicians? Funding is certainly part of the equation, but perhaps more importantly, Melbourne’s land use is much denser and overall more conducive to transit access. Greater Melbourne has 1,305 people per square mile, compared to Phoenix’s 332 people per square mile. Melbourne’s denser population is much easier to connect by transit. In addition, Public Transport Victoria has constructed an interconnected system of heavy rail, trams, and buses in a way that connects even the most remote suburbs. 

By comparison, Valley Metro operates only one light rail line, and while the city operates a bus network as well, frequent service is few and far between. Even the most frequent lines operate 15 minute headways during peak hours and 30 minute headways off-peak, not even close to the frequency or reliability of Melbourne’s transit network.

So the question of why Melburnians ride more public transit than Phoenicians becomes obvious: there’s more of it. Melbourne runs faster transit, of more variety, and with more frequency. And while Phoenix might be just one example, its story is all too familiar in cities across the United States.

Funding

Our funding analysis of U.S. states is much harder to compare to Australia’s, but that’s kind of the point. Australian states spend much more on transit overall, but it’s not because they have more money to work with.

The U.S. earns most of their funding for transportation through gas tax revenue. However, the vast majority of U.S. states restrict the amount of funding that their legislatures can allocate to transit systems. This creates a counterintuitive cycle. Without efficient and convenient public transit service, Americans are forced to drive more, leading to more money spent on gas taxes that then cannot be invested in alternative forms of transportation. 

Map of gas tax revenue restrictions by state. Key finding: the majority of U.S. states have a constitutional restriction on gas tax revenue. More specifics available at the table linked at the bottom of this post.

Map is not drawn to scale.

In comparison, Australia’s constitution does not explicitly discuss transportation funding—states are able to fund public transport as they deem appropriate. Furthermore, funding for Australian transport infrastructure is supported mainly by general taxation revenue and council rates rather than depending largely on gas tax.

Restrictions on usage of gas tax revenue by state in Australia. The entire map is gray, indicating that no state has a restriction on the usage of gas tax revenue.

The result: Australian states devote much more of their resources to public transit than U.S. states. Even Australia’s most remote and sparsely populated territory, the Northern Territory, spends more on public transit per capita per year ($183.48) than every U.S. state except for New York ($255.90), Massachusetts ($238.76), Hawaii ($220.98), and Maryland ($198.72).

Lessons learned

Even the best U.S. states have a long way to go in comparison to their international peers. This point became clear in our conversations with Australian experts while doing this research.

It’s easy to dismiss international transit comparisons as “apples to oranges.” But that excuse crumbles when the comparison is being made to a true peer like Australia. Both countries are large, developed, constitutional republics with low national population densities and strong sub-national governments.

While Australia’s transit system is far from perfect, the United States can learn a lot from our friends across the Pacific. We can have suburbs while still increasing density to support transit. We can have a robust highway system while still giving people other high-quality options. And we can do it by integrating transit systems to create a convenient user experience. 

We can, and we must.

Learn more about our state-by-state analysis of transit support and availability, and see a full table of results. Click here >>

We received support in writing this blog from Movement & Place Consulting, a Melbourne-based firm that conducts analysis on land use and all modes of transport planning, parking, and economic development. Follow them on LinkedIn to stay informed on their work.

California is hanging transit out to dry

California’s transit agencies are bracing for a fiscal cliff, a real threat facing communities nationwide. If left unresolved, it could lead to drastically reduced service, cutting people off from jobs and services. But California’s legislature is preparing to vote on a budget that will do nothing to stop it.

Update 6/14: Governor Gavin Newsom has released a new budget, which will keep CA transit agencies solvent in the short term.

A crowd extends into the distance, lining the platform facing the East Bay BART train tracks. A train is arriving.
Transit riders wait to board a Bay Area Rapid Transit (BART) train. Wait times and crowding will likely skyrocket if Governor Gavin Newsom’s budget passes unchanged. (Wikimedia Commons)

What is a “fiscal cliff”?

We wrote about the transit fiscal cliff issue back in January, but here’s the gist. When the COVID-19 pandemic started in 2020, many people stopped riding transit, so transit agencies saw a massive drop in their fare revenues. Transit operations depend on fare revenue to operate essential services, so Congress approved two rounds of emergency funding to keep agencies operating through the pandemic. The plan worked—agency operating funds remained solvent.

But over the past couple years, as that emergency funding dried up, fare revenue has not recovered enough to replace it. Ridership has increased, but not at a fast enough pace to cover all the costs involved with transit operations. For many agencies, it’s only a matter of time before they run out of money and need to cut their services.

The fight to save transit in California

According to a survey done by the California Transit Association (CTA), 72 percent of CA agencies face fiscal cliffs. Earlier this year, hundreds of transit agencies and allied organizations asked for $6 billion over the next five years to prevent major service cuts and regrow their ridership base by improving service. They also suggested several ways that the state could fund such an investment. 

While we would love to see California adopt a robust transit funding package like Minnesota just did to avert their own fiscal cliff, there are easier alternatives at California’s disposal. The options suggested by advocates could easily raise $6 billion without significantly impacting other priorities.  

The governor’s budget disregarded all of their recommendations, instead shifting only $2 billion away from transit capital projects to cover operating costs. Lawmakers have pointed out that this move is the worst of both worlds—it will force service cuts by short-changing operating support and it will defund major construction projects, forfeiting federal support.

The consequences of this proposal would be catastrophic. San Francisco’s Muni system would need to cut at least 20 bus lines. Bay Area Rapid Transit (BART) would see  “trains only once an hour, no trains on weekends, no trains after 9 p.m. on weeknights, reduced service to San Francisco International and Oakland International airports, some stations closed, and entire lines potentially shuttered.” 

72 percent of transit agencies statewide would face similar cuts. Unless the state acts soon to rescue its transit agencies, millions of Californians will be left stranded, disconnected from education, medical care, food, and jobs—especially low-income people and marginalized communities.

Highway-transit double standard

Let’s take a step back from this debate to examine its premise. California spends around $21 billion a year on roads while providing a paltry $2.6 billion to the state’s transit agencies—a more highway-slanted ratio even than what the federal government allocates. There is a transit fiscal cliff, but no “highway fiscal cliff.”

So while California hems and haws over $6 billion in transit funding over 5 years, it is more than happy to spend tens of billions per year expanding highways, contradicting its own policy that acknowledges the futility of highway expansions and aims to reduce driving. Governor Newsom’s current plan would not only short-change transit operations, but also leave up to $6 billion in federal transit capital dollars on the table. Highways are rarely forced to make such choices.

California could temporarily transfer some of these highway dollars from highway expansion projects to patch this temporary gap in transit funding. The federal government makes it really easy to transfer highway dollars to transit projects, so why isn’t California doing this? Why are they making transit agencies choose between capital and operations when highways get both, carte blanche?

Promises broken

California Governor Gavin Newsom has sworn up and down that he is a champion of climate action and equity, but words are cheap. His decision to gut transit service betrays those values. 

Transportation emissions are the greatest single contributor to climate change, and state governments have a responsibility to lower those emissions by providing high-quality public transit options. We know that gutting transit and increasing driving will increase carbon emissions, even if we go all-in on electric vehicles.

Gutting transit is especially contradictory to commitments on equity. Americans who are lower-income, Black or Hispanic, immigrants, or under 50 are especially likely to use public transportation on a regular basis, Pew Research Center data shows. Gutting transit hurts California’s most vulnerable communities. And at a time of historically high cost of living in California, this is particularly harmful and puzzling. 

Transportation for America is intent on holding leaders accountable for the promises they make about transportation decisions. Minnesota is keeping their promises. California is not. Governor Newsom cannot credibly call himself a climate champion or claim to be addressing equity or cost of living challenges while continuing to defund transit. It is up to all of us to call him out for it. 

T4A Director Beth Osborne joined Nick Josefowitz of SPUR to discuss California’s transit crisis on Volts. Listen to the podcast.

How Minnesota set a national example in climate legislation

The metro green line light rail pauses at a station with a few people waiting for the train. The Minnesota State Capital watches on in the background.
Flickr photo by Larry Syverson

Minnesota made waves last week by passing a landmark transportation spending bill that will fund transit expansions and passenger rail service while reducing transportation emissions. The law, which was passed by razor-thin margin, serves as a blueprint for transformative transportation legislation.

Master class in political will

Minnesota passed ambitious climate goals in 2007, as many states were doing during that era. But as with other states, Minnesota had a difficult time following through with concrete actions to meet those goals.  

But far from giving up or taking half-measures, Minnesota legislators are willing to risk their seats to make big moves. For example, Speaker of the House Melissa Hortman and Senate Majority Leader Kari Dziedzic prepared and executed an extensive legislative agenda that included a law to move Minnesota to 100 percent clean energy by 2040. That bill provided transportation champions enough momentum to pass other transformational changes, including a new transportation funding agreement passed last week.

This rare, fast-moving legislative push was made possible by the work of advocacy groups like Move Minnesota. Even when there was no hope of passing things like transit funding and limits on vehicle miles traveled (VMT), they worked with climate-forward legislators to draft, refine, and advocate for the provisions that eventually made their way into this law. They encouraged legislators to start from a vision for what the future of transportation can look like and work from there, rather than start from a dollar figure. Then during the 2023 legislative session, they organized a diverse group of transit users and supporters to testify at Transit Equity Day-themed hearings in both the House and the Senate. This was a crucial move in building momentum for this law, bringing in the voices of educators, students, cultural and faith leaders, economic development advocates, transit service providers and union leaders, mobility and disability justice advocates, bikers, elected officials, and both local and national environmental and transportation policy experts.

Not only did Minnesota legislators lap other states that call climate a priority, but they did it with the slimmest of majorities: one seat in the Senate and six in the House. There was strong opposition from the minority, which panned the bill as  “regressive taxes that hurt lower-income Minnesotans the most.”

The passage of this legislation is a perfect example of why building capacity and investing in champions is a critical step in sparking change.

What’s in the law?

At a glance, the new law passed by the Minnesota legislature provides:

  1. The authority for Metro Transit to deploy non-police personnel to check fares and issue administrative citations.
  2. $195 million to design and build the Northern Lights Express, a new passenger rail route that will operate between the Twin Cities and Duluth.
  3. $150 million to erase a transit funding deficit in the Twin Cities region.
  4. $300 million annually to build out and improve the Twin Cities region’s Bus Rapid Transit (BRT) system. 
  5. Means-tested tax credits for up to 75 percent of the cost on an electric-assisted bicycle.
  6. $2 million for a pilot program to connect people experiencing homelessness or mental health and addiction issues to social services. 

These provisions are funded by:

  1. Increasing Minnesota’s gas tax by 5 cents/gallon by 2027 by indexing it to inflation. This provision will provide stable funding not only to transit and passenger rail, but the entirety of Minnesota’s transportation system.
  2. Increasing the statewide sales tax by 0.25 percent to fund housing programs and projects.
  3. Increasing the sales tax in the Twin Cities region by an additional 0.75 percent.
  4. Imposing a $0.50 fee on deliveries over $100 in value.

It also requires that the Minnesota Department of Transportation (MnDOT) assess proposed highway expansion projects for consistency with their established greenhouse gas reduction goals, specifically by reducing the VMT on Minnesota’s roads. If MnDOT authorizes a project that increases VMT, they will need to offset the increased emissions by linking the project with a portfolio of other projects that reduce VMT by the same amount or more. 

While the transit and passenger rail funding provisions are exciting, this portion of the law may have an even greater effect. Many states have passed climate laws, goals, policies, and mandates, but few get at the real drivers of transportation emissions like this new law. In fact, Minnesota and Colorado are now the only two states to enact such rigorous processes to reduce transportation emissions. Some states enact ambitious goals, but fail to follow through.

Other states should take note—this move could yield Minnesota northwards of $91 billion in returns by 2050.

Takeaways for national politics

The actions of Minnesota’s slim majority stand in stark contrast with the 117th congress and Biden administration, who have taken a ham-handed approach to curtailing transportation emissions. Despite passing historic transportation investments through the IIJA, nationwide transportation emissions could still be poised to drastically rise in coming years. And when the Biden administration released a memo that merely suggested transformational change to transportation spending, they quickly cowed to Republican pressure and rescinded it.

Perhaps climate forward legislators in the states, federal government, and even the Biden administration could learn from MN legislators and move forward with transformative climate action.

How four mayors from the Deep South are leading the expansion of national passenger rail

The three mayors smile broadly in front of the U.S. Capitol building in full suits (Monroe Mayor Friday Ellis sports a cowboy hat)

The mayors of Monroe, Ruston, and Shreveport, Louisiana, have joined forces with the mayor of Vicksburg, Mississippi to fight for new Amtrak service through their communities. This move has placed these four local officials at the center of the national conversation about expanding long-distance passenger rail service.

The three mayors smile broadly in front of the U.S. Capitol building in full suits (Monroe Mayor Friday Ellis sports a cowboy hat)
(from left) Ruston Mayor Ronny Walker, Shreveport Mayor Tom Arceneaux, and Monroe Mayor Friday Ellis

The I-20 Corridor

Mayor Friday Ellis of Monroe, Mayor Ronny Walker of Ruston, Mayor Tom Arcenaux of Shreveport, and Mayor George Flaggs Jr. of Vicksburg are working together to establish new passenger rail service along the freight rail corridor that runs along I-20 from Meridian, MS to Dallas/Fort Worth, TX (depicted below). The new service would be an expansion of Amtrak’s Crescent service through Meridian, allowing passengers along the I-20 Corridor to access Atlanta and other points north by rail. 

“This route will be one more arrow in the economic quiver for small and midsize communities across the Deep South,” said Beth Osborne, Director of Transportation for America, in our statement in April.

On April 21, in partnership with these mayors, Amtrak and the Southern Rail Commission (SRC) submitted an application for the Federal-State Partnership for Intercity Passenger Rail (Fed-State) program to study the corridor and plan for future service. This application is a huge step forward and has led to much fanfare in the cities that stand to benefit, but service isn’t guaranteed yet. First, the FRA needs to decide whether to grant the award. 

So the four mayors, joined by the SRC and CPKC (the railroad set to host this new service) Assistant Vice President of US Government Affairs Arielle Giordano, traveled to Capitol Hill to meet with members of Congress and build a coalition of support around their application.

And we had the pleasure of escorting them around.

Map of proposed route from Fort Worth, TX to Atlanta, Georgia, with a dotted section from Shreveport to Meridian.
Map of the I-20 Corridor. The dotted section needs infrastructure work before service can start, for which the mayors are pursuing federal funding.

Local leaders have national impact

Mayors Ellis, Walker, Arceneaux, and Flaggs Jr. joined us in Washington, DC during the week of April 17-20 to meet with their senators and representatives as well as officials from Amtrak and the Federal Railroad Administration to discuss the I-20 passenger rail project. They outlined the details of the project, what federal funding they need, and why the project is important to their cities.

To make their case, the mayors focused on how the new passenger rail service will fit into their communities. They each told a story about who will ride the train, for what reason, and to where. Each community’s story was different, and each contributed something different to the group’s collective argument.

Mayor Friday Ellis described how the new station would be a core piece of Monroe’s plan to revitalize its downtown. So when the train stops in Monroe, people will have dozens of options for restaurants, shops, offices, and other amenities to choose from within walking distance. This will allow families with young children, students at the University of Louisiana Monroe, and every Monroyan to better access downtown and West Monroe (across the Ouachita River). This is why Mayor Ellis often says that the people of Monroe are more excited about this project than any other.

Mayor Ronny Walker is even further along. Much of Ruston’s downtown revitalization is well underway, and the station will fit right into it. Ruston has also invested in automated vehicle transit systems to connect the station to the nearby Louisiana Tech University (which along with nearby Grambling State University is a strong supporter of the project). The Ruston station will also be directly adjacent to the Louisiana Center for the Blind and therefore serve a community that relies heavily on rail and other transit to get around.

Mayor Arcenaux in Shreveport was inaugurated in January, so he is brand new to the role. But he has already developed a strong relationship with SporTran, the city’s transit agency, which is now working on plans to connect people from all over Shreveport and neighboring Bossier City to the new station. This will improve access to goods and services for the whole community, especially for residents that do not own cars.

Mayor George Flaggs Jr., an advocate of historic preservation, has latched onto the passenger rail plan as an opportunity to efficiently bring tourists into Vicksburg’s historic downtown and its Civil War battlefield. He has been able to pitch the project as a way to meet the immense tourism demand by bringing train-loads of riders straight into downtown – taking advantage of this major advantage of passenger rail over air or road travel. This will generate economic growth in downtown Vicksburg that will benefit residents for years to come.  

By telling these stories, the mayors were able to make considerable progress in the push for the I-20 Corridor—perhaps more progress than anyone else in the 30-year long effort to bring this service to the Deep South. For example, one of the most impactful visits was with two representatives from Texas whose districts would host part of the new service. None of our group was from Texas, but they made such a persuasive presentation that the two representatives decided to submit letters of support to FRA for the project. Members of Congress rarely make such commitments to non-constituents.

The passage of the Infrastructure Investment and Jobs Act (IIJA) in 2021 ushered in a once-in-a-generation opportunity to expand passenger rail. But taking advantage of this $100+ billion in federal funding will require the rapid coalescence of federal, state, and local governments. Mayors Ellis, Walker, Arceneaux, and Flaggs Jr. are demonstrating that local leaders are often best suited to make that push. Our job is to help them.

See more of the mayors’ visit by clicking through the gallery below.

Is your state missing the bus? Evaluating state transit access and ridership

Transit riders representing a range of ethnicities board a bus in the state of Washington

The state you live in plays a major role in the quality of transit near you. Back in February, we took a look at state financial support for transit. This post focuses on the results of those investments.

Transit riders representing a range of ethnicities board a bus in the state of Washington
Flickr photo by Seattle DOT.

We partnered with the National Campaign for Transit Justice and the Labor Network for Sustainability to assess the quality and support of transit systems across all 50 states, the District of Columbia, and Puerto Rico.

In our first post of this series, we focused on state transit funding. But the level of funding transit has received doesn’t necessarily line up with how easily residents are able to use transit on a regular basis. To understand that piece of the puzzle, we focused on two metrics: quality of transit access and how often residents choose driving over transit.

Measuring transit access

Public transit becomes a viable option only when people are able to rely on it for quick, convenient travel to their essential destinations. But, as we wrote back in 2021, while about 80 percent of people in the US live within areas classified as “urban” (which includes the suburbs of urban centers), less than 10 percent of Americans live within walking distance of reliable, high quality transit that comes every 15 minutes. And 45 percent of Americans have no access to transit at all.

To get a better understanding of transit access in each state, we took a look at data from the Environmental Protection Agency’s Smart Location Database to get a sense of how well transit was connecting people to their essential destinations. The EPA collects the number of jobs within a 45-minute drive and the number of jobs within a 45-minute transit ride. From that information, we were able to compare the number of jobs accessible by driving and the number of jobs accessible by transit.

But we couldn’t stop here. We found that some states, like New York, have dense, transit-rich cities with more jobs accessible within a 45-minute transit ride than within a 45-minute drive. This didn’t mean transit access was well-distributed across the state.

To better understand transit access for all state residents, we looked at regional parity, meaning the average person’s access to jobs by transit compared to the most transit-rich areas around them. We found that New York and Hawaii, which initially scored near the top for transit access, did not have consistently strong transit networks throughout the state. 

Map of quality of transit access by state according to our research (described in the above paragraphs of this section). Results in the last two paragraphs of this section.
Map is not drawn to scale.

We took the average of these combined factors to determine the quality of transit access in each state, shown on the map above. Oregon and DC had the highest transit access, while 20 states (Alabama, Arkansas, Connecticut, Georgia, Indiana, Kansas, Kentucky, Louisiana, Maine, Michigan, Mississippi, Missouri, North Carolina, Ohio, Oklahoma, South Carolina, South Dakota, Tennessee, Texas, West Virginia, and Wisconsin) had the lowest access scores.

These scores don’t include Puerto Rico because the EPA’s Smart Location Database doesn’t include data on access to jobs via car or transit for Puerto Rico. The EPA, and the federal government as a whole, should work to capture this information for all U.S. territories in order to provide a stronger picture of the return on federal investments.

Transit ridership (or lack thereof)

Vehicle miles traveled (VMT) is the measure of the total miles driven by all vehicles on a given state’s roadway in a given year. VMT is usually used as a measure of roadway usage, but here, it functions as a proxy measure for transit usage by measuring its inverse: car usage. We assume states with more driving on average also have less transit ridership on average.

During the COVID-19 pandemic, more people drove less often and transit ridership also dipped dramatically. To provide a more a relevant picture of travel habits, we looked at travel data from 2019.

Eight states and territories had less than 8,500 VMT in 2019, and so transit ridership in these states is likely high. They include: Oregon, Illinois, Washington, Alaska, Pennsylvania, Hawaii, Rhode Island, New York, and DC. The areas with the highest VMT (and therefore lowest transit ridership) were Puerto Rico, Wyoming, and Alabama.

Map of vehicle miles traveled by state. Key findings in the paragraph above.
Map is not drawn to scale.

What’s next?

In the final part of this series, we’ll share the combined scores for each state so you can see how your state ranks overall in transit support and availability, including the specific data we used for our analysis. Stay tuned!

Senators call on President Biden to take national approach to passenger rail

Senator Cruz smiles as he speaks into a microphone in front of a shiny backdrop

Members of the Senate are stepping up to the plate to support passenger rail service across the country. Two sign-on letters from Senator Ted Cruz (R-Texas), the new ranking member of the Senate Committee on Commerce, Science, and Transportation, urge the administration and federal agencies to do right by the national network.

Senator Cruz smiles as he speaks into a microphone in front of a shiny backdrop
Flickr photo by Gage Skidmore

Senator Roger Wicker (R-Miss.), a long-time champion of passenger rail, announced last year that he was stepping down as ranking member of the Senate Committee on Commerce, Science, and Transportation. Some rail advocates were concerned that his replacement, Senator Ted Cruz (R-Texas), would not be interested in picking up the mantle on rail.

But Senator Cruz’s first moves as ranking member—two sign-on letters advocating for Amtrak’s national network—are very encouraging. One letter calls for better representation on the Amtrak Board for the national system, while the other calls for distributing rail infrastructure dollars more equitably between the Northeast Corridor and the rest of the nation. Let’s dig in.

Letter 1: Diversify the Amtrak Board

In his first letter, Cruz points out that five of President Biden’s six nominees to the Amtrak Board of Directors are from the eight states that constitute the Northeast Corridor (NEC). He correctly argues that this violates the language laid out in the Infrastructure Investment and Jobs Act (IIJA), which requires a geographically diverse board, not to mention being patently unfair to the other 42 states in the Union.

Cruz’s request to the president was simple: “withdraw one of your Democratic nominees from the Northeast Corridor and replace that person with a nominee from outside the Northeast Corridor.” Six other senators signed onto this letter: Todd Young (R-IN), Roger F. Wicker (R-MS), Jerry Moran (R- KS), Marsha Blackburn (R-TN), Eric Schmitt (R-MO), and JD Vance (R-OH).

Senator Jon Tester (D-Mont.) recently went even further, sending the president back to the drawing board by personally blocking all of his nominees. All told, the Senate’s message to President Biden is clear: the Amtrak Board needs to represent the whole country, not just the Northeast Corridor. (Frankly, we are surprised Sen. Cruz doesn’t have partnership from other Democrats from outside the Northeast.)

Our take

Transportation for America has long maintained that for the Amtrak Board to represent the whole country, it must have members from across the whole country. T4A’s Chairman John Robert Smith served as chairman of the Amtrak Board after serving 16 years as the mayor of Meridian, Mississippi. His experience of riding Amtrak trains outside the Northeast Corridor as well as the then-new Acela service, provided him a valuable perspective that most of President Biden’s current nominees lack. For this reason, we agree wholeheartedly with Sen. Cruz’s letter.

But the letter leaves out some key issues. While those who signed this letter are  right about the problem with the president’s slate of nominees, they omit the role the Senate GOP has to play. Senate Republican leadership is responsible for deciding which Republicans the president will nominate, since the Amtrak Board consists of an equal number of Republicans and Democrats. Yet the GOP has put forth only one of their four nominees and the one is from the Northeast.

In order to get a full picture of this prospective Amtrak Board, we need a full slate of nominees—Democrats and Republicans. It’s past time for Senate GOP leadership to put forward a geographically diverse slate of Amtrak Board nominees, and we would have liked to see this letter address that.

We nonetheless applaud the Senators’ efforts as well as Senator Cruz’s leadership on this issue, and will support him in holding the Biden administration to the requirements in the IIJA. He is building on the work that Sen. Wicker and Sen. Cantwell (D-Wash.) have done to steer Amtrak toward a national vision for passenger rail.

Letter 2: Spread the Fed-State wealth

In his second letter Cruz, along with his fellow committee Republicans, writes that the Federal Railroad Administration (FRA) has inappropriately  prioritized the NEC and barred the rest of the country from key infrastructure dollars. His particular gripe is with FRA’s rollout of the Federal-State Partnership for Intercity Passenger Rail (Fed-State) program, a $43.5 billion competitive grant program that funds rail infrastructure improvements nationwide.

The IIJA states that at least 45 percent of Fed-State grants shall go to the 8 NEC states and at least 45 percent shall go to the 42 non-NEC states (the National Network). Those figures were amended in the Consolidated Appropriations Act of 2023 (the annual spending bill) to increase the maximum  amount of Fed-State funding that FRA can allocate to the NEC to two-thirds of program dollars. Implicitly, that would lower the guaranteed amount of funding for the rest of the country to one third, but the law does not explicitly say that.

FRA chose to immediately use their new discretion to max out the possible funding for the NEC to two-thirds of this year’s Fed-State grants.  In their notice of funding opportunity (NOFO) for the Fiscal Year (FY) 2023 round of Fed-State grant applications, they broke the National Network and NEC into two separate pools of funding. 

This move ensured that the NEC would receive the maximum amount of funding allowed by law (two-thirds of program dollars, or $9 billion) and the National Network would receive the minimum amount (one third of program dollars, or $4.5 billion). Cruz and his fellow Commerce Committee Republicans argue that this move essentially deprives the National Network of $7  billion worth of Fed-State funding, using a legal loophole to evade the intended use of IIJA dollars.

Our take

Senator Cruz is spot on. This issue is actually fairly simple: FRA should use its discretion to equitably balance the needs of 8 states along NEC and the 42 states in the rest of the country. The 2023 spending bill did not specifically repeal the 45 percent guarantee to the non-NEC national system and, therefore, FRA should do everything they can to adhere to that law that was passed with bipartisan support. FRA should certainly not exercise its discretion in a way that violates the written—and unamended—text in the US Code.

This letter gets at an issue we’ve harped on before: the importance of a national approach to passenger rail. One of the reasons that support for  Amtrak has been so bipartisan is that it serves the whole country. If Amtrak becomes a creature of the Northeast that doesn’t care about the other 42 states, it will quickly lose political support and likely funding.

FRA’s counterargument to Sen. Cruz’s point might be that the NEC has a pipeline of large, important projects ripe for Fed-State dollars, so it should receive funding commensurate with that pipeline. But that’s because the federally-funded Northeast Corridor Commission has had 15 years to plan and develop that pipeline. The rest of the National Network is only just beginning that process, with the creation of the Interstate Rail Compact program (IRC) and Corridor Identification and Development Program (CIDP) in the IIJA. They should not be punished for chronic federal underinvestment and lack of planning support. This administration needs to focus on the national passenger rail system in a way that gives those 42 states the chance to catch up and have a fair shot at the Fed-State grants and indeed all FRA dollars.

If the FRA wants the National Network to have a better pipeline of shovel-ready projects for the Fed-State program, it can hasten the rollout of the IRC and CIDP and provide technical assistance to build momentum for passenger rail in the Deep South, the Pacific Northwest, and other regions eager to build up their rail connectivity.

Tracking damaging divides in Gretna, LA

Two sedans break as a train approaches, unable to cross

In an astonishing sight in this small southern city across the Mississippi River from New Orleans, daily freight trains run right down the center of their main street. Local elected leaders and the busy nearby port are hoping to relocate this incredibly disruptive freight rail line, but they’ll have to raise local and state money, negotiate with freight companies, and apply for federal support to make it happen.

Two sedans break as a train approaches, unable to cross
An incoming freight train blocks traffic on an busy road in Gretna, Louisiana. Photo courtesy of Jimbaux’s Journal.

For the people of Gretna, Louisiana, miles-long freight trains are a part of daily life. But in a far different way than other smaller cities with a few at-grade crossings. Multiple times a day, freight trains cruise down the middle of their main street at 15 miles per hour through 120 unprotected intersections, grinding the city to a halt. Vehicles stop, people can’t cross the street, and the noise swallows nearby conversations. If a parked car is in the way of the train, the train stops, blocking traffic, as the operator tracks down the owner to remove their vehicle. 

But the people of Gretna aren’t taking this lying down.

This project is one of 15 that we are supporting through our Community Connectors grant program to help small and mid-sized communities repair the damage of divisive infrastructure. Learn more about that program from our parent organization, Smart Growth America.

Impact on Gretna

Situated just across the Mississippi River from New Orleans, the small city of Gretna is a vibrant, historic, and diverse community that functions as a critical trade hub for the region due to its proximity to the Plaquemines Port Harbor & Terminal District. Gretna, like many communities on the lower Mississippi River, developed around the railroad to house the industrial workforce that the freight rail companies served. One side effect of this complementary growth, however, was that daily freight trains continued to run through Gretna. And we do mean through Gretna.

Today, in one of the most astonishing sights around, freight trains from Union Pacific (UP) and the New Orleans and Gulf Coast (NOGC) railroads run right down the middle of 4th Street and Madison Street in historic Gretna, dividing the city in half and stunting the city’s growth. To appreciate the full impact on the city and the people of Gretna, watch this video:

For 12 minutes, the train blocks all of Madison Street and passes through 120 intersections, blocking emergency vehicles, personal travel, and economic activity. In 2006, a resident’s home burned to the ground as an emergency vehicle was held up for 20 full minutes, separated from the house by a passing train. 

In addition to the dozens of crashes between vehicles and trains in Gretna over the years, trains have also derailed in the city several times. Luckily none of them were carrying hazardous materials, but consider the impact of  a massive toxic derailment—like the recent one in East Palestine—right in the middle of a city street surrounded by homes and businesses.The public health and environmental damages would be orders of magnitude worse.

Call to action

In 2014, NOGC announced that it would be increasing freight service through Gretna to serve a new coal export terminal in Plaquemines Parish. This announcement sparked outrage from community members and catalyzed the pursuit of an alternative route as residents and public officials realized they could no longer ignore the problem. They collectively decided: the tracks had to go.

The first step was getting everyone to the table. A coalition that included Gretna’s Mayor Belinda Constant and representatives from Jefferson Parish and the New Orleans Regional Planning Commission quickly hammered out a plan with NOGC and UP to move the tracks several miles to the west, cutting through an industrial zone and away from the residents of Gretna. While this deal was good news, the freight companies were unwilling to chip in a cent to turn the city’s plan into a reality, preferring the local governments pick up the tab (for what would also be a more convenient route for the railroads). 

But this agreement with NOGC and UP did allow the coalition to enlist the help of the Federal Railroad Administration (FRA) in conducting an Environmental Assessment of the plan, finding that the realignment would eliminate 97 at-grade railway-roadway crossings, relieve congestion downtown, improve emergency access and evacuation routes, and even improve NOGC and UP rail service in the process. And, well, remove giant trains from the middle of a city street. The project was a slam dunk.

The proposed new rail route would avoid areas of persistent poverty, giving those areas more room to flourish.
A map from CSRS shows the current freight rail path through the city in black, the proposed new path in red, and the area around the existing tracks that would benefit from removal. Areas of persistent poverty around the existing tracks are highlighted in blue, several of which would benefit from removal.

Though the coalition was able to quickly garner support for the project, they’ve struggled to overcome its large price tag, especially with the railroads unwilling to contribute. Jefferson Parish and Gretna are willing to foot part of the bill, but will need federal support to get it over the finish line. They unsuccessfully applied for a Mega Grant from the U.S. Department of Transportation in 2022, and have applied for another one this year, which is currently pending before the FRA. Until  they come up with the necessary funds, this badly needed project will not move forward.

In the meantime, Mayor Constant and Jefferson Parish President Cynthia Lee Sheng have focused on stopping the problem from getting worse. When NOGC and Union Pacific wanted to build even more tracks through Gretna, Mayor Constant bought up portions of the land and halted further plans by the railroads to take city lands because the city felt that it had a stronger public purpose. The city was able to establish in court that the people of Gretna had more of a right to use their community’s land than the freight companies did.

Lessons for budding Community Connectors

This is an incredibly complicated and ambitious project, possibly the most among the 15 projects T4America and Smart Growth America are supporting through the Community Connectors grant program.

Gretna and Jefferson Parish, along with new stakeholders like Plaquemines Parish and the Port of Plaquemine, continue to seek funding for the project, regularly engaging the Federal Railroad Administration and their congressional delegation on the matter. Additionally, they continue to work through the finer points of negotiations with the railroads to ensure that there is a win-win project. Of note, the United States Department of Transportation has recently asked them to include improvements to the existing alignment (greenways, transit connections or other interventions) as part of a larger request that would showcase a range of public safety, freight efficiency and community revitalization benefits.

There will surely be dozens of lessons to come in the future, but here are a few things learned so far during this project:

In some instances, there are ways to challenge railroad, state, and federal land rights. This will not be feasible everywhere, but the case in Gretna proves that some courts are sympathetic to the public purpose arguments presented by a city. If you’re an advocate looking to stop a disruptive rail construction project, see if you can engage your local government to strategically acquire land, granting you leverage in court and otherwise.

Build as big of a coalition as possible. The real win in Gretna came from the extensive collaboration between all levels of government, and with the railroads, to move the costly realignment project to the point where it could possibly happen. The combined authority of Mayor Constant, Jefferson Parish, the New Orleans Regional Planning Commission, and the Federal Railroad Administration made the partnership with NOGC and UP possible, especially with the significant price tag attached to the coalition’s proposed solution.

Your most powerful advocates may be your elected officials—get them on board to fight for you. Gretna’s fight has taken more than a decade of persistent effort, but having a unified set of elected leaders to take the message to the railroads and negotiate was key. Advocates fighting similar David and Goliath battles against freight railroads, highways, or any other divisive infrastructure should take inspiration from Gretna and remain persistent. Proactively engage stakeholders to find mutually beneficial solutions. Understand competing perspectives and be willing to work through them. Engage your federal, state, local—and when applicable—railroad partners early and often.

Community Connectors: tools for advocates

You may be fighting against a freeway expansion. You may be trying to advance a Reconnecting Communities project to remove an old highway. You might be just trying to make wide, dangerous arterial roads a little safer for people to cross. This Community Connectors portal explains common terms, decodes the processes, clarifies the important actors, and inspires with helpful real-world stories.

Off the rails: A call for freight railroad reform

Aerial view of several rolled train cars piled on top of and near each other, with smoke, debris, and water surrounding them.

Between all seven Class I freight railroad companies, the U.S. saw over 1,000 derailments in 2022. Norfolk Southern (the company responsible for the derailment in East Palestine) had 119 by itself. Other railways had even more, like BNSF which derailed 279 times in 2022. Derailments are harmful to the supply chain at best and record-setting environmental disasters at worst. The systemic problems within the freight industry that have led to derailments also have the side-effect of delaying passenger rail service.

Aerial view of several rolled train cars piled on top of and near each other, with smoke, debris, and water surrounding them.
Image by the National Transportation Safety Board via Wikimedia Commons.

Last May, we announced that the Surface Transportation Board (STB) was finally taking action to improve the on-time service and safety records of freight railroads. With the recent freight disasters in East Palestine, Ohio, Springfield, Ohio, and Calhoun County, Alabama, it would seem that the freight railroads have not learned their lesson.

“Inconsistent and unreliable rail service”

On top of the freight industry’s frequent derailments and propensity to skirt regulations, the quality of their normal service is at an all-time low. Last year the National Grain and Feed Association decried three of the largest nationwide freight carriers—Union Pacific, BNSF Railway, and Norfolk Southern—for delaying shipments, resulting in the shuttering of several flour mills and livestock facilities. These delays were also a major cause of the 2022 supply chain crisis.

To hear the Surface Transportation Board (STB) say it, the freight railroad industry provides “inconsistent and unreliable rail service” that has “continued to deteriorate” in recent years. As a result, the STB continues, “shippers cannot get their products to market on time or receive essential raw materials for their companies.” This is why shippers and their customers are some of the biggest critics of freight railroad companies.

Regulators at the Federal Railroad Administration (FRA) and STB have the power to impose safety and performance regulations on freight railroads, so why does freight continue to get away with poor safety records and low performance?

Flying in the face of regulators

The FRA is responsible for regulating the railroad industry but lacks the resources to fulfill its mandate. FRA Administrator Amit Bose, although committed to making a difference, has neither the staff nor the funding he needs to proactively regulate the freight railroads. Between responding to frequent derailments and managing a $66+ billion grant and loan program, the agency is stretched thin. FRA resources have not kept pace with their increased authority, so regulators don’t have the tools they need to push freight railroads to develop their workforce, invest in safety technology, or conduct basic infrastructure maintenance.

The freight railroad industry, in turn, has lengthened trains and reduced their workforce, a common cost-cutting practice known as precision-scheduled railroading. Railroad industry labor leaders have noted that longer trains are unwieldy and make derailments more likely. A 2019 Government Accountability Office (GAO) report found that train lengths increased across all seven Class I railroads, with some companies reporting average train lengths of 1.4 miles. The GAO, however, recommended only that FRA “work with railroads…to identify and reduce impacts of longer freight trains on highway-railroad crossings,” as FRA has little authority to do much else.

These issues are compounded by freight railroad companies’ refusal to provide basic information to federal regulators. In a filing before the STB in September, one freight railroad asserted that their rail traffic control data was confidential and proprietary and that turning it over would hinder their competitive advantage. This is simply not true, since anyone with a camera and enough time on their hands could collect most of the data that these companies claim to be secrets. But they use that line anyway, and FRA rarely has the legal authority to refute it. In the case cited above, STB only got access to the data after years of litigation. 

But even when regulations exist and are enforced, they don’t work. While FRA can (and does) issue fines to freight rail companies that violate federal regulations, the penalties have little effect. Internally, freight railroad companies have long held the position that being fined by the FRA is just the cost of doing business. They factor it into their annual budgets.

Impacts on Amtrak service

Unreliable freight rail service means unreliable Amtrak service, since for the most part, Amtrak operates on tracks owned by freight companies. This problem is so pervasive that Amtrak has a dedicated page on its website to warn passengers about freight delays. They estimated that freight companies caused 900,000 minutes of delay for Amtrak passengers in 2021. Every Amtrak route outside the northeast corridor was delayed by freight trains more than 50 percent of the time in 2022.

On a personal note, I was recently on a Crescent train from DC to New Orleans to attend Amtrak’s announcement that they are pursuing new long-distance passenger rail service along the I-20 corridor from Atlanta to Dallas. But our trip was interrupted when a freight train derailed ahead of us, forcing us to disembark in Atlanta and delaying our trip.Like many passengers, I could not wait for my train to resume service, so I had to find an alternate route to my destination. I could see how that experience would make someone hesitate before riding another Amtrak train. 

How can we expect to build out a national network of passenger rail if passengers cannot reliably reach their destinations even half the time? Money is not the issue. In fact, federal funding for rail remains at an all-time high. But no amount of passenger rail funding can prevent delays caused by other companies. With freight trains in the way, Amtrak is going nowhere.

Getting back on track

In recent months, federal regulators have taken some more aggressive measures to ensure safe, on-time freight rail performance. For example, the FRA recently proposed a rule that would require most trains to be staffed by at least two crewmembers. This would eliminate the most egregious instances of understaffing. But why stop there? Freight railroads—as the Biden administration has emphasized—are a crucial pillar of our national supply chain.

Recent bipartisan proposals are a good start. The Railway Safety Act introduced in the Senate by Senators Sherrod Brown (D-OH) and J.D. Vance (R-OH) and the RAIL Act introduced by Ohio Representatives in the House would tighten safety regulations: requiring two person crews, expanding the classification for highly hazardous flammable trains, and imposing bigger fines on companies that violate these rules.

But these proposals still leave FRA without the tools it needs to prevent future derailments. Congress should pass legislation granting FRA the staff, resources, and authority to proactively regulate the freight industry as the national utility and public safety hazard it is. One way to do this would be to give FRA a stronger mandate to go after “proprietary” freight railroad data. 

Congress should also give Amtrak stronger authority to ensure on-time service despite freight delays on its National Network. The Rail Passenger Fairness Act (S.1500 and H.R.2937), introduced by Sen. Dick Durbin and Rep. Donald Payne, Jr. in 2021 but not passed, is a good model for future legislation.We do not need to be held hostage by freight railroads. After all, we gave them the property to build their tracks. So let’s get back on them.

Follow the money: Where does your state stack up on supporting transit?

A passenger hops onto a bus on a sunny day

Even though transit service is a localized experience, the state you live in actually has a massive impact on your access to frequent, reliable transit. As with interstates, ports, or other vital parts of a state’s transportation network, state governments have a major role in supporting the planning, operations, and maintenance of public transportation service. But the financial commitment to transit varies widely from state to state.

Flickr photo credit: TriMet

In partnership with the National Campaign for Transit Justice, we assessed the quality of transit support and availability across all 50 states, the District of Columbia, and Puerto Rico. We’ll unpack our four criteria in a series of blog posts. This first post focuses on the dollars and cents: transit spending and restrictions on state tax dollars.

At a time when transit agencies are facing heavy financial stress, state support can be a key source of funding that allows transit to continue delivering reliable service. Most large transit systems, many of which are vital for supporting the largest regional economy in a state, operate with some level of support from their state. But that’s not always the case. There are statewide policies that impact a state’s financial commitment to transit, which can range from robust support down to almost nothing.

Transit agencies across the nation are nearing a fiscal cliff in 2023 as Covid-era relief packages expire. Click here to learn more.

Transit spending

If you’ve ever wanted to know what your state’s priorities are, take a look at the budget. That’s one of the first places we looked to assess state support for transit.

The 2021 infrastructure law increased federal transit spending, but in almost every case (with the exception of small agencies), these funds are not permitted to be used on operations, which means they don’t cover expenses like bus drivers’ salaries or bus maintenance. These expenses account for two-thirds of transit agencies’ total expenses, and without federal support, the burden of this funding can only realistically come from a few sources: state funding, local funding, and farebox revenue. The amount of state funding can have a major impact on the reach and quality of transit, especially in rural areas that don’t have as much local funding to supplement state dollars.

Click here to learn how transit spending on operations impacts local driving habits.

In the first graphic below, transit spending refers to each state’s total spending on public transportation in 2021—adjusted to per person rates to fairly compare states of varying size. We identified six bands of state transit spending per person:

  • Less than $12
  • $12.50-$25
  • $25-$50
  • $50-$100
  • $100-$200
  • More than $200

To see where your state lands, take a look at the figure below.

Map of state transit spending. For more information, see the text under "Transit spending." A table showing each state's spending will be available in our upcoming report, The Transit Report Card.
Map depicting statewide spending on transit per capita (or per person) in each state in 2021. Map is not drawn to scale.

While the map above shows each state’s most current spending levels (from 2021) on public transit, it’s not a full picture. Annual transit spending is also volatile, subject each year to the whims of state legislators, so these numbers from 2021 could look very different today. To get a stronger sense of long-term transit funding, we had to take a look at one of the frequent key sources—gas taxes.

State restrictions on gas tax revenue

Gas taxes are the taxes you pay every time you fill up a tank, and they’re the bedrock revenue stream for most states’ transportation systems. In fact, this is how we fund transit capital improvements nationally, by devoting a small share of the 18.4¢-per-gallon federal gas tax to a trust fund for transit. Yet in many states, it’s illegal to use state gas taxes for public transit.

Restrictions on gas tax revenue create a counterintuitive cycle, where all gas tax funding goes only toward building more roads, resulting in people having to drive more, which means more gas sold, which means more money spent on only new roads and no other travel options—leading to more driving and more spending. Without the reliable source of funding fuel taxes would provide, many transit agencies have had to rely on sales taxes, which are an incredibly volatile funding source subject to the swings of the economy. As a result, transit agencies can be forced to raise fares or cut service to stay afloat. 

Gas tax restrictions can come from state statutes or state constitutions. Statutes are laws that can be written, passed, and repealed by state legislators. On the other hand, to repeal any law in a state constitution, an amendment needs to be passed. It is more difficult to pass a constitutional amendment than to repeal a statute.

In seven states, gas tax revenue is restricted by state statutes. Though these prohibitions can be a frustrating roadblock for advocates and transit agencies, they can be repealed. In the figure below, these states are shown in medium blue.

23 other states have a clause in their state constitution prohibiting gas tax revenue from being spent on public transit. Edit 2/23/2023: Three additional states (MI, OK, and CO) have partial restrictions on the majority of gas tax revenue being spent on transit. All of these states are shown in dark blue below. Though constitutional restrictions are much more difficult to overturn, advocates who see their states have these restrictions shouldn’t give up. In some cases, the language may be vague or flexible enough to leave room for transit to receive funding, even if the law hasn’t been interpreted that way in the past. For example, Colorado advocates were able to win transit support by making their fight about the way their gas tax law was interpreted.

States with no restrictions, like California, Virginia, South Carolina, and New York, are shown in light gray. These states allow gas tax revenue to be used for transit, which can serve as a lifeline in times of economic stress.

Map of gas tax revenue restrictions by state. For more information, see the text under "State restrictions on gas tax revenue." A table of each state's restrictions will be available in our upcoming report, The Transit Report Card.
Map depicting restrictions on usage of motor fuel tax revenues in each state as of 2022. Map is not drawn to scale. Edit 2/23/2023: A previous version of this map erroneously included Illinois, Wisconsin, Florida, Massachusetts, Vermont, and Louisiana as states with constitutional or statutory restrictions. These states have no restrictions.

The bottom line

State spending is a strong indicator of state priorities, and low spending (coupled with a lack of funding options) is a clear sign that transit service is not at the top of state legislators’ minds.

Across the country, the transit fiscal cliff is looming. To weather the storm, agencies require financial assistance, or they’ll be forced to cut valuable service. Now is the time to increase transit spending at the state level. States with statutory and constitutional restrictions on funding for transit will need to think critically about how well these restrictions are serving them and their residents.

Keep an eye out for our next post in this series, which will focus on transit access and driving levels in each state.

Once-in-a-generation opportunities in passenger rail—but the time to act is now

T4America works with partners all over the country to develop passenger rail service, and we’re telling them all the same thing: now is the time to act. We’ve never seen this amount of support for passenger rail from Congress and the Federal Railroad Administration, and federal funding is there. But there’s a procedure—with deadlines—to follow. Here’s how to take advantage in the year ahead.

Amtrak Cascades at Mt. Vernon station. Photo via Flickr/Joe A. Kunzler Photo

Legislative and administrative stars aligning

For decades, the development of a national passenger rail system has been low on the priority list for Congress. Who could blame them? So many of their districts are poorly served, and Amtrak focused almost exclusively on the Northeast Corridor and left the rest of the country out to dry. (Read more about the history of Amtrak and Congress here.)  

In 2021, despite Amtrak’s lack of focus on the national system, Congress made leaps and bounds in their support for passenger rail by passing the Infrastructure Investment and Jobs Act (IIJA), which funded the Federal Railroad Administration (FRA) and Amtrak at historic levels. The IIJA also re-oriented the mission of the national passenger rail system toward serving more communities, both urban and rural, across the country. In the past, Amtrak has been required to make a profit—unlike other modes of transportation—above all other goals, often to the detriment of its riders. 

If Amtrak, states, interstate compacts, regional passenger rail authorities, and localities play their cards right, these historic funding levels coming from the FRA and the renewed national mandate for Amtrak can result in a much improved and expanded national network of passenger rail. The IIJA charted out a process for this expansion, which focuses infrastructure improvements to passenger rail corridors within interstate compacts. We have narrowed this process down to three steps, which we outline below.

Step 1: Corridors

The first and most immediate step in advancing passenger rail service across the country is the identification and development of passenger rail corridors. The IIJA created the Corridor Identification and Development Program (CIDP), which is designed to focus federal funding on key passenger rail corridors across the country. The term “corridor” refers to a stretch of rail right of way where applicants can build or improve station stops—as well as the rail infrastructure between them—to give more people access to the route. 

Where will these corridors be built? The short answer is: we’ll have to wait and see. States, localities, interstate compacts, or other applicants will determine where they want to establish corridors based on many economic and social factors. But the possibilities are immense. FRA has challenged state and local leaders to, in their words, “dream big” with the CIDP. Governments from around the country have already expressed their interest in developing corridors, which Amtrak presented during a public board meeting in December (rendering of Amtrak’s map pictured below, with potential corridors in light blue).

Recreation of map presented at Amtrak’s public board meeting (Source: Ryan C on Twitter)

As an incentive to create official corridors, the FRA is offering successful applicants $500,000 in no-match federal funds to start planning their corridors. New corridors will also get preferential treatment during future federal grant applications. These incentives are what make applying to the CIDP a critical next step for the development of passenger rail service. 

The CIDP is currently open, with applications due March 20.

Step 2: Infrastructure improvements

Officially recognized passenger rail compacts and corridors will be at the front of the line at FRA for funding opportunities. The IIJA greatly expanded the two main federal passenger rail infrastructure programs: the Federal-State Partnership for Intercity Passenger Rail Program (Partnership Program) and the Consolidated Rail Infrastructure and Safety Improvements (CRISI) Program. This should encourage regional, state, and local governments to apply, given that the possibility of receiving an award is higher than it ever has been. 

The Partnership Program is live right now, with applications due on March 7.

These funding opportunities can be used to plan for, design, and construct grade crossing eliminations, stations and multimodal station areas, track improvements, and create capacity improvements (addressing bottlenecks). These improvements are all critical for the safety and viability of passenger rail service on new and expanded corridors. In addition to these infrastructure improvements, compacts and corridors will have priority in applying for operational support through programs like the Restoration and Enhancement (R&E) Program to begin to operate new or restored passenger rail service.

Step 3: Compacts

In order to solidify the gains made from forming corridors and funding infrastructure improvements, interested states should form interstate rail compacts. The IIJA created the Interstate Rail Compact Program (IRC) to help states work together to further the development of regional passenger rail networks across the country. 

The IRC Program is seeking to build off the success of interstate rail compacts like the Southern Rail Commission (SRC), the oldest rail compact in the country. The SRC consists of Louisiana, Mississippi, and Alabama and works to coordinate stakeholders in those three states to restore passenger rail service throughout the deep south. Watch this video to see the SRC’s work in action.

Through the IRC, the FRA is seeking to create 10 such compacts (SRC included) to serve 10 different regions across the country. During the formation process, the FRA will support these compacts in building coalitions of support, identifying opportunities for new or restored passenger rail service, and pursuing federal funding. 

The IRC is likely to open later this year.

Support is fleeting

Congress is changing hands. Sam Graves, who has little to no track record on passenger rail, is the new chairman of the House Transportation and Infrastructure Committee. We expect Ted Cruz—an opponent of passenger rail—to run the Senate Commerce Committee if Republicans take the Senate next cycle. 

This constant shuffle in Congress means that, at any moment, the programs generously funded by the IIJA could once again be defunded. So while the IRC and CIDP will be available in coming years, this year is the only guaranteed opportunity for full program funding and support from the FRA. 

Local advocates have opportunities to get involved as well. Round up your state or regional passenger rail authority. If you’re looking to get long-distance service, find ways to participate in the FRA’s Amtrak Daily Long-Distance Service Study. If you want to see your community served by new or improved passenger rail corridors, now is the time to go out and get things moving.

How DC’s local transportation trends emerged within TransportationCamp DC

Shabazz Stewart giving keynote on stage at transportation camp with audience in foreground

Last Saturday, we hosted more than 300 people for TransportationCamp DC at George Mason University’s Arlington campus. This “unconference” lends attendees the mic to discuss their transportation passions, ideas, and concerns with other advocates and experts. TCamps are also products of their local context, so here’s a quick glance at some of the issues that emerged—through that specific local lens.

Shabazz Stewart giving keynote on stage at transportation camp with audience in foreground

Shabazz Stuart, CEO of Oonee, delivers the keynote address on civic entrepreneurship at TransportationCamp DC.

Transit

On December 6, the DC Council made national headlines by voting to advance the Metro for DC bill, which would make all WMATA bus rides in the District free and improve those rides by investing $10 million in service and reliability. The bill also left open the possibility to provide all DC residents with $100 a month to ride MetroRail, the fate of which will be decided in 2024 budget talks next year. (DC Mayor Muriel Bowser is not yet supportive of the plan.)

Expert opinions are mixed on the matter and the debate even made its way to an August episode of Freakonomics. Yonah Freemark put out a great Twitter thread on the matter as well.

Meanwhile, transit agencies across the country continue to struggle to recover from the pandemic and find new ways to get things done. As we head into 2023, concerns about transit delay, access, and operations are still at the front of many riders’ and agencies’ minds.

How it came up at Camp: 

  • Layers of transit delay
  • What can we learn from unlimited tickets and fare capping?
  • Making transit the default
  • Measuring transit safety
  • Using cell data in transit planning and operations
  • Incentivizing local orgs to buy transit passes
  • Small transit tech success

Road safety and Vision Zero

On October 27, DC Mayor Muriel Bowser released an update to the District’s Vision Zero plan, the city’s pledge to eliminate all traffic deaths. The update serves as a tacit admission by the city that its original 2015 plan failed to reduce traffic deaths, which have been steadily increasing. The plan also focuses on the impact of traffic violence on more vulnerable and diverse communities, particularly east of the Anacostia River in Wards 7 and 8, which also have some of the lowest rates of car ownership in the city. As traffic deaths rise across the country, DC’s focus aligns with the majority of evidence that points to changing road designs to slow vehicle speeds as the most effective (and unused) strategy for reducing traffic deaths.

How it came up at Camp:

  • A panel discussion on data and safety, from TCamp platinum sponsor INRIX.
  • Let’s rethink enforcement
  • How can we best protect/support nondrivers?
  • Why do Complete Streets projects fall apart in the preliminary engineering phase?
  • Colorado needs advice — how to tackle reducing transportation emissions
  • Streets, roads, and stroads

Advocacy and reducing emissions

With a new federal rule on reducing greenhouse gas emissions, new tax incentives for electric vehicles (EVs), a burgeoning plan (and funding) for building out the national rail network, and funds for transit to reduce emissions, it’s no wonder that emissions and EVs are on many people’s minds as we head into 2023.

Advocates continue to mobilize around issues of climate justice and public health, and TransportationCamp is an excellent place for these advocates to expand their circles, offer each other support, and learn new ways to advance their goals.

How it came up at Camp:

  • Power collab: BIPOC and disabled activists fight for climate mobility
  • The national passenger rail landscape (a joint session with T4America staff and Amtrak presenting together)
  • Moving single-passenger gas-powered vehicles to EV
  • Beyond EVs
  • Ask your doctor if hydrogen is right for you
  • Power from the people!!

five panelists on stage discussing data in front of big screens
Our panel discussion on data, organized by our platinum sponsor INRIX.

Closing divides and connecting communities

On October 25, the Montgomery Council approved the county’s new General Plan, entitled Thrive Montgomery 2050. (Montgomery County borders the District of Columbia to the immediate northwest.) This vote came after years of planning, political battles, and protests, largely over the plans to build new and denser housing. But now that the plan has passed, the county will look to implement it by building more walkable communities through denser land use, better transit service, and more bicycle facilities. While the implementation process will take years, the passage of Thrive Montgomery 2050 is a major step forward, and gives local advocates a platform to fight for a smarter county-wide transportation system.

The county has also been the site of a contentious battle over the plan to expand Interstate 270, a priority of Maryland’s former Governor Larry Hogan. Montgomery County Executive Marc Elrich has long opposed the plan and nearly succeeded in killing it in 2021 when he got the Washington Council of Government’s Transportation Planning Board to remove the project from its plans, jeopardizing the ability of the project to gain federal approval. But the Board reversed their decision only five days later, after Hogan acquiesced to including bus priority lanes in the project. On August 25, 2022, the Federal Highway Administration finally approved the project, but the project’s ultimate fate rests with Maryland’s new Governor, Wes Moore, whose opinion on the project is not yet clear.

Montgomery County advocates are fighting hard for land use and transportation decisions to better serve people, but are up against powerful interests that want to continue the same failing approach to address mobility and congestion through incredibly expensive highway investments alone. Advocates across the country can learn lessons from the way local officials leveraged the environmental review process and the importance of supportive statewide leadership, though the final verdict also isn’t in yet.

How it came up at Camp:

  • Calling all Community Connectors!: A discussion on the resources needed to oppose divisive infrastructure
  • Let’s all get on the same page about why highway expansion is idiotic
  • It’s time to move from mobility to access
  • Procedural bike planning
  • How to make cities bike-friendly for kids (led by an eight-year-old!)
  • Gender & transportation

Lastly, for much more on the local DC angle, please turn to our two DC-area Community Sponsors of Transportation Camp DC: Greater Greater Washington organized a heavily attended session all about what’s happening in the DC region on these issues and how to get involved, and longtime Smart Growth America member Coalition for Smarter Growth is the go-to source for advocacy in the greater DC region.

We’ll have some more thoughts and reflections about the incredible day that was Transportation Camp here soon. But we want to say an immense thank you to the 300-plus participants who showed up (about 20 percent of whom proposed or led a session!), our many virtual participants who joined us online, and our incredible sponsors who made it all possible and also kept the costs minimal for participants.

Thanks to our Transportation Camp DC 2023 sponsors!

Continue the conversation in February at the virtual Equity Summit!

Want to keep talking? Join us at the Smart Growth America Equity Summit from February 7-9 for more discussion on the transportation topics that are most important this year. During this three-day virtual event, presenters will discuss keeping equity at the forefront of every smart growth approach—and February 8th focuses entirely on transportation. Join us for a day packed with conversation around reconnecting communities. Learn more and buy your ticket today.

The long fight for connectivity in Milwaukee

Successfully halting construction on the Park East Freeway in Milwaukee in 1977 was a major early win for advocates. But removing highways is more complicated. Milwaukee confronted that problem in the late 1990s and early 2000s when they attempted to remove the portion that had been built—a story which can serve as a model for other highway removal efforts.

Google Maps street view of a section of North Water Street within the Park East Corridor

Freeways built over communities

In 1966, officials in southeast Wisconsin had penned the quickly growing area’s first comprehensive regional transportation plan, which called for 16 freeway routes in the seven-county region. Many of those (pictured below) would cut through the city itself, destroying thousands of homes and businesses. The plan was created to rearrange Milwaukee’s transportation system around the growing suburban sprawl of the 1940s and 1950s, with a priority on creating ways for suburban residents to quickly drive into and through the city. The needs of city residents in the neighborhoods those people would pass through were never the prime consideration, if their needs were considered at all.

The Southeast Wisconsin Regional Planning Commission’s 1966 plan for downtown freeway development. The Park East Freeway is the top east-west connection on this map. (Source: City of Milwaukee)

Some Milwaukeeans quickly grew concerned and frustrated over the destruction of thousands of homes, businesses, and parks as the first sections of the region’s freeways were built. One of the most destructive new freeway projects was the Park East Freeway. Black communities, most notably the thriving community of Bronzeville, faced the brunt of the damage and many were largely leveled to pave way for freeway construction. The Park East Freeway destroyed nearly all of what was a thriving community in Bronzeville, which once surrounded Walnut Street west of the Milwaukee River. Other freeways repeated this process across the city.

The staunch opposition of Black Milwaukeeans was ignored by the city and the Southeast Wisconsin Regional Planning Commission (SWRPC), which jointly completed the first section of the Park East Freeway in 1969 — the east/west segment marked in green and gray on the graphic above. As with many other cities, the tide in the fight against freeway construction would turn only when interstates were proposed to be built in whiter, more privileged neighborhoods.

Residents fight to halt construction

In the early 1970s, residents in nearby, primarily white neighborhoods like Sherman Park and Bay View in north Milwaukee organized citizens’ associations to formally resist construction of the Park East Freeway through their communities. These newly formed groups, which had significant resources at their disposal, turned to the legal system to fight the freeways. 

Their legal challenges were enabled by a new law that radically changed the highway construction process. Congress had just passed the National Environmental Policy Act of 1969 (NEPA), which required all construction projects utilizing federal funding to conduct environmental impact studies that measured projects’ impacts on the environment, which included tangible impacts to people in the community. Armed with new NEPA regulations, those wealthy Milwaukee residents were able to not only halt the construction of the Park East Freeway, but successfully got the  SWRPC to institute a ten-year moratorium on all new freeway construction in the region.

This seemed like a major win, but the fight was far from over. Much of the Park East Freeway and other freeways had already been built, crisscrossing the Milwaukee region with damaging road infrastructure that disconnected scores of communities. 

By the time the courts and the SWRPC had halted construction on the Park East, city, regional, and state agencies had already displaced thousands of residents, torn down thousands of homes, and laid miles of asphalt. What was left of the Park East Freeway—a spur of a half-completed highway (pictured below)—remained a gaping hole in the middle of several neighborhoods in north Milwaukee, dividing the people that lived there from neighbors, jobs, and essential services. Repairing these holes would prove to be a greater challenge than halting construction had been.

Removing the Park East Freeway

The former Park East Freeway (Source: City of Milwaukee)

The one-mile spur of the Park East Freeway from I-43 to North Milwaukee Street destroyed or disconnected 17,300 homes and as many as 1,000 businesses. Only a few decades later, the underutilized and expensive freeway would become a clear candidate for removal.

For decades, the area around the Park East Freeway languished in underdevelopment, devoid of essential services or transportation facilities designed to serve the needs of  people living in the area. Developers refused to build anything but surface parking on land adjacent to the freeway, not because parking was in high demand but because other uses were a tough sell right next to the highway. But in 1991, one developer finally took a chance on the area. Mandel Group built a remarkably successful development of luxury apartments and condominiums, selling homes for as much as $500,000. 

The success of this newly created real estate company—and the buzz of nearby redevelopment activity that followed—caught the attention of Milwaukee’s new mayor, John Norquist. He had been elected to the Wisconsin State Assembly on an anti-freeway platform during the height of Milwaukee’s freeway legal battles of the 1970s, and saw an opportunity to revitalize his home city by removing the old, blighted freeways that divided it. He began drafting a plan to replace the Park East Freeway with McKinley Boulevard, restoring the urban street grid in the area and freeing up 26 acres of land for redevelopment.

Illustrations of the urban street grid overlaid on the former Park East Freeway right-of-way (Source: City of Milwaukee)

Norquist and his allies, however, still needed to convince other regional and state government agencies to approve the removal project and commit funds to it. They opted to make economic development their core message, proving that removing the freeway would draw new investment and economic activity to downtown Milwaukee. In 1998, they drafted a plan for downtown Milwaukee that tied freeway removal to economic development goals. The plan was approved shortly afterward, in 1999. Another 1998 report, this one by the SWRPC, helped to allay fears that removing the Park East Freeway would increase traffic. The Milwaukee Board of Supervisors and City of Milwaukee Common Council were convinced, approving the plan in quick succession in 1999.

Over the years, NEPA has also been utilized in counterintuitive ways to fight proposed highway removals. The well-researched removal plans helped Norquist’s plan survive one of these NEPA-based legal challenges from local businesses concerned about congestion. And in 2002, the city broke ground to remove the one-mile stub of the Park East Freeway and replace it with an urban street grid—dubbed the Park East Corridor—in 2003. 

Milwaukee funded the project through a compromise with the State of Wisconsin that redirected $21 million in federal highway dollars originally appropriated to the State of Wisconsin for a bus priority lane on I-94. The state matched this money with $1.2 million of its own, and the city followed suit with $2.5 million to bring the full project funding to $25 million. The SWRPC made this agreement official in its 2001 plan, cementing the joint commitment of all three parties toward removing the Park East Freeway.

Park East Freeway being torn down. (Source: City of Milwaukee)

As with other similar projects to remove freeways or highways across the country, the hefty congestion predicted by opponents or skeptics never materialized. Traffic just disappeared, as every state DOT’s expensive models consistently fail to accurately predict. The project was a major success, reducing congestion and attracting billions of dollars in new investment to the Park East Corridor. One block of the new corridor, “Block 22”, has attracted over $3 billion in investment. The corridor was slated to host the 2020 Democratic National Convention before the COVID-19 pandemic spoiled the event. The area has attracted several new corporate headquarters, recently including The American Family Insurance Company

With this proven example in mind, officials in Milwaukee are studying the removal of an outdated portion of State Highway 175 that walls Washington Park off from the Washington Heights neighborhood to the west. As Milwaukee looks to continue healing from its era of roadway-based demolition and division, localities across the country can learn from its successes.

Lessons for budding community connectors

Milwaukee benefitted from a skilled and motivated political leader in John Norquist. Advocates should cultivate political champions of freeway removal of their own, but they also can learn from Norquist’s success in other key ways.

For highways that are still on the books or being advanced toward construction, the NEPA process is as relevant now as it was in the 1970s, still requiring projects of a certain size and scope to engage communities before proceeding. NEPA public engagement processes are a great opportunity for advocacy groups and concerned residents alike to fight for projects that avoid harmful roadway construction. 

Mayor John Norquist succeeded with a simple, well–supported argument for removal that focused on a broadly shared value of economic growth. While Norquist and the coalition supported the project for scores of other worthy reasons and benefits, this economic framing was decisive in convincing skeptical public officials in Milwaukee, the greater region, and Wisconsin state government to approve the project. Local policymakers and advocacy groups should document the benefits of their plans, framing them in ways that will resonate with their communities—and with the people they need to convince. 

While Milwaukee is a good model, it is not perfect. While the destruction of neighborhoods like Bronzeville can never be undone, officials should seek to replace the freeways that destroyed them with development designed to serve the needs of those affected communities. Other communities have prioritized finding ways to restore some portion of lost wealth and income to those who were affected. Milwaukee has developed the Park East Corridor to include luxury apartments and corporate headquarters, but city officials should also seek out ways to provide affordable housing and invest in Black-owned businesses in the area. Undoing the damage created in the first place has to be part of the equation, as does creating a plan from the ground-up with those left behind or neglected, rather than just delivering a top-down plan to them and asking for their support.

But the bottom line is this: resisting and reversing highway construction is possible. The destruction of American communities is not inevitable, and when it happens it need not be permanent.

Community Connectors: tools for advocates

You may be fighting against a freeway expansion. You may be trying to advance a Reconnecting Communities project to remove an old highway. You might be just trying to make wide, dangerous arterial roads a little safer for people to cross. This Community Connectors portal explains common terms, decodes the processes, clarifies the important actors, and inspires with helpful real-world stories.

Hybrid TransportationCamp DC, explained

TransportationCamp DC 2023 is quickly approaching, and we’re excited to see what you all have to bring to the table. TransportationCamp is an “unconference,” which means that you, the participants, will determine the agenda by proposing and leading sessions. This year, we’re doing things a little bit differently with a hybrid format using virtual and in-person sessions.

In-person sessions

The classic way to join TransportationCamp, in-person sessions are what most people think of when they think about Camp. These sessions are submitted the morning of the event, and the result is usually a mad scramble as hopeful session leaders brainstorm their ideas, find others looking to discuss the same topic, and come up with a plan. Then attendees get to vote on which sessions they want to see!

Do: Think about what you want to present, and be open to new, creative ideas from other attendees.

Don’t: Submit a session until the morning of TransportationCamp. That would just spoil the fun! 

These sessions will be in person at George Mason University’s Arlington campus. Register to participate here by clicking “Buy Tickets” and selecting “General Admission.”

Virtual sessions

Virtual admission is the other option for joining TransportationCamp. We hosted TransportationCamp completely virtually in 2021 and 2022 due to the COVID-19 pandemic, and we know the flexibility was helpful for many of our attendees across the country and the globe.

Attendees still propose and lead sessions, but unlike in-person attendees, your sessions will be all virtual and you get to propose your sessions in advance. Submissions are open now until 12:00 p.m. ET on December 21, and the link to submit will show up in your confirmation email.

Do: Register now for virtual Camp, and keep an eye on your inbox for a confirmation email with session submission details.

Already registered? Check your inbox for an email from info@t4america.org with subject line “Submit your sessions for #TransportationCampDC.”

Don’t: Wait until January to propose a session. That’ll be too late!

What about hybrid sessions? Both in-person and virtual attendees will have access to the morning welcome, keynote address, and one hybrid session presented by INRIX.

What’s next?

Think it would be fun to lead a session, but not sure you have what it takes? Read this advice from past session leaders

TransportationCamp DC is just around the corner. We’re looking forward to a day packed with new ideas, creative thinking, and relationship building. Register today!

Eliminating driver error doesn’t work. What does? Part II: Designing solutions

In part I of this blog series, we reviewed the evidence on three roadway safety strategies that rely on changing driver behavior—education, enforcement, and technology—to show where they fall short in making America’s roads safer. Design-based solutions, which accept and plan for human mistakes, can avoid the pitfalls of behavioral solutions. A recent report from New York City’s Department of Transportation sheds some light on which of those solutions work best—and for whom.

Streets and roads designed for safety—not speed—are tried and true interventions that reduce injuries and deaths. They require minimal driver education, because self-educating driver cues are built in. They have self-enforcing geometric features that force drivers to obey traffic laws without the threat of police violence. And while technology can be a critical part of safe road design, slower vehicle speeds lessen the need for fast-acting automated systems to avoid crashes. 

What does a safely designed street look like? Fundamentally, it is a street with features—like narrower and fewer lanes, extended curbs, and bike lanes—that accept the mistakes made by human drivers and induce slower vehicle speeds to minimize the danger caused by those mistakes. Safe streets better reflect the complexity of a street with many different types of traffic, and are often called Complete Streets. Safe streets are going to look different in every place they’re implemented, since they are necessarily responsive to local contexts. But across the board, safe street design 1) lowers speeds and 2) considers all road users.

Evidence from the Big Apple

A recent report from New York City’s Department of Transportation (NYC DOT) provides some of the best data to date on the effectiveness of seven specific features of NYC’s safe street design efforts: road diets, conventional (unprotected) bike lanes, protected bike lanes, pedestrian islands, curb and sidewalk extensions, turn calming, and leading pedestrian intervals. Read more on each of these features in the report.

Percent change in pedestrian injuries and those killed or seriously injured (KSI). Source: NYC DOT

The results of the report show a massive impact from safe street design. In the above table, KSI stands for pedestrians killed or seriously injured. All the design features significantly reduced pedestrian deaths and injuries, with all but conventional bike lanes reducing pedestrian deaths and serious injuries by over 25 percent. These safety benefits were even more pronounced for senior pedestrians.

Percent change in driver injuries and those killed or seriously injured (KSI). Source: NYC DOT

The safety benefits also extended to motor vehicle occupants, with all the features but turn calming (which was affected by a small sample size) reducing injuries and deaths for motor vehicle occupants at nearly the same rate as pedestrians.

Street design as a core safety strategy

One of T4A’s core principles is to design for safety over speed. Read our full platform.

The cross-user benefits of safe street and road design are not unique to New York City. A review done by the Federal Highway Administration (FHWA) of rural roadways in Warren County, Pennsylvania and Augusta County, Virginia found that self-enforcing, safer street design led to fewer crashes. RAO Community Health, a nonprofit in the highly car-dependent Charlotte, North Carolina, has begun modeling the benefits of safer street design to the city’s most vulnerable communities.

Every year, more states and localities all around the country recognize the safety benefits of Complete Streets, adopting policies to promote their construction. The U.S. Department of Transportation has incorporated the principles of safe street design into their national Safe Systems Approach.

The core of the success behind design is simple: it slows vehicles down. The basic fact of the matter is that vehicle speed and road safety are opposing forces. The higher a drivers’ speed, the greater risk of fatalities. No amount of education, enforcement, or technology can make up for the fact that mistakes are inevitable. Safe street design can ensure that mistakes need not be fatal.

What’s next?

Advocates and governments should leverage the well-documented track record of safe road design in reducing crashes, injuries, and fatalities (both domestically and internationally) to push for its adoption in every jurisdiction around the country. The Vision Zero movement has done excellent work in shifting the paradigm toward design. Nearly 40,000 people were killed on our roadways in 2020. If the U.S. wants to cut down this unfathomable number of fatalities, every community will need to rethink its road design standards. 

Changes at the federal level could work to support these local efforts. For one, the FHWA needs to incorporate its Safe Systems Approach into its new Manual for Uniform Traffic Control Devices (MUTCD), the national standards for roadway design used by every jurisdiction around the country. Better national guidance on safe streets will encourage more localities to act. But it’s worth noting that the MUTCD is not gospel. State and local governments can design roads in any way they want. Advocates should remind their local officials of this fact.

In addition, FHWA must marshal all available federal funds toward safety projects. This includes not only small, safety-specific competitive grant programs like Safe Streets and Roads for All, but also broader programs like RAISE grants and federal formula dollars. We’ve outlined a strategy for federal safety spending here > >

Now you know what works, but how can you communicate the need for design to practitioners? Stay tuned for part III of this series, which will include useful advice on doing just that.

Eliminating driver error doesn’t work. What does? Part I

That's the temperature not the speed limit sign

Billions of dollars in new federal highway funding are flowing into road safety programs, so we wanted to review the research on which interventions can save lives on America’s roads—and which are failing to do so. All the available data tell us one thing clearly: strategies that fail to accept human error and reduce speeds also fail to reduce road casualties.

Much of the research in this post comes from a capstone project on transportation safety and enforcement by Mae Hanzlik, SGA Senior Program Manager of Thriving Communities, completed during her time at Johns Hopkins Bloomberg School of Public Health.

That's the temperature not the speed limit sign
Photo from WUWM via WisDOT’s traffic cameras

Around 40,000 people died on America’s roadways in 2020. Many state and local departments of transportation, encouraged by the National Highway Traffic Safety Administration (NHTSA), choose to address this crisis by educating drivers, increasing the enforcement of traffic laws, and promoting automated driving technology. But as Smart Growth America’s Dangerous by Design report notes, year after year, traffic fatalities continue to rise. Each of these approaches has its place, but they all have something in common: they focus on addressing human error, and they fail to acknowledge that mistakes are an inherent element of driving. 

This fundamental misunderstanding is fatal, leading to higher speeds and more roadway fatalities, increasingly in recent years. We’ve pulled together all the available data to set the record straight. Strategies that fail to accept human error and reduce speeds also fail to reduce road casualties.

This post is the first installment of a series on road safety programs. For design solutions that can make mistakes less fatal, watch for part II and III.

Education

One of NHTSA and state DOTs’ favorite traffic safety interventions is public awareness and education campaigns like the ones below. These types of slogans can be found plastered across billboards along most state highways and interstates, begging drivers to stop speeding. Advertisements like these are often accompanied by direct outreach through new driver education programs in high schools across the country.

Drive fast finish last ad
Image from NHTSA

Some public awareness campaigns, like those that encourage parents to secure their young children in child safety seats while driving, can be effective. But broader, more vague efforts to get drivers to slow down, make bicyclists wear helmets, or have pedestrians wear high-visibility vests have failed to reduce roadway injuries and fatalities.

State and federal regulators seem to believe that drawing a public connection between behavior and safety will encourage safer driver behavior. But a sweeping 2008 report from the National Cooperative Highway Research Program (NCHRP) found that “information-only programs are unlikely to work, especially when most of the audience already knows what to do.” Drivers know what unsafe behavior looks like, but on roadways that are designed to allow for speeding, doing so is often the most convenient choice. 

New driver education programs, despite being much better targeted at the needs of their audiences than general public awareness campaigns, are not much more effective. In a University of North Carolina evaluation of North Carolina’s Kindergarten-9th grade child traffic education program, researchers found that despite a “significant increase in students’ traffic safety knowledge…behavioral observations failed to reflect this increased knowledge.” 

Researchers have found the same phenomenon to be true for older teenagers in licensure programs, whose lessons learned in driver education programs have limited impact when they encounter roadway designs that incentivize unsafe driving. This stark difference between what young drivers are taught about driving the speed limit and the reality of roads built for speed creates a dangerous contradiction, which NHTSA itself readily admitted in a review of local programs. Of course, driver education programs are necessary to introduce new drivers to the rules of the road. But leaning on them as catch-all solutions to skyrocketing road fatalities is likely to be ineffective at best and counterproductive at worst.

Public safety awareness and education campaigns, often defended as benign public services, require a lot of cash. They cost federal and state agencies millions of dollars a year, money that could be better spent on evidence-based approaches to road safety.

Enforcement

Law enforcement plays a major role in today’s traffic safety paradigm. Police reports are the basis of most traffic violation data. And though cities like Washington, D.C. are trying to take traffic enforcement out of the hands of police officers by giving it to other agencies or automating it, most areas around the country require all moving violations to be enforced by uniformed, armed police officers. 

This approach often harms the communities it seeks to protect. Any limited ability that law enforcement has to make our roads safer is diminished by the harm that it causes in the process. Law enforcement officers killed over 400 non-violent drivers and passengers during routine traffic stops between 2016 and 2021. These impacts fall disproportionately on Black people.

Police reports are not accurate reflections of the causes of vehicle crashes. By nature, police reports focus on individual behavior, aiming to attribute blame to people involved. They fail to acknowledge the role of road design and vehicle size in crashes. For example, if a pedestrian is struck by a vehicle while crossing the street mid-block because the next crossing is a mile away, the police will often blame the pedestrian for not obeying the law. These faulty data lead policymakers to design solutions that try to correct for individual behavior rather than trying to better understand behavior as a symptom of a larger problem. 

Organizations like the American Public Health Association and the Center for Policing Equity have called for and suggested more equitable forms of traffic enforcement. New ideas like these are worth considering.

Technology

Since the invention of the automobile, improved vehicle safety features have saved countless lives. But most of these advancements, like seatbelts, airbags, and frontal and side impact testing have focused on the safety of those inside the vehicle in the event of a crash, doing little to prevent crashes themselves.

With skyrocketing fatalities among vulnerable road users (like pedestrians, cyclists, and wheelchair users), though, NHTSA and other authorities have championed some new driving systems, namely Advanced Driver Assistance Systems (ADAS) and Automated Driving Systems (ADS), as solutions. ADAS and ADS are technologies that can help drivers detect road obstacles and avoid them before the driver can react themselves. Companies like General Motors have even touted their features as a step toward a “vision of zero crashes.”

But the reality of these systems is a lot more complicated. Most vehicles equipped with ADAS or ADS allow drivers to disable those systems. A study by J.D. Power indicates that many drivers are opting to disable their ADAS or ADS out of annoyance. But even when ADAS or ADS are active, their safety benefits are dubious. These systems routinely fail to detect the presence of children, as well as people of color and those with disabilities. Children, people of color, and people with disabilities are far more likely to be killed as pedestrians, so these advanced driving systems have the potential to deepen the inequities on America’s roads. 

Tesla’s ADAS/ADS systems, some of the most popular on the road today, have resulted in hundreds of road fatalities each year. California’s Department of Transportation had to confront Tesla after that company’s ADAS systems, often advertised as fully autonomous vehicles, resulted in several manslaughter charges being filed against drivers that abdicated their driving responsibilities to their “autonomous” systems. 

So without significantly more regulations on ADAS/ADS, their benefits will be minimal and they might actually be counterproductive, since human error is nearly impossible to eliminate from the act of driving, at least with current technology. Policymakers should consider this fact before entrusting the safety of American roadways to new technologies.

So what?

The widely-accepted paradigm of changing driver behavior through education, enforcement, and technology is not making road users safer. So wherever these strategies are currently being implemented, policymakers and regulators should seriously consider whether they are accomplishing desired safety outcomes. Advocates should persistently ask their state and local governments: “Where’s the evidence that you’ve been able to reduce driver error?” Most of the time, the answer will be: “There is none.”

But calls to reduce these ineffective measures are likely to be ignored without alternatives that actually reduce roadway crashes. By accepting the fact that humans will make mistakes, we can plan for those mistakes and make all road users safer by preventing them. Stay tuned for part two and three of this blog series to see how design interventions can get at those solutions, and further advice for advocates who want to push for change.

11/2/22 edit: A previous version of this post erroneously cited a University of North Carolina study as an evaluation from the Transportation Research Board. This post has been updated.

Recruiting and retaining the best: Transit workforce best practices

Prospective applicants line up for a Sacramento transit hiring event

Transit agencies now have the federal funding needed to develop a world-class transit workforce, but pulling it off is another question. We’ve compiled strategies for success from agencies that have implemented real solutions to empower their operator and maintenance workforce.

Prospective applicants line up for a Sacramento transit hiring event
Sacramento residents line up for a job fair at their Regional Transit District (source: SacRT)

We wrote about the dwindling transit workforce last fall and earlier this spring, but here’s a quick summary.

When the pandemic started, transit operators were already strained by a stressful work environment and long, unpredictable hours. The pandemic presented new challenges, not the least of which was a lack of ridership that left transit agencies strapped for funds. As agencies tried to cope operators were let go, or they saw their wages/hours significantly reduced even as their jobs grew more difficult than ever. (Check out TransitCenter’s report on Bus Operators in Crisis to understand how difficult these jobs have become.)

Now, as ridership is rising, agencies are finding themselves without the necessary staff to meet demand. We’ve made some suggestions before about how to fill this crucial need and keep it filled—in short, transit agencies need to properly invest in their workforce and provide them with the support they require, even through periodic tough times. But right now, as federal funding helps to fill agencies’ wallets, how can they recruit transit staff?

We spoke with transit agencies that are trying to understand their staff and use innovative recruitment strategies to address their workforce needs. Here’s what we heard.

Understanding the employees’ experience

To better understand their employee retention hurdles, Bay Transit of Middle Peninsula Virginia decided to deploy an employee survey. They evaluated employee perceptions of workplace attributes (such as benefits, competitive wages, and less concrete ideas like agency trustworthiness) and identified gaps between employee expectations and Bay Transit’s actual performance. This information helped them determine what their employees needed from them and how they could be a more competitive workplace.

Further down the Chesapeake Coast in Hampton Roads, Virginia, Hampton Roads Transit (HRT) took a more direct approach to employee engagement, this time with a focus on its management team. Like most transit agencies, operators were welcome to attend and speak with the agency’s management team. But many HRT operators did not have the time or means to schedule and/or attend these meetings, and often had no idea how to engage their management at all. So the management team decided to visit the system’s bus depots and in-service vehicles to speak with operators about the issues they were dealing with on the job. This experience allowed them to become better advocates for their employees when speaking with the agency’s governance board and provide their workforce with the support it needs.

More support for current workers

Even before the COVID-19 pandemic, the Missoula Urban Transportation District, or Mountain Line, in Missoula, Montana was in a labor free fall. They were understaffed, with remaining employees facing high burnout and low morale, while voters had approved a transit expansion that was going to require a 30 percent workforce increase. Voters acknowledged that an expansion required increased funding for transit but were unsure of the most impactful ways to spend the funds. In 2021, Mountain Line was only able to retain 50 percent of its new hires. They were going the wrong direction.

In the fall of 2021, Mountain Line developed a new strategy. First, its board decided to use part of the new funding approved by votes to increase wages 15 percent across the board, a massive jump in pay that allowed them to compete with other employers in Missoula. This also made their employees feel more valued. Mountain Line found this strategy to be the most effective for recruitment. They also invested in improving the internal culture for their workforce by initiating a Diversity and Inclusion Committee and improving internal communications. (Read more about Missoula’s efforts to turn the corner on employee retention on page 16 of the Passenger Transport magazine.)

Overcoming barriers to recruitment

Photo from Wikimedia Commons

There are many reasons people do not apply to be transit operators. As a transit rider, the job can appear difficult and thankless. Des Moines Area Regional Transit (DART) tried to do something about that by allowing people to test drive buses to see whether they were comfortable behind the wheel. They invited people to the Iowa State Fairgrounds to test drive a 40-foot long bus through an obstacle course. At this event they also advertised a $3,000 sign-on incentive to new drivers with a Commercial Drivers License (CDL) and a $2,000 sign-on incentive to new drivers without a CDL. 

The IndyGo transit system in Indianapolis realized they were losing out on applicants with non-violent criminal records. Many of these applicants were well-prepared to be transit operators or mechanics, but they were blocked from working for IndyGo by a rule that had no bearing on their ability to do the job. So IndyGo created the Second Chance hiring initiative to help level the playing field for applicants who may be highly qualified but have had a criminal conviction.  

Back in Hampton Roads, HRT has tried to boost their dwindling recruitment numbers by forming a partnership with Tidewater Community College to create the Drive Now program. Drive Now provides free training to prospective transit operators that includes a CDL, a Virginia Career Readiness Certificate, and customer service and workplace skills. These skills and certifications can be expensive to acquire on one’s own, so Drive Now helps pave the way for new applicants to find jobs in transit.

Finding hires in unexpected places

When the Alexandria Transit Company (DASH) found themselves with a shortage of trained technicians to service their buses, they looked beyond their recruitment practices to where those practices were being implemented. They were mostly targeting experienced diesel technicians from heavy vehicle industries with similar skills that are needed for bus maintenance. DASH soon realized, however, that this applicant pool was too narrow to meet their capacity needs, so they widened their search to include technicians from outside fields (mostly automotive) with comparable skills and similar foundations. This brought in talent that may not have discovered careers in transit and reduced the barrier to entry. When veteran operators trained new hires to become diesel mechanics, they discovered that they also deepened their own knowledge and skill.

To address its recruitment issues, the Sacramento Regional Transit District (SacRT) turned to its riders. They advertised free rides for anyone that attended hiring events. These riders were familiar with the system, and many were comfortable being trained to operate its buses.

Developing a workforce for the future of transit

Perhaps the newest frontier of transit workforce development is in operating low and zero-emission vehicles. On Tuesday, August 16, the Federal Transit Administration (FTA) announced the first round of 150 grants awarded under the Low- and No-Emission (Low-No) and Bus and Bus Facilities programs. The Low-No program requires grantees to 1) create Zero-Emission Fleet Transition Plans and 2) spend 5 percent of award money on workforce development training, including apprenticeships and other labor-management training programs as recipients make the transition to low or no emission vehicles. 

This workforce development requirement yielded some innovative recruitment and training ideas. One example is Omnitrans in San Bernardino County, California, which will spend part of its $9.3 million award to launch its comprehensive workforce development program (under its strategic plan) to increase compensation, improve professional development, provide stability, and improve the internal culture. Another example is MARTA in Atlanta, which will use part of its $19.3 million award to support its 2-year apprenticeship program and collaborations with local technical colleges.

So what?

Though local actors are producing innovative solutions, national problems persist. Transit operators face rising rates of assault from riders. Operators are still recovering from the increased stress of the worst part of the COVID-19 pandemic. Many transit labor forces, even in massive systems like Amtrak, remain overworked and understaffed

The money to fix these issues is available. The new infrastructure law provided numerous funding streams for workforce development, including the Low-No Program. Also, the U.S. Department of Transportation will now cover 100 percent of the cost of workforce development programs if they are paid for out of the ample-funded highway formula programs. 

The time to take decisive action is now. The communities that succeeded often did so because of proactive engagement and collaboration between local advocates and their public officials to explore and implement innovative solutions. It will be up to local administrative and political will to implement the proven strategies laid out in this article.

Reconnecting Communities: Initiating restorative transportation justice

Much of the work of smart transportation focuses on playing defense against divisive infrastructure projects that would make travel more difficult. Now, communities and advocates have a small but real opportunity to go on offense and remove or mitigate harmful stretches of transportation infrastructure.

I-10, the Claiborne Expressway, divides the Tremé neighborhood in New Orleans. Flickr photo by Congress for the New Urbanism.

Program overview

On June 30, 2022, the US Department of Transportation (USDOT) released a notice of funding opportunity (NOFO) for the Reconnecting Communities competitive grant program (RCP). States and localities can apply for funding to remove, retrofit, mitigate, or replace an existing expressway, viaduct, principal arterial, transit or rail line, gas pipeline, intermodal port, or an airport that creates barriers to communities. They can also apply for funding to plan such projects.

States and cities have always been allowed to use federal funds for reconnecting communities, but these funds can be used for a variety of purposes, and more often than not, decision makers have opted to build new infrastructure instead of repairing past mistakes. The RCP is unique because it cannot be used for other purposes—it can only be used for the narrow purpose of undoing or mitigating the damage caused by divisive infrastructure, giving advocates a great opportunity to rally local support for reconnection projects.

Removing harmful road infrastructure is important, but so is making space for the community to design what replaces those roads. Grants that include equitable design, community partnerships, intermodal mobility benefits, and anti-displacement strategies are most likely to be selected by USDOT. Full details on these criteria are included in the NOFO.

A tested solution

Projects to reconnect communities are not a new idea. During the interstate highway boom of the 1960s, the city of Rochester, New York constructed a network of highways throughout the city, including the Inner Loop, which destroyed much of the heart of the city. Like in most American cities, this destruction primarily targeted black neighborhoods. 

In 2017, local officials in Rochester decided to try to make things right. They used a combination of federal and local money to convert two-thirds of a mile of Inner Loop East—12 lanes of expressway and frontage road—into one two-lane low-speed street, eliminating bridges and retaining walls while freeing up six acres of land for new development. 

The project was a massive success for both the city budget and local development. It produced $229 million in economic development from only $23.6 million in public investment. It led to a 50 percent increase in walking and 60 percent increase in biking in the surrounding area. On the new land freed up by removing the highway, developers have since built commercial space and 534 new housing units, about half of which are affordable. The removal of Inner Loop East was so successful that the city is now planning to remove another stretch: Inner Loop North.

Rochester is not alone. Syracuse, New York is planning to convert a 1.4-mile stretch of I-81 through its downtown into a “community grid.” Near downtown New Orleans, residents of the historically black Tremé neighborhood have battled for years to remove the stretch of Claiborne Expressway (I-10) that runs through their community (pictured above). The Freeway Fighters Network includes even more communities looking to cap, remove, or even prevent divisive infrastructure.

Every city in the U.S. can benefit from highway removal because every city has its own history of communities being demolished and isolated due to roadway construction. The RCP provides an opportunity for advocates and officials alike to listen to marginalized communities and apply for funding to implement what they need. Rochester and Syracuse can be used as models, but every community will have the flexibility to find an approach that meets their specific needs.

The program’s limitations

The RCP can fund important, restorative projects, but its resources were severely limited by Congress. The program only has $1 billion to give out over the next five years. So this year, USDOT can only award $195 million in grants. For capital construction grants, the minimum grant is $5 million, and USDOT anticipates grants ranging from $5 million to $100 million apiece. So while we do not know the exact number of grants that will be awarded this year, it will likely only be a handful. Planning grants will be awarded at a maximum of $2 million.

USDOT knows funding is tight, so they will designate projects that are well deserving but need more than they can offer as “Reconnecting Extra.” When projects with the Reconnecting Extra status submit future applications for competitive grants like RAISE, they will receive favorable consideration from USDOT. Likewise, if the project is pursuing a TIFIA or a RRIF loan, USDOT will work to consider additional assistance permissible under those loan programs.

We would like to see this program funded more substantially, but the president’s budget and current Congressional Appropriations bill for fiscal year 2023 only allocated the bare minimum. For now, advocates will need to fight hard to make sure their city is selected and demand states and cities make proper use of other federal funds to close the gap.

Transportation for America members have access to exclusive resources that provide further detail on this topic. To view memos and other members-only resources, visit the Member Hub located at t4america.org/members. (Search “Member Hub” in your inbox for the password, or new members can reach out to chris.rall@t4america.org for login details.) Learn more about membership at t4america.org/membership.

The STB is finally acting to improve freight railroads. Will it be enough?

Freight train
Freight train
CSX freight train passing through Bay St. Louis, Mississippi Credit: Mississippi Today

After years of looking the other way while deliveries suffered, the Surface Transportation Board finally ruled that freight railroads have to improve their service. Here’s what it could mean for goods and travelers alike.

On Friday, May 6, the Surface Transportation Board (STB) issued a ruling that will require the largest (Class I) freight railroads to improve their anemic service nationwide. These companies are BNSF Railway, Kansas City Southern Railway Company (KCS), CSX Transportation, Inc, Norfolk Southern Railway (NS), Union Pacific Railroad (UP), Canadian National Railway (CN), and Canadian Pacific Railway (CP). 

Under this latest STB ruling, the four Class I carriers with the most significant problems—BNSF, CSX, NS, and UP—will need to submit service recovery plans detailing the specific actions they’ll each take to improve service, including the specific metrics they’ll use to evaluate their progress. Those four will also have to participate in biweekly conference calls with Board staff to ensure they are making significant progress. All seven Class I carriers will be required to submit weekly performance data and monthly employment data to the STB. The STB will receive technical assistance from the Federal Railroad Administration (FRA) in its implementation of this ruling.

Turning the tide

For years, the major freight railroads have trimmed their workforce and overworked remaining staff to report larger profit margins to shareholders, all without regard for service quality. The pandemic has worsened this issue, causing frequent and extended delays in delivery time for key goods and services. For such a critical national system as freight rail, this has been an economic disaster. 

On April 26th and 27th, the four relevant freight railroads testified in front of the STB and admitted their poor service, but they tried to blame national trends and claim they could fix the issues on their own. However, the testimony they gave, such as frequency data that was contradicted by video evidence, was often uninformed and irrelevant, calling into question the validity of their commitments to improve service. The STB likely felt the same, as this aggressive ruling reflects a lack of faith in the freight railroads to address the current crisis.  

Though this ruling is not surprising, it is encouraging. We are pleased to see the STB finally exercising their oversight in a clear and demonstrable way, revealing their intent to monitor and fix this endemic issue. They have always had the authority, but have historically been far too lenient on the freight railroads, which allowed the situation to get to its current point. 

On May 12th, STB chairman Martin Oberman testified in front of the railroad subcommittee of the House Transportation and Infrastructure Committee, where he laid out a vision for a more aggressive STB. He said the STB can and must go further than rulings like this one, and said that “the Board can use its existing authority to mitigate [the problems facing the rail industry] in a meaningful way.” 

We should take these bold statements with a grain of salt. The freight rail industry has not been interested in complying with federal regulations unless forced to do so, so this will likely be a long and drawn out fight despite Chairman Oberman’s commitment to a rapid timeline.

But still, such a bold step from the STB signals a paradigm shift. In the past, the STB has been all but powerless to stop the dominance of the freight railroad companies over the national rail network. But a network so critical to national security should be regulated accordingly, and the STB seems to finally be arriving at the same conclusion.

Impact on passenger rail

This ruling and its implementation might have some benefits for passenger rail, too. For most of the national network, passenger rail service runs on rail owned by the Class I carriers. So if freight railroads continue to be required to improve service, it might improve conditions on the nation’s rail network enough to support improved passenger rail service. In fact, in Chairman Oberman’s testimony, he added that he remains “confident in the Board’s preparedness to meet its responsibility to enforce on-time passenger rail performance.”

The infrastructure law is not climate legislation, but states could make it green

A man observes a stretch of Dock Street in Annapolis, Md., that flooded after the area received over three quarters of an inch of rain in 24 hours on Jan. 25, 2010.
On Jan. 10, 2015, Dock Street in Annapolis, MD flooded after receiving over three quarters of an inch of rain in 24 hours. Flickr photo by Matt Roth/Chesapeake Bay Program

Though distinctly not serious about fighting climate change, the Infrastructure Investment and Jobs Act (IIJA, the infrastructure law) can still help lead to some decent climate outcomes if states and metro areas make the choice to prioritize doing so with their flexible funding.

promo graphic for a guide to the IIJA

This post is part of T4America’s suite of materials explaining the 2021 $1.2 trillion Infrastructure Investment and Jobs Act (IIJA), which governs all federal transportation policy and funding through 2026. What do you need to know about the new infrastructure law? We know that federal transportation policy can be intimidating and confusing. Our hub for the new law will walk you through it, from the basics all the way to more complex details.

The most recent report from the International Panel on Climate Change warns us that even with the most aggressive emissions reduction strategies, global warming will more than likely exceed 1.5°C in the near term. So emissions reduction strategies that can prevent even more destructive consequences from greater global warming are urgently needed, but we also need to prepare our communities for the disastrous effects of climate change that are already hitting much of the country. 

That is why this post will focus on how the federal government and its state and local grant recipients can use money from the infrastructure law to:

  1. reduce greenhouse gas emissions from the transportation sector, and
  2. make our transportation infrastructure, especially in our most vulnerable communities, adaptive and resilient to the all-but-inevitable effects of global climate change.

Both of these strategies are essential to reach the Biden administration’s climate goals and save Americans from the worst of climate change.

Emissions reduction

How and where the infrastructure law money is spent will have a massive impact on whether it is able to reduce greenhouse gas emissions. In addition to the bill’s separate $46+ billion dedicated toward resiliency and new climate-focused programs outlined below, states and metro areas are free to spend much of the law’s $650 billion in surface transportation money on climate-friendly projects like transit, active transportation, or repair, thanks to the broad flexibility built into the law. But it could just as well be spent on expanding roadways, inducing more demand for driving and thus increasing greenhouse gas emissions. 

It all comes down to what states choose to prioritize, and how they direct their money. Here’s what we mean, via two potential future scenarios of IIJA spending, courtesy of the Georgetown Climate Center (GCC):

pie chart graphics
Analysis and chart by the Georgetown Climate Center

In the high-emissions scenario (left), highway expansion outpaces highway repair, encouraging yet more driving and doubling down on a system where a car is required just to participate in the economy. But the low-emissions scenario (right) heavily prioritizes repair and shifts five percent of funds toward transit, providing room for communities to provide for multimodal accessibility and move away from a dependence on cars. (According to the GCC, our recent spending/priorities are somewhere in between these two scenarios.) Both scenarios are legal and valid uses of infrastructure law money, but represent two radically different spending approaches.

But only one of these scenarios will bring a net decrease in transportation emissions:

bar chart graphic element
The change in transportation emissions over the next 20 years, with zero representing the levels we were set to hit without the new infrastructure law. The vertical axis is measured in cumulative million metric tons (MMT) of CO2. Analysis and chart by the Georgetown Climate Center

When one-tenth of a degree of warming could make the difference in extreme weather events, the difference between these two scenarios is massive. Especially when the GCC’s model predicts that the high-emissions scenario would in fact substantially increase emissions above where we would be without the infrastructure law.1

Each of the largest formula grant programs (like the NHPP and STBG) and every other program with broad eligibility can and should be used to reduce emissions by enabling modes of travel other than cars. In fact, most of the infrastructure law’s funding could be marshaled toward either of the scenarios, so we will not list every specific program in this post. Check out our IIJA hub for guides on how to make sure the low-emissions scenario wins out, category by category. But three climate-focused programs are worth noting:

The Congestion Mitigation and Air Quality Improvement (CMAQ) Program: This formula grant program is funded annually at about $2.6 billion (up from $2.4 billion) and can be used for a wide range of projects that reduce congestion and therefore air quality. The IIJA allows states to spend CMAQ funds for operating public transit and shared micromobility, including bike share and shared scooter systems, as well as for the purchase of medium- or heavy-duty zero emission vehicles and related charging equipment.

The Carbon Reduction Program: States receive more money overall under the IIJA, but this new program requires them to set aside about 2.56 percent of their total apportionment toward reducing transportation emissions. There is a loophole, though: states can redirect this money into their highly flexible STBG funds if the Secretary certifies that the state has reduced transportation emissions on a per capita and per unit of economic output basis. (More about fixing this loophole under “what the administration can do” below.) Of the new carve-out, 65 percent of the program’s funds are to be allocated by population in the state, whereas the remaining 35 percent is at the discretion of states. For areas with populations over 200,000, the metropolitan planning organization (MPO) administers that 65 percent local share of program funding for eligible projects. These can include planning, designing, and building on- and off-road active transportation facilities and improvements to the roadway right-of-way to facilitate reductions in transportation emissions and congestion.

Reduction of Truck Emissions at Port Facilities Program: This new discretionary grant program, funded at $400 million over five years, will be distributed to America’s ports so they can invest in technology and operational efficiencies to reduce emissions from idling trucks. They can also use the money to electrify their operations and conduct the required workforce development and training therein.

Adaptation and resilience

Catastrophic hurricanes, heat waves, flooding, and other extreme weather events devastating American communities have become more frequent due to climate change and will happen more often as global warming worsens. So while we reduce emissions, we must also work to protect people from these events, with a focus on the disproportionate impact of climate-related disasters and public health hazards (like urban heat islands) on marginalized communities. The kinds of adaptation and resilience resources outlined below should focus first and foremost on these communities. The EPA’s action on clean water justice is a good model for environmental justice in climate resilience. 

The National Highway Performance Program (NHPP), which accounts for over half of all Highway Trust Fund formula program spending, expanded its mission to address resilience, clearing the way to use these highway dollars to upgrade or repair existing assets to make them more resilient. It is still only an option on a menu of uses, but advocates can now pressure states to use NHPP funding for this newly stated purpose: “mitigate the cost of damages from sea level rise, extreme weather events, flooding, wildfires, or other natural disasters.” 

The most direct funding mechanism for adaptation and resilience is the Promoting Resilient Operations for Transformative, Efficient, and Cost-saving Transportation (PROTECT) Program. Split between competitive and formula grants, the program is designed to help communities anticipate, prepare for, and adapt their transportation systems to natural disasters. The $7.3 billion (over five years) formula portion can be used by states and MPOs to build more resilient roads, transit, or ports, such as through the elevation or hardening of key infrastructure, as well as adjacent infrastructure like flood gates and culverts. The competitive grants, funded at $1.4 billion over the next five years, can be used for many of the same purposes, with more of a focus on access to services and evacuation routes. 

The Healthy Streets Program is a competitive grant program that dedicates $100 million a year (subject to annual appropriations) to address the urban heat island effect. Local, regional, tribal, and state governments can apply for funding to make improvements to tree canopies, porous pavement, and other cooling projects.

Many states like Rhode Island have found federal flood mapping inadequate to capture evolving risk, so the law provides the National Oceanographic and Atmospheric Administration (NOAA) with $492 million to develop improved flood mapping and water modeling which could inform critical areas for future resilience investment. This will improve existing resources like the Sea Level Rise Viewer (which you should check out if you have not).

Finally, USDOT will provide for the establishment of 10 regional Centers of Excellence for Resilience and Adaptation and one national Center of Excellence for Resilience and Adaptation, each receiving $5 million annual grants to research resilience and adaptation technology, support data collection, and develop new approaches to keeping our communities safe.

How else could the administration advance our climate goals?

Other than prioritizing projects that do the most to lower emissions when awarding competitive grants, the Biden administration can pull a couple other administrative levers to make sure that federal action is oriented toward a lower-emission future. 

As noted above about the Carbon Reduction Program, the Secretary of Transportation can allow states to divert CRP money to their highly flexible STBG pot, likely resulting in projects that will lead to much higher transportation emissions. So USDOT needs to codify strict guidelines for determining sufficient emissions reductions before allowing states to shift these funds—protecting against a future administration allowing states to fund projects that do not actually lower emissions.

Any efforts to address climate change should focus on those who are and will be most burdened by its effects. Some essential steps include focusing on communities with a history of underinvestment, addressing comorbidities like asthma and heart disease, and accounting for flooding vulnerabilities in marginalized communities (and conversely, climate change-induced gentrification in marginalized communities). The administration should continue to push guidance to include those strategies in formula and discretionary grant distribution.

USDOT should require clearer and more robust data for the public on transportation emissions. For one, induced demand should be included in transportation growth modeling. Also, USDOT should track transportation emissions per capita by state and publish results and trends online. They should include emissions reduction from the system, not just vehicles.

So what?

Many of the Biden administration’s most serious emissions reduction policies were in the (stalled) Build Back Better Act, but the future of that bill is uncertain and advocates should continue to push for emissions-slashing transportation policies not only at the federal level, but state, regional, and local level. 

The infrastructure law largely gives states the flexibility to do what they like with climate-related money. So now, the onus of lowering greenhouse gas emissions and making our communities more resilient falls to states and localities. Whether you are a planner, a legislator, an advocate, or a concerned citizen, now is the time to raise the alarm and make sure infrastructure money is spent in a way that minimizes the impact of climate change on American communities.