About Steve Davis

Stephen Lee Davis is the AVP for Transportation Strategy at Smart Growth America.

58-year-old bridge collapses in Washington State on west coast’s most major interstate

Shortly after the evening commute last night (around 7 p.m. local time) an entire section of the Interstate 5 bridge  — both north and southbound lanes — over the Skagit River an hour north of Seattle, Washington collapsed and fell into the river, sending two cars tumbling down into the river, injuring three yet miraculously killing no one. One of those who plunged into the river along with his wife called it a “miracle” that no one was killed or more severely injured.

From the Seattle Times:

Rescuers pulled three people with minor injuries from the water after the collapse, which authorities say began when a semitruck with an oversized load struck a steel beam at around 7 p.m.

That caused a massive piece of the northern side of the bridge to wobble, and then fall into the water, taking with it a gold pickup, its travel trailer and an orange SUV.

Rescuers did not believe there was anybody else in the water but were planning a morning search to be sure.
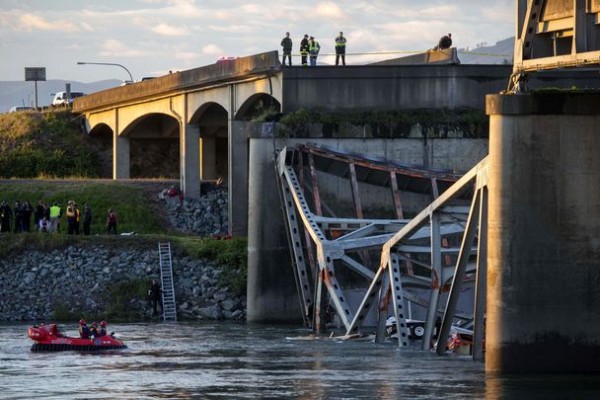
Seattle Times Bridge Collapse
Seattle Times photo by Dean Rutz. Link to gallery of images here.

Perhaps the most amazing part of this story is that on a bridge that carries more than 70,000 cars daily and at a time of day when traffic could be expected to be moderate at the least, only two vehicles fell into the yawning gap and into the water. Along with everyone else, we at T4 America are relieved that no one died in this tragic bridge collapse.

Just like several years ago in Minnesota, attention quickly turned to the bridge itself. So what do we know about it today?

The Interstate 5 bridge over the Skagit River actually predates the creation of Interstate 5. It was built to carry old US 99 over the river in 1955. When Interstate 5 was built in 1957, it largely followed the US 99 corridor and just like many other bridges, this bridge was folded into the interstate system, though it certainly wasn’t built to today’s interstate standards.

Because of that (and likely other design considerations), the bridge was considered “functionally obsolete” by state and federal inspectors, which is a designation that could mean any number of things, none of which have anything to do with structural safety. The lanes could be narrower than today’s standards, the weights allowed could be less than an interstate bridge built today, or built using materials that would be considered obsolete today.

However, the bridge was not considered “structurally deficient” at the time of collapse, which means that a bridge requires repair, rehabilitation or replacement, along with much more regular inspections. To be considered structurally deficient, one of the three major components of a bridge (deck, superstructure, substructure) has to score a 4 or below on a scale of 1-10.

The data in our interactive map is not the most recent release of federal data, but the ratings for this specific bridge have not changed in the federal National Bridge Inventory that was reported in early to mid 2012 by Washington State. WSDOT likely inspected the bridge again sometime in 2012 after they reported annual bridge data to the federal government, and WSDOT is saying publicly today that the bridge was not structurally deficient and was still only considered functionally obsolete.

Here’s the snapshot from our interactive map of U.S. bridges, which you can use to look up the condition of the bridges near any U.S. address.
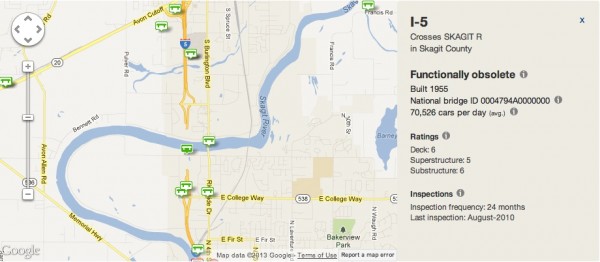
Skagit bridge collapse interactive map screenshot

(Amazingly, you can see that Google Maps has already updated their map to show that Interstate 5 no longer crosses the Skagit River.)

On a list of structurally deficient bridges in Washington compiled by WSDOT in September 2011, this bridge is not included, though there is at least one other nearby Interstate 5 bridge in Snohomish County that is included, built in 1933. (It’s scheduled for repair, per WSDOT.)

It’s hard to accurately describe how crucial this interstate connection is. I-5 runs from Canada to Mexico within the U.S. and touches almost every single major city on the west coast. It’s a vital corridor not only commuters but also for freight traffic — 12 percent of the daily traffic on this bridge was truck traffic. And this is the main route from Seattle up to Vancouver, certainly a direction that many Seattle region residents might have been planning to travel for the long holiday weekend starting this afternoon.

Those plans are surely on hold, and the ripple effect for freight and other travel up and down the west coast will be felt for some time to come as Washington authorities decide how to handle this painful gap in their transportation network.

We will be back later this morning with a short statement, and follow us along on twitter at @t4america for other news and developments.

PS, here’s the cover of the Seattle Times this morning.
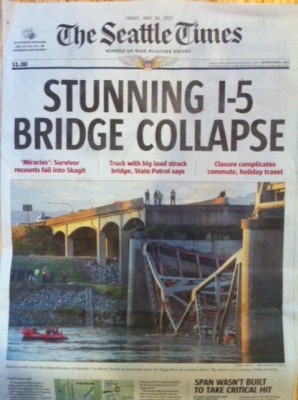
Seattle Times bridge collapse cover

Update: this post incorrectly said the bridge 63 years old at first publication. That has been corrected.
NPR: 19 states (and counting) creating plans to raise more transportation dollars

More than a third of all U.S. states have plans of some sort to raise new money for transportation to help cover yawning budget shortfalls and keep up with maintenance and new construction of their state transportation networks.

NPR picked up the story this week that we’ve been following very closely and spent some time talking to T4 America director James Corless about the growing trend of states stepping out on their own to raise their own money for transportation to augment the federal funding that did not increase with the last transportation bill.

One major reason federal transportation funding did not increase is that “cars are getting more efficient, and people are actually driving less,” James Corless told NPR. “So that has conspired really to put less revenues into these state and federal funds — trust funds out of the gasoline tax. So purchasing power is declining, and so states are getting creative,” he said.

Listen:

From the story:

According to figures released by Transportation for America, which advocates for modernizing the nation’s infrastructure, 19 states have approved or are considering legislation to increase transportation funding.

One creative approach was taken by Virginia, which actually eliminated its gas tax while raising sales taxes and imposing a tax on wholesale fuel. The state is also allowing the congested Northern Virginia and Hampton Roads areas to raise their own tax revenue.

Republican William Howell, the speaker of the Virginia House, helped broker the deal. “It was a true compromise,” he says. “As with most any compromise, no one’s 100 percent happy with every feature of it. There are some things that I’m not crazy about. I’m sure there’s some features that other people don’t relish. But we had to do it.”

Though a third of all states do have some sort of proposal in the works, they’re all certainly not created equal. Ohio is looking to borrow more than a billion dollars against future turnpike revenues to build yet more roads. Gov. Walker in Wisconsin wants to borrow $1.2 billion and repay it with dwindling trust fund dollars and general tax revenue. A bill in Indiana would allow Indianpolis counties to tax themselves and invest that money in transit. Massachusetts has a plan to raise as much as a billion dollars a year for multimodal needs, including budget relief for their amazingly indebted transit agency.

Want to learn more and see what your state is planning, if anything?

Visit our home for state plans here.

Tracking state transportation funding plans

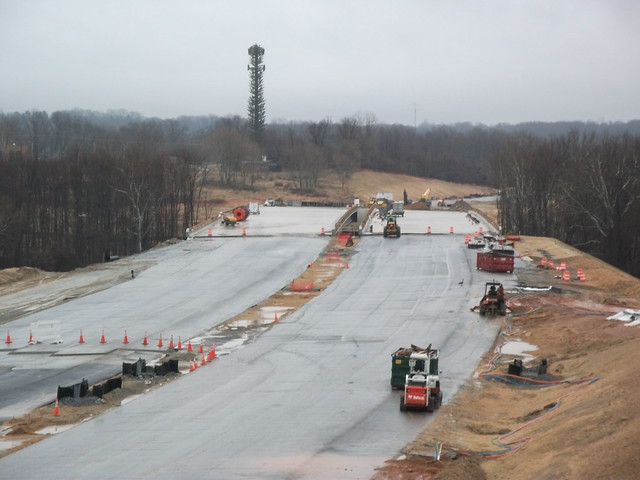
Maryland State Route 200 CC Flickr photo by DougtoneWith MAP-21 signed into law last summer, attention has shifted from Washington out to the states.

In many cases, states have looked at the bottom line in MAP-21 and are deciding that they need more money for transportation and are embarking on ambitious and often groundbreaking plans to raise additional revenues for transportation.

Visit the home for state plans here, where we’re tracking all of the proposed (and enacted) plans in one easy, simple chart. If you see something we’ve gotten wrong or a state we should add, drop us a line and let us know.

And don’t miss our series of posts examining the plans and debates in a few key states.

Senate budget lays the groundwork for fairer, increased transportation funding

We’ve previously written about how Amtrak passenger rail, new public transit construction and the innovative TIGER program just had their budgets slashed in sequestration at a rate five times higher than traditional highway programs. That was due to the fact that those programs generally get their money from the general fund, and highways are funded through a protected trust fund. (Read that linked post for the details.)

There’s no way to prevent those cuts this year, but the Senate’s new budget for the next ten years — the first they’ve approved in years — lays the groundwork to create dedicated funding for transit, passenger rail and the innovative competitive TIGER projects, as well as generating new revenues for transportation.

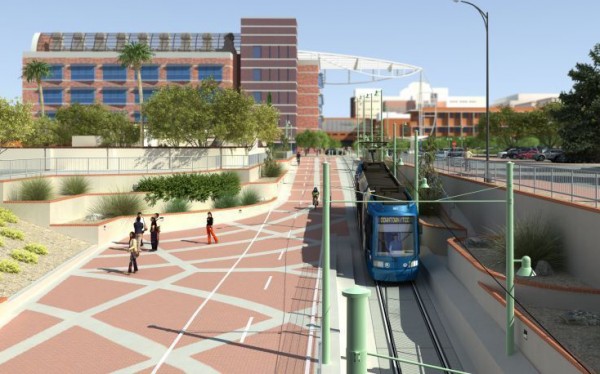
Tucson Streetcar rendering
The Tucson, Arizona streetcar is being funded both by a TIGER grant and New Starts money

Can you take a minute to thank the Senate for recognizing the importance of 21st century transportation investments and urge Congress to build on this budget and find new revenues for transportation while protecting these important programs?

At a time when transportation funds aren’t keeping pace with what we need to maintain AND build, the Senate’s bold plan could very well become the foundation to raise new money for transportation and create dedicated revenues for programs that help give us new options for how to get around.

Sequestration disproportionately cut the very programs that do the most to provide all of us with more ways to get around — new streetcars or bus rapid transit lines, competitive TIGER grants for innovative projects all over the country, and passenger rail that’s continuing to break ridership records.

The Senate’s plan could be the beginning of a new unified trust fund or a tax reform plan that raises new money for transportation — which could help protect these programs from these kinds of disproportionate cuts they just received.

So let’s make sure that the Senate and the House know that we need to both increase investments in transportation and protect the money that gives us more options for how to get around.

Take action today.

Ambitious Maryland plan moves forward to index gas tax, add sales tax for transportation

When Maryland’s Intercounty Connector (ICC) highway opened in 2011, it did more than create a new east-west toll road between I-270 and I-95 in the northern suburbs of Washington, DC: It also severely hampered Maryland’s ability to build other large-scale transportation projects for years to come.  But now there’s significant momentum to raise new state revenues for transportation to ensure that the state won’t have to shelve their plans for a 21st century transportation system.

Update 4/3/12: The Senate passed the House bill (HB515) last Friday, heading to Gov. O’Malley for his signature. The separate “lockbox” bill will require a conference to reconcile the differences in House and Senate versions.

With MAP-21 out the door, attention has shifted from Washington to the states. In many cases, states are deciding that they need more money for transportation and are embarking on ambitious and often groundbreaking plans to raise additional revenues for transportation. This post is part of a longer series we’ll be doing in 2013 examining how states are addressing the need for more transportation dollars, along with key policy changes. Visit the home for state plans here, where we’re tracking all of the news. – Ed.

While half of the ICC’s almost $2.6 billion cost was paid for with future tolls that don’t really impact the state’s transportation budget year to year, the other half ($1.3 billion) was covered by sources that have huge impacts on Maryland’s ability to build any other significant large transit or road projects.

The state spent $265 million in general funds and though the $180 million from the state’s Transportation Trust Fund represents only about 10 percent of what the state gas tax and vehicle fees bring in each year, Maryland is also devoting $750 million in future federal funds they haven’t yet received to the project — or almost 130 percent of what the state receives from the feds each year for all of their state highway needs. ($580 million in FY12.)

That means that a large share of Maryland’s future federal transportation dollars under MAP-21 — which itself represents a loss in real dollars over previous transportation bills — are already spoken for by this mammoth project.

Maryland State Route 200
The ICC under construction in 2011, Creative Commons Flickr photo by Dougtone.

Even without building the ICC, like a lot of states, Maryland would certainly have to make some tough decisions. But with it, it’s easy to understand how state and independent analysts have been saying that by 2018, Maryland will only have enough money to cover maintenance and repair, making it nearly impossible to fund any new highway projects or any of the long-awaited and much needed public transportation projects, including the new Red Line subway in Baltimore, the Purple Line rail link for Metro and the innovative Corridor Cities Transitway rapid bus line in the DC region.

Get Maryland Moving, a new coalition of advocates of all stripes from across the state, coalesced around the urgent need to keep these worthy projects (and many others) from being relegated to a perpetual “wouldn’t that be nice” wish list, providing Marylanders with other options for getting around, and ensuring that Maryland doesn’t have to cease all investment in their transportation network.

Since the (state) gas tax was set at its current level of 23.5¢ in 1992, construction costs have doubled, according to this report from the CA DOT. Simply put, just like the federal gas tax that was last increased in 1993, inflation has far outpaced the value of the gas tax, and with Americans driving fewer and fewer miles each year in more fuel efficient vehicles, they each bring in less revenue.

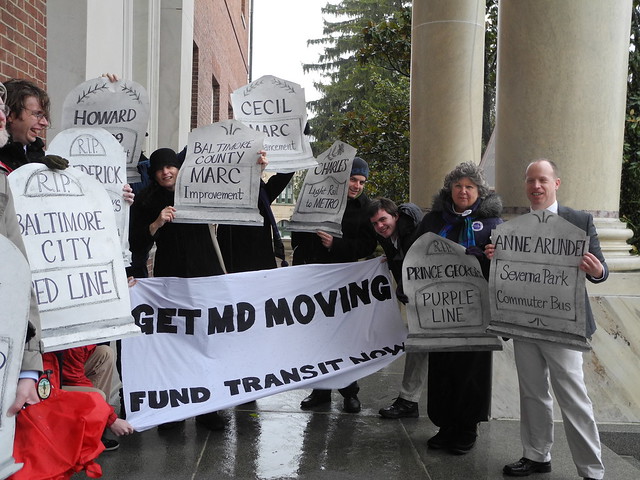
DSCN2525
A rally in Annapolis at the State House organized by Get Maryland Moving in March 2013.

Urged along by the diverse Get Maryland Moving coalition, the current proposal started from a plan put forward by Governor Martin O’Malley, the President of the Senate and the Speaker of the House, though it has been modified as it has moved through the state legislature. The House passed the bill (HB1515) just last week, and the Senate is due to debate and vote on it soon.

You can view the Governor’s initial plan on our page of state transportation funding plans, but here is the deal as it currently stands in the Maryland legislature. The plan would:

  • Index the gas tax to inflation starting immediately (with a ceiling of 5 cents maximum increase in any given year.)
  • Add a three percent sales tax at the gasoline pump, phasing that in over a period of three years starting this summer.
  • There are other provisions that could change the sales tax rate on gasoline that have to do with internet sales tax. In short, if Congress allows states to tax internet sales, Maryland will devote that revenue to transportation. If not, they’ll raise the sales tax on gas to five percent.-=
  • Raise $4.4 billion for transportation over six years (including the ability to borrow against increased future revenues.)

A popular argument against the tax has been the supposed increase that residents will see at the pump — 13-20 cents per gallon as reported by state analysts and trumpeted loudly above the fold by the Washington Post and other outlets. But gas prices fluctuate wildly even within submarkets — many places may see gas prices go up by 20 cents a gallon in just a few weeks at certain times of year.

Along those lines, the Get Maryland Moving coalition visited a bunch of Maryland gas stations on one particular day to show the wild variety in prices, sometimes at locations within sight of one another, and produced this terrific graphic.

Get Maryland Moving Gas prices

The Get Maryland Moving coalition consists of some of T4 America’s core local partners in the region as well as strong representation from local elected officials and business groups that don’t want to see Maryland drop the ball on projects like the Purple Line that would create a vital (and decades overdue, many would argue) east-west transit connection in the region that would also eliminate long rides through the core of the Metro system to reach the opposite end of the Red line.

Most of the leaders of the suburban counties in the DC metro region have been strong advocates for the plan in the legislature. From The Washington Post:

“This is a big problem, and we need a big solution,” Montgomery County Executive Isiah Leggett (D) testified at a hearing of the Senate Budget and Taxation Committee. “My view is go big or go home.”

Leggett appeared on the same panel with Prince George’s County Executive Rushern L. Baker III (D) and Baltimore Mayor Stephanie Rawlings-Blake (D). All three praised a bill introduced by Senate President Thomas V. Mike Miller Jr. (D-Calvert) but said they remain open to alternative methods to raise more money for transportation.

The moment of truth is coming soon for Maryland’s transportation future. The 90-day legislative session ends in just a few weeks in early April.

The impacts of sequestration: comparing 2012 to 2013

If your head is spinning from trying to figure out what sequestration, the “continuing budget resolution,” and the myriad proposed budgets have on transportation funding, this simple chart is for you.

This helpful chart shows the notable recent spending plans and compares each of them to what was spent on transportation in 2012, for the key programs that we care about.

There’s still a lot there, so let’s break down what’s there and simplify it. The first column shows what was approved for spending in 2012. These appropriations bills were passed before MAP-21 passed last summer, so 2012 mostly represents the levels authorized by SAFETEA-LU. This is the baseline we’re using for comparing to the 2013 spending.

The second column is the 2013 budget proposed by the Senate in the last (112th) Congress.

The third column is the spending levels established by MAP-21. Keep in mind that the standing transportation law just “authorizes” funding levels — the money still has to be “appropriated” each year. But typically, appropriators follow the levels laid out within the current transportation law for the most part.

The fourth column is the important one to pay attention to, because this is where all the cuts that are part of “sequestration” have been made. This is the “continuing budget resolution” that the Senate and then the House passed in just the last few weeks. A CR, as its known, just extends spending authority ahead through a certain amount of time — usually when Congress can’t agree to write a proper new annual budget before the current one expires. It’s a stopgap measure. A CR usually keeps funding at the same level and almost never changes policy, but in this case, there are cuts in the CR, and most of these are due to sequestration, which required cuts to all discretionary funding.

The last column shows the difference between the funding for transportation in 2012 vs 2013, comparing the first column with the fourth. Hopefully this provides some clarity for a confusing issue.

Would you like to download this chart as a sharable PDF? Find that here.

Program2012 funding levelsSenate's draft 2013 proposal (112th Congress)MAP-21 authorized2013 CR (implements sequestration)Difference: 2013 v. 2012 funding levels
Federal-Aid Highways$39.1B$39.1B$39.7BB$39.7B$600M
Transit Formula Grants$8.36B$8.36B$8.5B$8.5B$10M
Transit Capital Grants (New Starts)$1.955B$2B$1.9B$1.86B—$95M
High Speed Rail/High Performance Passenger Rail$0 (HSR)$100M from PRIIAPRIIA has jurisidction$0$0
Amtrak Capital*$952M$1.05BPRIIA has jurisidction$904M—$48M
Amtrak Operating*$466M$400MPRIIA has jurisidction$442.5M—$23.5M
TIGER$500M$500MNot authorized$475M—$25M
Partnership for Sustainable Communities Grants$0$50M$0$0
Projects of National and Regional Significance (PNRS)Did not exist – created under MAP-21$500M$0$0 (or —$500M from MAP-21)
Hurricane Sandy FTA Emergency Transit Funding$10.9B$10.35B—$545M
Hurricane Sandy Amtrak Emergency Funds$118M$112M—$6M
Hurricane Sandy FHWA Emergency Highway Funds$2B$1.9B—$100M

A state with one of the oldest transportation systems tries to make things new — new state series

It’s a state that boasts the first active subway line and a network of turnpikes that predated the Interstates, so it shouldn’t surprise you that Massachusetts has some of the oldest infrastructure in the country.

Though Massachusetts’ bridges are middle of the pack in deficiency nationally, they’re beyond middle age (an average of 56-plus years) and many of its busy subways, bus lines and commuter trains – and the roads, bridges and tunnels that carry them — are starting to fall apart after decades of heavy use. Saddled with debt from the Big Dig (among other things) and chronically underfunded after years of budget cuts, Massachusetts leaders and advocates are trying to reform their transportation agencies while raising new money to bring an aging system into the 21st century.

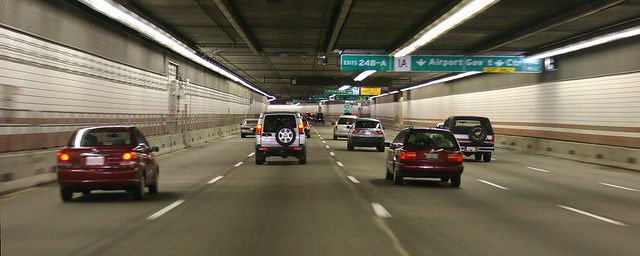
Boston I-93 Tunnel

With MAP-21 out the door, attention has shifted from Washington to the states. In many cases, states are deciding that they need more money for transportation and are embarking on ambitious and often groundbreaking plans to raise additional revenues for transportation. This post is part of a longer series we’ll be doing in 2013 looking at how states are addressing the need for more transportation dollars, along with key policy changes. Visit the home for state plans here, where we’re tracking all of the news. – Ed.

These aging systems in Massachusetts combined with years of lacking the needed money for maintenance has left things in perilous shape and makes for unreliable service on the roads and rails— along with unsustainable levels of debt that force MassDOT to use their capital funds (intended for construction, expansion, new trains, etc.) just to keep the system operating day-to-day.

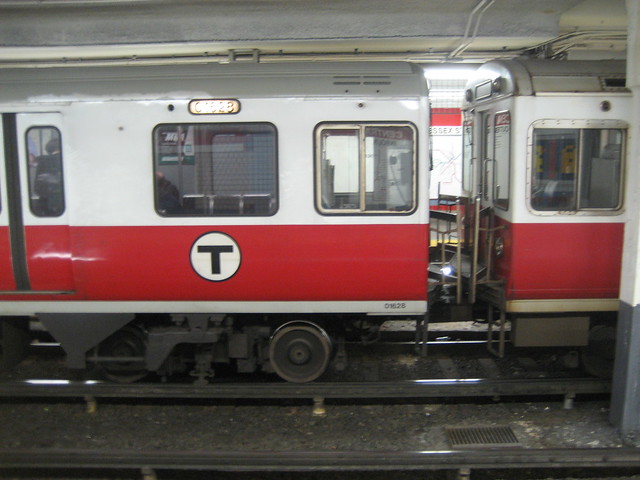
Here’s one crazy fact for you: 100% of MBTA (The “T”) fare revenues go to paying down debt, because Big Dig-related debt largely ended up on the MBTA books.

IMG_7654.JPG

While a significant 2009 reform merged the Bay State’s myriad of transportation agencies into one MassDOT, the revenue question was left unanswered. Reform did indeed result in some savings, however the funding gap identified by numerous Blue Ribbon Commissions and nonpartisan think tanks has remained and indeed expanded in the past four years.

A big source of the problem is that thanks to generations of budget cuts, a painful recession at a terrible time and rising expenses (like healthcare), the state has been paying for everything with bonds and other non-sustainable sources (read: debt.) A couple of winters of failing commuter trains, unreliable bus lines and overcrowded subway cars has helped convinced the public that the system is falling apart.

The state recently tallied up — confirmed by other independent sources — that they need about an extra $1 billion a year to bring the system into a state of good repair, fully fund operations and address some critical “expansion” projects.

But enough about the past, what’s the plan going forward?

Paraphrasing our partners at the T4 Massachusetts coalition, how will Massachusetts raise enough money from sustainable sources to fully fund the systems’ operations and invest in its future, spent in a transparent manner that helps increase access to transportation choices across the whole state, supports the economy and reduces greenhouse gas emissions from the transportation sector?

Gov. Deval Patrick introduced a plan that addresses some of the issues through dedicated sales tax revenue with some very progressive elements. His plan would:

  • Lower the sales tax rate from 6.25% to 4.5%, but deposit it all to an infrastructure fund for multiple things, including transportation. This alone will reduce revenues by $1.1 billion, but…
  • Index the gas tax to inflation to bring in an additional $13 million in 2014, and up to $118 million more by 2021. (The state gas tax hasn’t been raised since 1991 and was never adjusted for inflation, so it’s actually at its lowest level since the introduction of the tax.)
  • Increase vehicle fees by 10% every five years beginning in FY16
  • Increase tolls by 5% every two years beginning in FY15
  • Raise state income tax from 5.25% to 6.25% with changes to exemptions to raise $2.8 billion.
  • Increase MBTA transit fares 5% every two years.
  • Unlike some other states, the new money raised is expressly intended for multimodal projects. There’s no restriction on spending money on transit.

There’s a statewide pilot program for a vehicle-miles-traveled tax, a proposal to pay down Big Dig debt with other funds (freeing up transit money for, you know, transit), and the Transportation Investment Act, which would help guide how money gets spent in the state. This act, supported by a broad cross section of business, community and environmental groups and backed by the T4MA coalition, would send money to Regional Transit Agencies across the state, invest in low income communities, and enable DOT to comply with the states’ other obligations, like their “mode shift” plan to triple the share of travel in Massachusetts by bicycling, transit and walking. (Read Streestblog for more on that.)

The ball is currently in the Legislature’s court, but the clock is ticking.

A plan must be approved in time for the MBTA’s budget submission deadline around the corner in April or there will definitely be more fare hikes to keep the MBTA operating. The impact of that could be disastrous for lower-income commuters who depend on the “T”, a system that’s already experienced drastic fare hikes over the last 7-8 years.

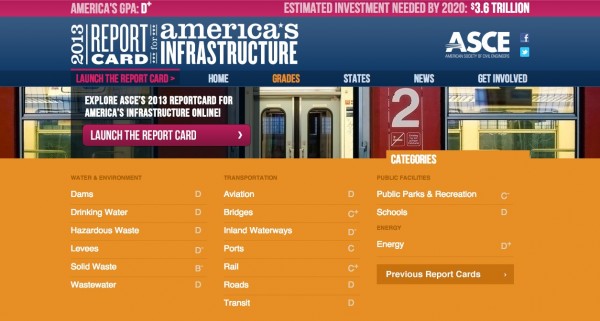
America’s infrastructure improves slightly over 2009, still a failing grade

America’s civil engineers raised the grade given to our country’s infrastructure from four years ago, but unfortunately, it’s still a failing grade for America.

With the $3.3 trillion dollars needed by 2020 (according to ASCE) unlikely to arrive in this current climate of reduced budgets and austerity, is there a way forward that can make smarter decisions with the money we have and knock back our maintenance backlog while still investing in the 21st century infrastructure our country needs?

The latest edition of the every-four-years report card from the American Society of Civil Engineers gives America a “D”, up from the “D-minus” we received in 2009. Improvement is always good, but a failing grade is still unacceptable, like a baseball player who hits a homer in a game his team loses.

“While our country’s association of civil engineers continues to do the yeoman’s work of sounding the alarm on our country’s infrastructure,” said T4 America director James Corless this morning, “it’s a sad reality that little has changed since the last Report Card in 2009.”

The truth is that few should be surprised at the state of things when they log on to the fantastic new ASCE interactive report card app (available on the web as well as for Android, iPhone and tablets) and sift through the national and state data.

ASCE Report Card App

Few would be surprised, because has anything here in Washington changed to drastically improve the condition of our roads, bridges and transit systems? Last summer, Congress finally passed a replacement to the transportation bill that expired just a few months after the last ASCE report card was issued — in 2009. Though a definite sign of progress in some areas, the new law provided no new dollars for transportation in the two years to come. The program dedicated to repairing our country’s 69,000 structurally deficient bridges was eliminated after making steady progress on reducing the backlog over the last 20 years.

Beyond the federal bill, which only represents about a quarter of all transportation spending, state and local revenues in many places are falling rapidly (MAP-21 held federal funding level at least) leading many Governors and state legislatures to float alternate plans for raising for revenue to make needed repairs and build anew.

While we certainly believe we need to increase the amount of money that we spend on infrastructure (especially transportation), simply increasing the amount of money is no panacea — ASCE is certainly right that we need to change how the money is spent — it’s not enough to pour more money into a cup with a hole in the bottom.

ASCE has some encouraging recommendations in this year’s report card moving the discussion in the direction of smarter, more transparent spending on infrastructure. We do need more leadership, more transparency, and a “focus on sustainability and resilience,” as they say in their recommendations. And we can no longer ignore growth patterns and things like a housing-jobs mismatch when making transportation decisions, affirmed by ASCE’s insistence that “infrastructure plans should be synchronized with regional land use planning.”

Some states aren’t waiting for billions that are unlikely to come and are already far ahead of the curve, thinking about ways to make their dollars do more. Like Massachusetts, where the DOT director issued a goal of tripling the number of trips taken by foot, bike and public transportation — reducing the load on roads and bridges that are among the oldest in the country. Or Tennessee, where the state DOT has taken a long look at their list of their proposed projects to see if they’re really necessary at a time when funding is dwindling, resources are scarce, and residents are looking for options to sitting in traffic.

Pushed between a rock and a hard place with forced austerity through reduced budgets yet being asked to do more with less, it’s time for a different approach.

With $1.7 trillion in needs by 2020 for surface transportation identified by ASCE and MAP-21 funding levels only due to bring in about $400 billion in that same time period, it begs the question: Who’s going to pay the difference? While ASCE avoids the question specifically, they do assert, much as we do, that there will continue to be an important role for the feds in planning and paying for infrastructure. “Federal investment must be used to complement, encourage, and leverage investment from the state and local government levels as well as from the private sector,” the report says. But it doesn’t stop there. “In addition, users of the infrastructure must be willing to pay the appropriate price for their use.”

Will we be willing to pay for what we need? Or do too many people think that we need to make the spending smarter before we make it bigger? However you answer, there’s not really an option other than smarter spending for the next two years, because MAP-21 didn’t provide any new money to states.

Yet MAP-21’s expiration is already on the horizon and the Highway Trust Fund is still headed towards its own fiscal cliff. The Senate budget resolution and the President have both suggested big increases in transportation spending. But where will the money come from? Despite key questions about where that revenue would come from, the simple fact that the 113th session of Congress has started with a number of proposals to increase investment in infrastructure, along with supportive comments from new House Transportation Chair Bill Shuster, have given transportation advocates a reason to be hopeful.

“With the federal gas tax bringing in less money every year, strong leadership from Congress is needed now more than ever,” said T4’s James Corless.

—

Some comparisons with 2009 at a glance:

  • Bridges improved from a C to C+
  • Rail improved from a C- to C+
  • Roads improved slightly from a D- to D
  • And transit was unchanged at a D

Unequal sequestration cuts show the need for a real transportation fund

If Congress can’t come to a deal to avoid automatic budget cuts March 1, some transportation programs will take a serious hit, while others will be protected. Here’s a rule of thumb: The more innovative and popular with local communities they are, the more likely they are to feel the blow.

Under so-called sequestration (see our post from September) the mandatory, across-the-board cuts of nearly 6 percent fall heaviest on the programs paid for out of the general fund, rather than from gas taxes. This includes grants for transit construction, over-subscribed TIGER grants, Amtrak dollars and other passenger rail project funding.

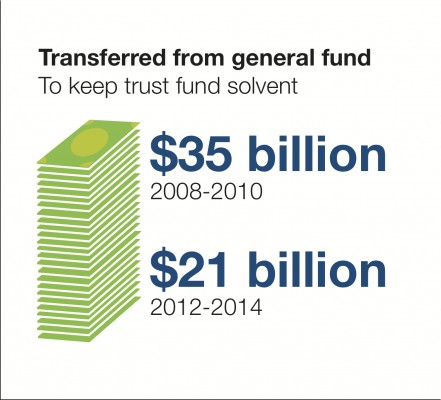
HTF General Fund Transfers

Gas tax receipts go into a Highway Trust Fund, and they are deemed off-limits to the cuts.*

But here’s the rub: As of the last few years, the HTF has been heavily subsidized by transfers from the general fund (see graphic at right.) You’ll recall that passing the two-year MAP-21 required a $19 billion infusion of general dollars to make up for declining gas tax revenues (on top of the $30+ billion from the three previous years).

There has been some debate over whether this general fund money deposited in the highway trust fund is subject to cuts or not. (Turns out it will be.) However, there has been no debate over cutting the multimodal programs mentioned above, because they are funded from accounts outside the trust fund.

So here’s our question: If transportation programs are important enough that most of the money is in a protected trust fund, shouldn’t all transportation dollars be part of that off-limits account?

The local communities doing the hard work of raising their share of funding should be able to depend on their federal dollars coming through, whether they are building a new highway bridge or creating a rail link to a job center. The workers depending on those jobs this year shouldn’t have to wait one, five, 10 years because of Congressional brinksmanship over the budget.

Transportation infrastructure is a fundamental function of the government. Our economy, our workers and our employers utterly depend on it. And they depend on a complete network, not just parts of it. If this latest fire drill is showing us anything, it is that Congress needs to get serious about creating a stable, comprehensive funding source for all our critical modes of transportation.

—-

* Wonky note: there are some cuts that would be made to the protected highway trust fund programs (a little over 1 percent of total funding) because of the transfer of general funds to keep the trust fund solvent for the two-year life of MAP-21. The formula transit programs would not face those cuts until FY14, since the transit account was still solvent in 2013 and didn’t require general funds in 2013 to keep afloat as did the highway account.

US Transportation Secretary departs, leaving a legacy of memorable initiatives

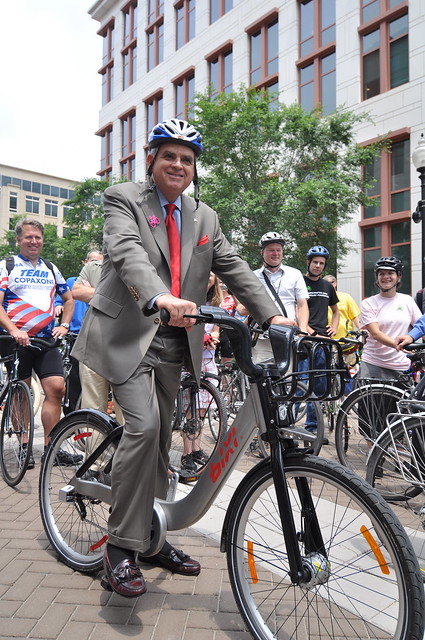
LaHood and to-be-named DC Bikeshare bikeThe news many had suspected was confirmed to be true this morning in a blog post from Secretary LaHood himself — the Transportation Secretary is planning to step aside for President Obama’s second term:

“I have let President Obama know that I will not serve a second term as Secretary of the U.S. Department of Transportation.  It has been an honor and a privilege to lead the Department, and I am grateful to President Obama for giving me such an extraordinary opportunity.  I plan to stay on until my successor is confirmed to ensure a smooth transition for the Department and all the important work we still have to do.

At a time like this, it’s entertaining to go back and read the wide spectrum of reactions from transportation reformers and local advocates back when the relatively unknown former Republican Representative from Illinois was tapped to be President Obama’s Secretary of Transportation.

Skepticism. Cautious optimism. Shock.

Our response was hopeful for the future as we faced the imminent 2009 expiration of transportation law and knew that a strong voice at DOT could be helpful in moving a bill along — that hope was rewarded with four years of a strong DOT Secretary who shared our vision for the future.

We released the first edition of our report on pedestrian safety (Dangerous by Design) in 2009 at a time when a new DOT secretary in his first year was still honing what would become his key message for his four-year term: safety. We arranged a meeting and took the names of 4,100 of our local supporters like yourself to his office and sat with him for an hour and explained how the design of our federally-funded streets and roads results in preventable pedestrian deaths every year.

DSC_0376

After the meeting, he gave us his promise that he would review the report and direct his newly convened safety council to investigate these 76,000 preventable pedestrian fatalities and make recommendations on what DOT could do apart from Congress. He also became a champion for the cause on the Hill and released an official DOT policy statement on the issue.

Though he tried to apply pressure to Congress where he could to move the transportation bill along and offer his thoughts on the duration of the bill, those decisions were still ultimately up to the policymakers in Congress. But Sec. LaHood knew that he still had great influence over scores of day-to-day DOT decisions and the money that they spend. So he became the foremost champion of the innovative TIGER grant program — awarded by his office directly — touring and touting the projects at every opportunity and doing his best to advocate for the program with skeptical House members…some of whom who became defenders of the program, touting their own communities’ applications as worthy TIGER grantees and urging Congress to expand the program.

Perhaps one of his most valuable roles over the past four years has been as a plainspoken yet highly visible advocate for a smarter way of using transportation dollars to better line up with what Americans really want — which he described after seeing our national poll that affirmed that Americans want more transportation options

This is precisely what I’ve been talking about here in this blog with regard to livability, transit, and walking and biking. I have traveled all over this country in the past 14 months, and everywhere I go people want better options. Options that offer reduced greenhouse-gas emissions. Options that offer reduced fuel-consumption. Options that offer better health. Options that bring communities together.

Now, let me make this absolutely clear: I never said we would stop repairing, maintaining, and–yes–even expanding roadways. I said only that it’s time to stop assuming that putting more cars on more roads is the best way to move people around more effectively.

This survey demonstrates that, by and large, the American people get that. I never doubted them, but it sure is nice to see the numbers.

So, thank you, Transportation For America, for that 82%-strong vote of confidence.

So as a handful of critics began to assail President Obama’s focus on “livability,” Sec. LaHood became its most outspoken advocate, turning to his own personal experience to explain how livability was really just a newfangled buzzword to describe a lifestyle that many Americans knew anyway, by sight or memory:

Q. So tell me, what does this concept of “livability” really mean?

A. This is something I’ve never really talked about, but growing up, I lived on the east side of Peoria. When I was growing up, I could walk to my grade school. We had one car, but we would bike everywhere we went. We could walk to the grocery store. In those days, we had streetcars and buses, which people used to get to downtown Peoria, which was probably five miles from my house. I used to take a bus to my dad’s business. I grew up in an era [of] livable neighborhoods and livable communities — what we’re really trying to offer to people around America…

When the groundbreaking Partnership for Sustainable Communities — the partnership between DOT, Housing and the EPA — was under threat of budget cuts Sec. LaHood was a strong advocate for the partnership and its common sense approach of coordinating their efforts and making the most of these three agencies’ work.

Perhaps moreso than any other recent Transportation Secretary, LaHood leaves behind a signature initiative with his distracted driving campaign that registered with the national zeitgeist in a way that will be hard to match.

Sec. LaHood has proven to be a remarkably smart choice by the President, and all of us at T4 America will be sorry to see him leave the office. We hope his successor, whoever he or she may be, takes some cues from the hardworking Republican from Illinois as they craft their own agenda for the next four years.

Sandy relief bill will provide billions for repairing and improving transportation systems

The Sandy relief bill on the cusp of final passage will provide billions for cleanup and more than $12 billion for transportation — including an unprecedented step toward making transportation networks around the northeast and NYC more resilient in the face of climate change, more frequent and unpredictable storms, and rising sea levels.

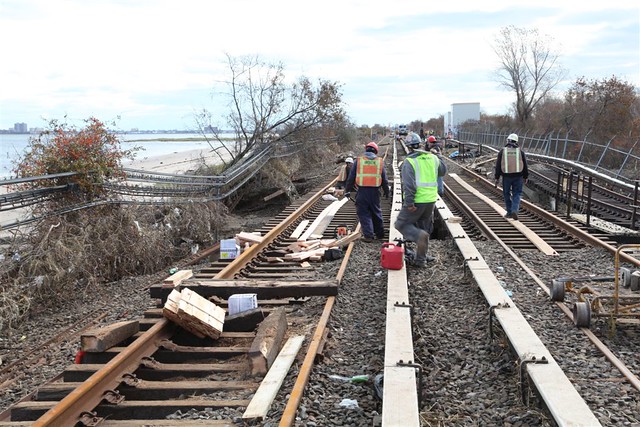
21. Contractors Rebuilding Washed out Tracks in Rockaways
The MTA A Train bridge to the Rockaways was heavily damaged during Hurricane Sandy. This photo shows early repair work underway as of November 3, 2012. Photo: MTA New York City Transit / Leonard Wiggins

It’s not completely a done deal yet — the House and Senate passed slightly different bills — but the $50.66 billion Sandy relief bill was passed by the House this week more than two weeks after the promised vote by Speaker Boehner to New Jersey Governor Chris Christie (and others) at the end of 2012.

The Senate passed their version of the bill back in 2012. The bills are almost identical in their funding amounts, though there are some small programmatic differences in funding. Also, earlier this month, Congress approved and President Obama signed a measure providing $9.7 billion in additional funding for the federal flood insurance program, bringing the total expected Sandy spending up around $60 billion.

Part of the reason the House did not vote on this comprehensive package was due to pushback from House Republicans against approving such a large emergency spending package, and particularly because the package included funds for “future disaster mitigation,” i.e., acknowledging that climate change exists and is something worth preparing for. As a result, northeastern legislators from both parties were livid at the delay in approving disaster funding for their hard-hit region — actually a longer wait than for Katrina funding in 2005.

So what’s in the two bills for transportation?

The Senate package included over $12 billion for transportation. The bulk of that ($11 billion) is for the damaged transit systems that millions of daily commuters and riders depend on, to be distributed through the new Federal Transit Emergency Relief program (created by MAP-21). Close to $5.4 billion of this funding is directed to mitigation efforts to reduce the risk of damage from future disasters. As noted above, this unprecedented inclusion of mitigation funding represents a major shift in the federal dialogue about the real need to address and prepare for the impacts of climate change.

The Senate bill also included $336 million in mitigation relief to Amtrak and the Northeast Corridor for damages caused by the storm as well as advancing projects critical to improving resiliency in the case of future disasters. (According to our partners at the Tri-State Transportation Campaign, that money also helps NJ Transit, which operates commuter service on the same tracks.) There was also about $920 million to repair Sandy-related damage on our nation’s highways and bridges.

The House-passed package included relief for all of the above, but there are some important differences in the transportation funding distribution. Amtrak’s relief was cut by about 64% down to $118 million. Transit system relief is still close to $11 billion with close to $5.4 available for projects to alleviate future damage (there were some slight language changes and a small boost in funding). Highway disaster relief increased to a little over $2 billion.

Though there was opposition to the package from many House Republicans, the measure was pushed through with the support of the House Republicans from the region as well as House Democrats. Now, the Senate will likely take up and pass the House bill, or potentially attempt to amend it before final passage.

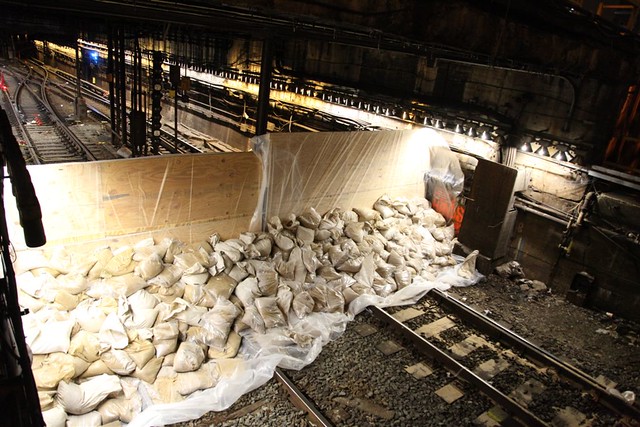
12. Lenox Terminal @ 148th St. in Flood Prep
MTA New York City Transit preparations for Hurricane Sandy. Photo: MTA New York City Transit / Leonard Wiggins

From state to town, Michigan takes strong steps toward a better transportation future

One place illustrating the national positive voting trends for transportation is Michigan, where citizens voted to raise taxes for transportation investments in cities and counties across the state, at least one anti-transit elected official was ousted, a Republican governor led the charge for regional transit investment in the state’s biggest metro and when given a chance to bail in the name of “cost savings,” local voters doubled down on their existing transit system.

There were a lot of eyes on Michigan during Transportation Vote 2012, in part because of the sheer number of transportation measures being decided there: over 30 different ballot questions in 2012 alone, according to the Center for Transportation Excellence.

Though there were dozens of worthwhile transportation ballot measures passed this year, Eaton County, Kalamazoo County, Muskegon City, and Ogemaw County all either renewed or passed new substantial tax millages to support public transportation specifically.

That’s no fluke, as Tim Fischer of the Michigan Environmental Council told us. Fischer, the Deputy Policy Director for MEC and part of the Transportation for Michigan coalition echoed a familiar refrain about the success of transit related ballot measures.

“I think the real message is that voters will support transit almost every time when they know where their money is going and what it will be used for,” he said.

Along those lines, a handful of cities around the country were offered a choice to secede from existing transit systems and decide to send that money elsewhere — a phenomenon explained in more depth by Angie Schmitt at Streetsblog Capitol Hill a few weeks ago — including one vote in Walker County, Michigan, a city in the western suburbs of Grand Rapids. In a show of support for their existing system, voters in Walker rejected that attempt by a huge margin (73 percent opposed), “because residents see real value in their local transit systems even though they might not ever use them,” Fischer added.

“Road millages, by comparison, don’t always fare so well and have been rejected more often than passed in recent years. People perceive that they already pay for roads through the gas tax and are less inclined to pay for roads through millages.”

(That wasn’t the only good news in Grand Rapids, which also recently received $20 million in federal funds to build a BRT line.)

In a more recent development, just last week, the Michigan legislature passed landmark legislation finally creating a regional transit authority in Detroit, something that transit advocates and Detroit leaders have been trying to do for decades.

They were no doubt urged along by USDOT Secretary Ray LaHood, who told Michigan leaders they wouldn’t receive federal money for the Detroit Woodward light rail line without a regional authority to receive and manage the money.

“The RTA passage will trigger USDOT to release $25 million in promised federal funds which will add to about $80 million in private money,” Fischer said. “In addition, a component of that legislation is the development of about 100 miles of rapid bus transit (‘BRT light’).”

The coalition that helped the RTA legislation along to victory was a broad one.

MOSES (Metropolitan Organizing Strategy Enables Strength), which does faith-based organizing within over 40 congregations in southeast Michigan, was a key part of the successful coalition. MOSES did much of the legwork to push the bill through, holding scores of meetings with legislators to affirm to them the importance of investing in public transportation (pdf), and explaining how the lack of this regional authority was a significant roadblock to doing that.

Michael Tasse with MOSES said that their leaders and members had been having meetings with legislators for over two years on the regional transit bill.

“We pushed the governor to support it,” Tasse said. “We helped persuade legislators who were on the fence or who might not have initially supported it by helping them to understand the bill. A big part of what we spent a year doing is educating them on the bill and pushing them to read through it and understand it. We made scores of visits in district, and we went to Lansing more than ten times.”

MOSES is celebrating the passage of the bill as 2012 comes to a close. “This is important because it’s about transportation — not just rail lines to Chicago, but the bus lines that connect people across town and the factories across town and the suburbs,” he explained. “Connecting people to those jobs is how we’re going to build strong families and communities in Southeast Michigan. If people can’t get around, they’re stuck, and that creates a gap between the few and the many.”

But the wins go beyond just local or regional transit in Michigan. Passenger rail statewide has had a significant boost in the last year, certainly helped along by the leadership and straight-up boosterism of the Republican Governor Rick Snyder.


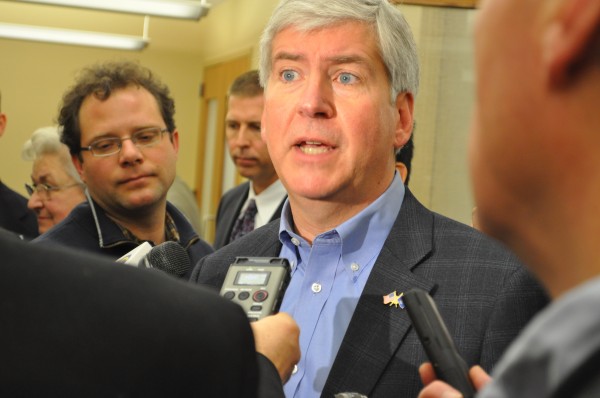
Michigan Governor Rick Snyder talks to the media at an event sponsored by the Michigan Municipal League.

Michigan has received about $500 million for the Chicago-Detroit/Pontiac passenger rail route, including funds to purchase about 130 miles of track from NS, adding to the 100 miles already owned by Amtrak. 234 miles of the 300 mile Chicago-Detroit route are now under public ownership. Trains are already running at speeds of 110 mph on some of this stretch, and they’ll run that fast for longer stretches once more track is upgraded next construction season.

Incidentally, this line from Detroit to Pontiac runs right through the town of Troy, where a mayor who refused a federal grant to build a new train station there was ousted by recall in November and removed from office.

All of these stories of Michigan communities and the state seizing control of their futures and declaring the importance of transportation at the ballot box are encouraging, but they still can’t go it alone — they need the feds to step up and support these kinds of communities leading the way.

“The rail projects wouldn’t exist without it [federal support], nor would the Grand Rapids BRT line,” Tim Fischer told us. “The locals must do their part, but federal money is necessary to turn the projects into reality.”

Michigan boosters like Fischer see the positive trend continuing.

“I am optimistic for Michigan’s future. Our passenger rail programs and transit systems have come a long way in just a few short years. Also, communities across the state have great interest in complete streets — over 80 have adopted complete streets policies or resolutions since we established our complete streets law in 2010.”

“Things are coming together at long last,” Fischer said.

A stirring persuasion for deciding to vote for transit: seeing it built next door

One of the most powerful avenues for persuading a skeptical community to invest in transit is to see it successfully implemented nearby — whether in the community or neighborhood right next door, or a city and region a few hours away. This trend is illustrated in two of this year’s Transportation Vote 2012 ballot measures through two very different stories in Virginia and North Carolina.

In the tidewater region along the Virginia coast, discussions ramped up in the 1980s and 90s about a light rail system connecting the neighboring cities of Norfolk — a little more inland — and Virginia Beach on the Atlantic Ocean, mostly via an underutilized Norfolk Southern railroad corridor that runs in a neat, straight line from Norfolk all the way to the beach.

In 1999, an attempt was made to pass a referendum on the potential light rail system in the City of Virginia Beach, but voters rejected it. Perhaps as a result of the controversy or simple issue fatigue after talking about it the concept for more than a decade, the Virginia Beach city council washed their hands of the whole affair and passed a resolution affirming that the city would have nothing to do with the future construction of the light rail system for ten years.

That setback didn’t stop the project in its tracks.

Norfolk decided to forge ahead on their own with a system spanning the core of their mostly linear city along the Elizabeth River. And in summer of 2011, The Tide — the first light rail system in Virginia — opened to huge crowds and daily ridership exceeding projections.

Grand Opening of The Tide light rail system in Norfolk, Virginia
Crowds of people took rides during the Grand Opening of The Tide in Norfolk, Virginia. Newtown Road Station. Photo by D. Allen Covey, VDOT

Down the road in nearby Virginia Beach, citizens there finally got to move beyond renderings and promises and meetings and see a brand new working light rail system through the center of their neighboring city just a few miles away. Perhaps they bemoaned the perpetual traffic congestion on I-264 between the two cities and wistfully thought about how nice it would be to hop on a train at the beach and get to the downtown mall or the Tides baseball park right on the river in Norfolk.

But most powerfully, the idea of rail transit in their community was no longer an abstraction; a figment of some planner’s or city councilperson’s imagination. There it was, dropping off students by the thousands at Norfolk State and winding right through a newly rebuilt MacArthur Square and park by the mall every day with shiny new passenger vehicles on the way to the burgeoning hospital complex on the west side of town.

A year and a half later, it’s easy to understand how Virginia Beach voters went to the polls Tuesday and gave a hearty “me too!” to the Tide system. Though it was a nonbinding resolution directing the city council that still has the final say on moving forward, 62 percent of voters supported the measure. And in no small part because of the case study of success just a few miles west.

 
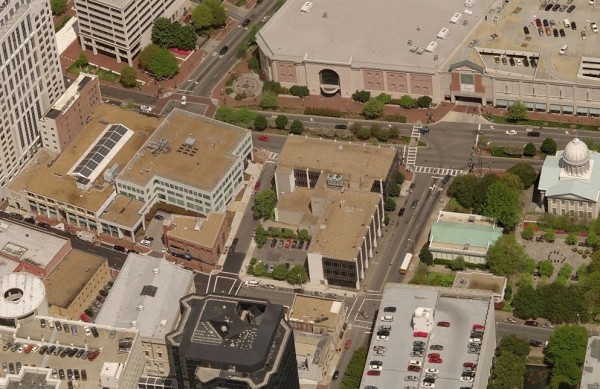
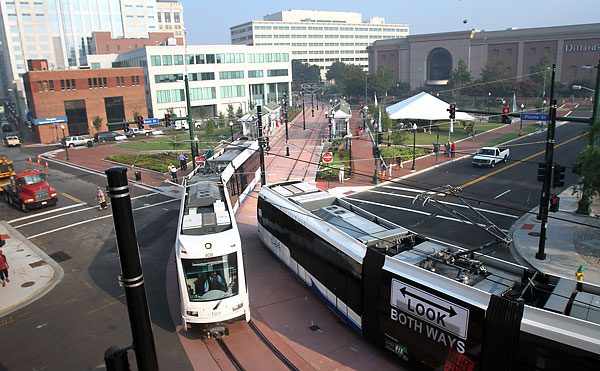
MacArthur Square in the center of Norfolk before, and how it looks after tearing down an old office building and creating a stop and a new park across from the downtown mall. First photo from Bing Maps, second photo by Steve Earley, the Virginian-Pilot

North Carolina Research Triangle

Raleigh-Durham and Charlotte are just a few hours apart on Interstates 85 and 40 and about the same size in population (1.7 million) yet Charlotte has done far more to invest in rail transit in the last decade, with more to come. (Though acknowledging the differences: Charlotte is a metro anchored by a central city and the more spread-out Triangle region is composed of the large and small cities of Raleigh, Durham, Chapel Hill, Cary and the suburban Research Triangle Park.)

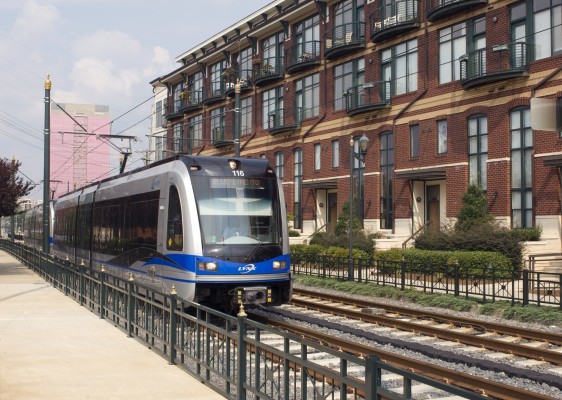
After the better part of two decades of discussion and study, Charlotte’s new Lynx Blue Line opened in 2007 and is a popular line running south from downtown to “uptown” Charlotte that has stimulated a wealth of new development along the way. According to our friends over the Center for Transit-Oriented Development, the Blue Line has catalyzed more than 10 million square feet of new housing, retail and office development along the corridor.

Simliar plans have been discussed in the Raleigh-Durham metro area for almost as long, but with four cities in three different counties trying to agree on a single region-wide plan, they’ve certainly had a harder time making it happen.

Perhaps prodded along by the success of the Blue Line down the road in rival Charlotte, Durham approved a half-cent sales tax last year to fund transit operations and a regional light rail line toward Chapel Hill, and Orange County (Chapel Hill) approved their half-cent tax to do the same just this week on Tuesday.


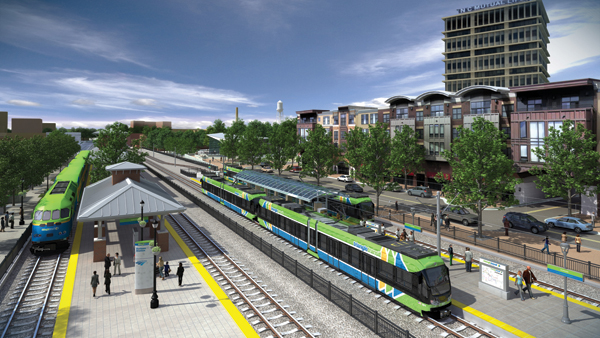
Rendering of a station in Durham courtesy of Triangle Transit

Unfortunately, the third partner in the region, Wake County (Raleigh), decided not to put a sales tax on the ballot this fall, so as of yet, there’s no truly regional commitment to building rail transit.

Leaders of similar sized cities and regions know that investing in transit, the signals it sends to employers, and the kind of growth that it can stimulate are key to continuing to attract a smart workforce. In a similar story about Nashville, Ralph Schulz, president of the Nashville Area Chamber of Commerce, told the Nashville Ledger that “the lack of a mass transit system costs the area about one in five businesses considering relocating here.” (In that story you’ll see that Nashville Mayor Karl Dean knows it too and is a tireless advocate for investing in more transit.)

With Charlotte signing on the dotted line with the Federal Transit Administration just a few weeks ago to move ahead on a 9-mile expansion to the Blue Line that will reach northward to UNC-Charlotte, the bar has been raised in the region which the Triangle most closely identifies as their competition for jobs and workers.

While they’re two-thirds of the way to a regional system with Orange and Durham approving the tax, unlike Norfolk’s story, the utility of a Chapel Hill-Durham line will be incredibly limited without including lines into Wake County to connect the thousands of jobs in the Research Triangle Park and downtown Raleigh with Durham.

But every trip that a Triangle leader or citizen takes down the road to Charlotte will be a powerful reminder that successful new rail transit in a similar still-sprawling southern city is a downpayment on future growth that reaps dividends in shorter commutes, more access to jobs and neighborhoods, and an increase in the type of walkable neighborhoods that are so heavily in demand these days.

On an optimistic note, if a booming suburban city in the South with jobs scattered across the region like Raleigh can find a way forward with more transit, there’s hope for many other similar regions.

—

Though these regions have voted to tax themselves to invest in transit and make their vision for the future a reality, they can’t do it alone. They need a strong federal partner to come through and help leverage those local dollars into tracks in the ground one day.

Telling only half the story of congestion, travel time and the quality of our metro areas

A popular study on traffic and congestion in our metropolitan areas is widely cited by the national, state and local media with every annual release, but it doesn’t tell the entire story. Far from it. That’s because measuring congestion while ignoring the actual time and distance spent commuting is a poor measure of what residents’ actually experience on a day-to-day basis.

The popular and oft-cited Texas Transportation Institute’s annual Urban Mobility Report isn’t an incorrect metric, it just tells half of the story. For starters, let’s consider two metros that appear to be ranked pretty close together in the latest report out today. Atlanta and Chicago appear to both be pretty miserable in regards to congestion, right? According to the 2012 Travel Time Index (pdf), they’re near the top with TTI scores of 1.24 and 1.25 respectively, and tied for seventh in yearly delay per commuter. (In 2009, Chicago’s TTI was 1.43 – 23% worse than Atlanta’s 1.35.)

That must mean that the commute is just as bad in both of these areas, right? Well, no.

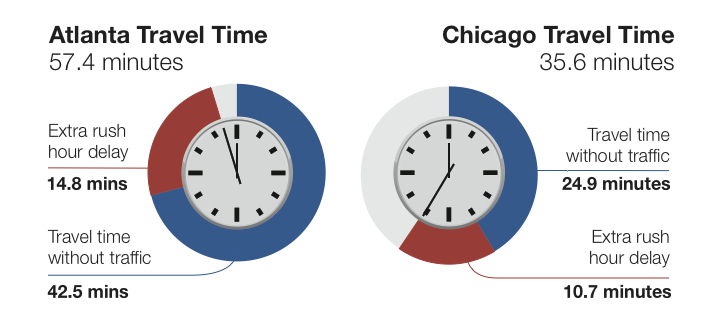
Chicago Atlanta travel time

These statistics are from 2007, due to a limitation with how we can break down the TTI data.

Take an informal poll of your friends and co-workers: Who wouldn’t agree that a 35-minute commute is better than a 57-minute commute? Then why do we rely on measuring performance in a way that says the exact opposite? The TTI is almost the exact same for these two metros now, yet Chicago commuters had an average travel time of almost twenty minutes less than their counterparts in Atlanta a few years ago. That’s because TTI focuses only on how fast we can drive at peak while ignoring how far apart the destinations are in these two places.

In Chicago, the average trip to work is 35.6 minutes – 38% less time than the 57.4 minutes it takes Atlantans to drive to work. A major reason for the better highway performance in Chicago is that drivers do not have to travel as far as drivers in Atlanta – 13.5 miles compared with 21.6 miles. The amount of time it takes to go somewhere isn?t just about speed, that’s only half of it — it?s influenced both by how fast you travel and the distance you have to travel. Chicago and Atlanta are different places, so what about comparing an apple to an apple?

Denver, Colorado (8th worst TTI in 2012) has experienced a rebirth in its city core in the last decade or two, with residents flocking to new apartments and homes in the city center and close-in neighborhoods, attracted in part by the huge investment in regional transit. More people live near transit today in Denver than years ago, and with accompanying investments in new housing and jobs near transit and in more walkable neighborhoods, that means more people have shorter trips to get to work each day. Yet TTI shows that commuting in Denver is far worse in 2007 than it was 25 years ago. (TTI in 2012 is 1.27)

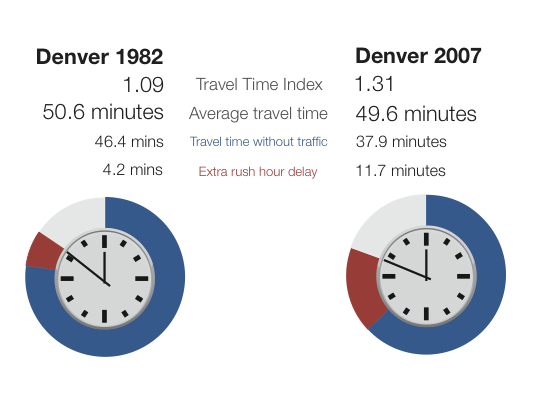
Denver 1982-2007 travel time 2

Look at the average travel time in 2007 in Denver compared to 25 years ago — it’s about the same. Rush hour delays have almost tripled, but the travel time without traffic (a good proxy for the average length of trips) actually decreased by almost ten minutes. Destinations are closer. Residents have more options. Commuters take shorter trips.

HPIM6863

Denver downtown construction near light rail. Creative Commons Flickr photo by vxla ***

Relying solely on TTI to try and measure congestion and travel time in your city is like measuring only measuring two dimensions of a three-dimensional object. Like measuring the length and height of a new couch for your living room while ignoring the depth. The couch is 48 inches tall, but without measuring the depth, do you have any idea if it’ll fit through your front door?

This gets at the core problem with TTI — when cities and regions (or the USDOT) rely solely on TTI as the single measure of congestion and make all their decisions about future transportation investments based on only part of the whole picture, regions prioritize projects to reduce TTI or shave a few seconds off of rush hour delay.

Legislators, the Federal Highway Administration, state DOTs, and newspapers all use the Travel Time Index to measure highway performance. Then we spend millions or billions to build projects that lower this number, but we rarely get to work in less time.

As the nation shifts to a performance-based transportation system — beginning under MAP-21 — it is key that the first national performance measures get this right. Any national performance measure needs to allow communities to consider both factors — speed and distance.

There’s probably a handful of federal, state or local legislators looking at the headlines in their local newspaper today about congestion in their metro region. Maybe they’re saying “we’ve got to do something about this!” We need to do “something” — they’re right! But accurately measuring the problem is the only way to find an appropriate solution.

Let’s start there.

Automatic budget cuts looming for transportation programs

In-demand and innovative transportation programs could face severe cuts come January due to an agreement made as part of the debt deal last year. But as a surprise to some, traditional highway programs funded mostly by the gas tax may be facing cuts as well.

Within the last-minute deal to raise the debt ceiling earlier this year, a proverbial doomsday device was put in the room with the supercommittee charged with coming up with the cuts needed to lower the deficit, in hopes of getting them to reach an agreement: Come up with the required cuts/revenue increases to hit the mark, or else hefty budget cuts of 8.2 percent across the board to discretionary programs would go into effect on January 1, 2013 and last for ten years. (The other half of automatic cuts would come from defense spending, with Social Security and Medicare/Medicaid almost entirely exempt.)

Because the supercommittee failed to reach an agreement, we’re facing hefty cuts in transportation spending for the next fiscal year. The heaviest burden will fall on the “discretionary” transportation programs that fund many important projects in high demand that aren’t typical highway projects: TIGER grants, New Starts transit construction, and even Amtrak.

Most of a state’s typical highway department budget comes from what’s known as formula programs, which everyone thought was protected until just recently.

Many states probably breathed a sigh of relief when the announcement was made that the programs funded by trust funds — like the Highway Trust Fund that comes from gas taxes and funds the formula grants to states — would be exempt from the cuts.

The problem with that, and what everyone seemed to forget, is that even the highway trust-fund formula programs are now getting huge infusions from general funds each year, making them susceptible to cuts. MAP-21, as you might remember, was only able to maintain the same funding level of the last transportation bill by cobbling together other sources of general funds, because the declining gas tax doesn’t raise enough revenue to cover spending — a structural financing problem for transportation that MAP-21 did not solve.

With about $20 billion in general fund revenues required to cover the difference in MAP-21 over its short life, that means formula programs will also face cuts this year. But discretionary programs will still take the brunt of the cuts (more than 7 percent), while the other highway formula programs get a haircut of only 1.3 percent.

Which means that the $500 million TIGER program takes a cut of $41 million. The almost-$2 billion New Starts program that funds all new transit construction is taking a $156 million cut — or about the entire cost of the soon-to-open 3.9-mile Tucson, Arizona Streetcar. Due to record ridership and sound management this year Amtrak asked for slightly reduced operations funding so they could plow the difference into capital expenses and improve the northeast corridor. Instead, Amtrak faces a cut of $116 million.

The only bit of good news — and there’s not much — is that transit formula programs (New Starts is discretionary) aren’t facing any cuts this year, because the transit account is still solvent and won’t be getting a general fund infusion this year. That changes next year, when transit would face cuts along with everything else.

Ultimately, though, the automatic “sequestration” cuts are really a bit of a black box, and there’s still a lot of confusion about what will and what won’t be cut. Even insiders within Congress or DOT aren’t sure exactly what will happen on January 1.

To avoid this massive mess our leaders in Congress need to find a way to stave off these automatic cuts and hopefully save the important transportation programs like TIGER that are funding many of the projects that have a hard time getting funding under old-school highway formulas. Whether there’ll be the political will to do that or not may be determined in large part by the November election.

How civic open data can help make us safer

A federal government commitment to open data — epitomized in a White House “datapalooza” last Friday — has catalyzed the development of apps and tools that can help enrich citizens’ lives and help keep them safer. 

We’re no stranger at T4 America to the idea of using open government data to help ordinary citizens better understand their transportation system and how federal and local transportation policy needs to change to make them safer. We’ve regularly used public data from the U.S. Department of Transportation to seed useful tools, like the interactive map of ten years of pedestrian fatalities (Dangerous by Design) that uses the federal traffic fatalities database, or the nationwide map of all U.S. deficient bridges (The Fix We’re In For) sourced from the regular National Bridge Inventory submitted by states to the federal government each year.

The White House followed up their announcement of safety.data.gov earlier in 2012 with a day-long “datapalooza” in Washington, D.C. last week that brought together organizations and developers interested in safety data specifically.

There were some impressive demonstrations of what nonprofits and developers and public agencies have been able to create via public data sets. The real estate company Trulia showed how they’ve used local crime data to add heat maps to home listings or map searches to show how safe a neighborhood is in a city or town, relative to the rest of the city.

But perhaps the most impressive app on display came in a “the future is here” type of moment. Pulse Point is an app that leverages incredibly valuable-yet-usually-untapped skills dispersed among people all around you (CPR training) to solve the perpetual problem of a limited number of paramedics in a wide area to handle cardiopulmonary crises.

If you have CPR training, you sign up and register yourself and get the PulsePoint app. Partnering with local jurisdictions to make their 911 data available in realtime to the app makes it possible to “dispatch” all nearby CPR-trained people via their smartphone geolocation in the immediate area of someone needing CPR, while paramedics are also concurrently dispatched and en route. For someone in crisis, the 5 minutes between getting CPR from a trained expert at the store next door while waiting for paramedics to arrive could mean the difference between life and death.

It’s a stirring example of the same kind of cooperative sharing that’s made Zipcar and Car2Go and bikesharing and tool co-ops so successful in the last few years, but instead of cars or power drills, people are sharing something so valuable that it can save a life. Needless to say, the PulsePoint presentation received more than a polite round of applause at the end. You could tell that people who hadn’t seen it before were a little stunned.

But what does this have to do with transportation, per se?

Transportation data — and more importantly, having that data organized, accessible and public — is becoming more important than ever as declining transportation revenues have made it more important than ever to measure what we’re spending and see if we’re getting adequate bang for the buck.

MAP-21, the transportation bill passed this summer that goes into effect in just a few days, hopefully represents a transition away from the era of blank checks handed out to states without little accountability for measuring how those dollars get spent. What did they buy? Are we better off after a hundred million dollar project is finished? Is congestion reduced after spending a billion dollars? Are we healthier?

MAP-21 had a lot of references to “performance measures” — though there are still many question marks as to what those performance measures will actually be. But one thing you absolutely must have to measure performance is clear, organized, standardized, and open data. Taxpayers should be able to measure the performance of their transportation spending without having to file open records requests. App developers should be able to easily use available data to provide ever more transparency about decision-making to the very people funding the spending.

Of course, exactly what we decide to measure will have a huge impact on what does and doesn’t get built in the future. What will those performance measures be? What will DOT recommend?

I’m glad you asked. The US Department of Transportation is gathering public input right now on the new MAP-21 performance measures and other metrics with a public, web-based tool that anyone can weigh in with. Their forum closes this Sunday, but if you have the time today, stop by their idea forum for performance measures and offer your two cents. Here are some that we’re supporting and asking our supporters to “vote up”

It’s not too late: join us today to learn about communicating transportation issues in 2012 and beyond

Are you curious how to talk about transportation best resonate with the general public? Do you want to know how to make sure that transportation gets covered during a busy news cycle in the period leading up to the 2012 election (and beyond)? Are you interested in increasing your outreach to local reporters?

Join us today, Thursday September 13 at 2:00 PM Eastern Time, for “Communicating Transportation Issues in 2012 and Beyond,” the most recent presentation in our Transportation Vote 2012 series.

Register here

This online presentation on communication and messaging transportation reform featuresDavid Goldberg, communications director for Transportation for America, and Hilary Reeves, communications director for Transit for Livable Communities in the Twin Cities. David will share basic concepts about framing the issues and choosing appropriate messages, based on previous opinion research and his experience as a longtime former journalist. He also will discuss about lessons learned from recent events, including metro Atlanta’s disappointing transportation vote.

Hilary will focus on media relations from a local perspective, including cultivating relationships, managing news flow, and ideas on how to win attention in a crowded news cycle. You will have opportunities to ask questions of both speakers.

If you haven’t already, sign up now and join us this afternoon at 2 p.m. If you’re unable to make it, we will be posting a summary and the audio from the session soon, so check back.

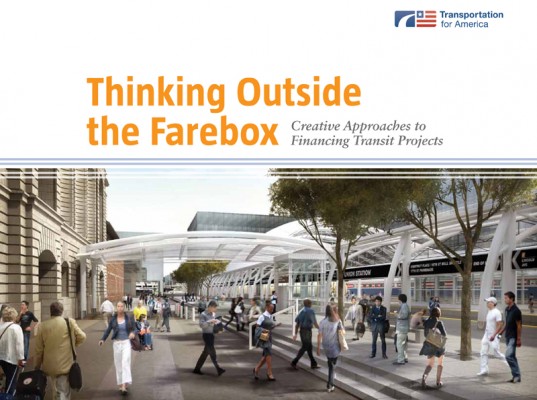
With cities and suburbs clamoring to build new transit systems, a new book showcases creative financing approaches for getting them built

This new free guidebook from Transportation for America is designed to help community leaders across the country meet the demand for transit by raising money to build and operate it outside of the traditional federal funding sources.

Download the full guidebook (10.8mb pdf)

Find out more about the guidebook in the resources area.

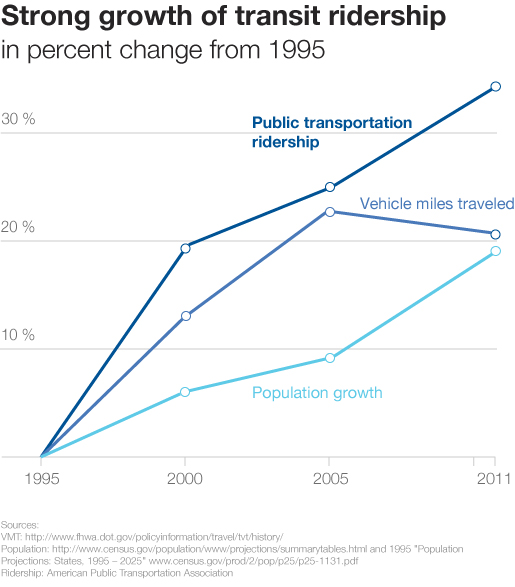
The demand for public transportation service is at its highest point in 50 years.The causes are many: rising gas prices, an increasingly urbanized population, growing numbers of seniors, and the preferences of the “millennial” generation. These factors and more are contributing to soaring ridership on existing transit routes. And more communities today are looking for funds to build and operate rail and bus lines than ever before.

Yet a combination of ideological gridlock in Congress, dwindling federal gas tax revenues, and the elimination of earmarks have made the traditional approaches to building transit much more challenging. But despite these obstacles, many communities are finding creative ways to move ahead. From Tucson to Charlotte, communities across the country are rounding up funding from sources outside of the traditional federal funding sources to build tomorrow’s transportation system today.

Growing public interest in transit is leading many communities to look for ways to create or expand their transit systems, but as more communities apply for money from a shrinking piece of the pie, the already over-subscribed traditional federal programs for transit won’t be able to fund every project seeking assistance. To make the money go further, the New Starts transit program, the main source of funding for new transit systems, has recently covered one-half of project costs, down from 80 percent in the past, with some projects getting as little as one-third of their required total.

Even with this policy in effect the waiting list grows longer every year.

But all is not lost. There are ways to pay for new transit investments without waiting so long, and a growing number of communities are pursuing them. But doing so requires more sophistication in the art of project finance than has been needed in the past.

Someday—soon, we hope—the federal government may respond to the high level of demand for new transit investments by increasing funding available to communities. Those of us who aspire to provide these options for people in our communities must continue to work toward that goal. In the meantime, though, we can demonstrate the depth of the need and the strength of our desire by finding our own creative ways to make these projects happen.

This new guidebook is a first step toward that goal. We’ll be posting excerpts and stories here in the coming days, but you can download the full book today.

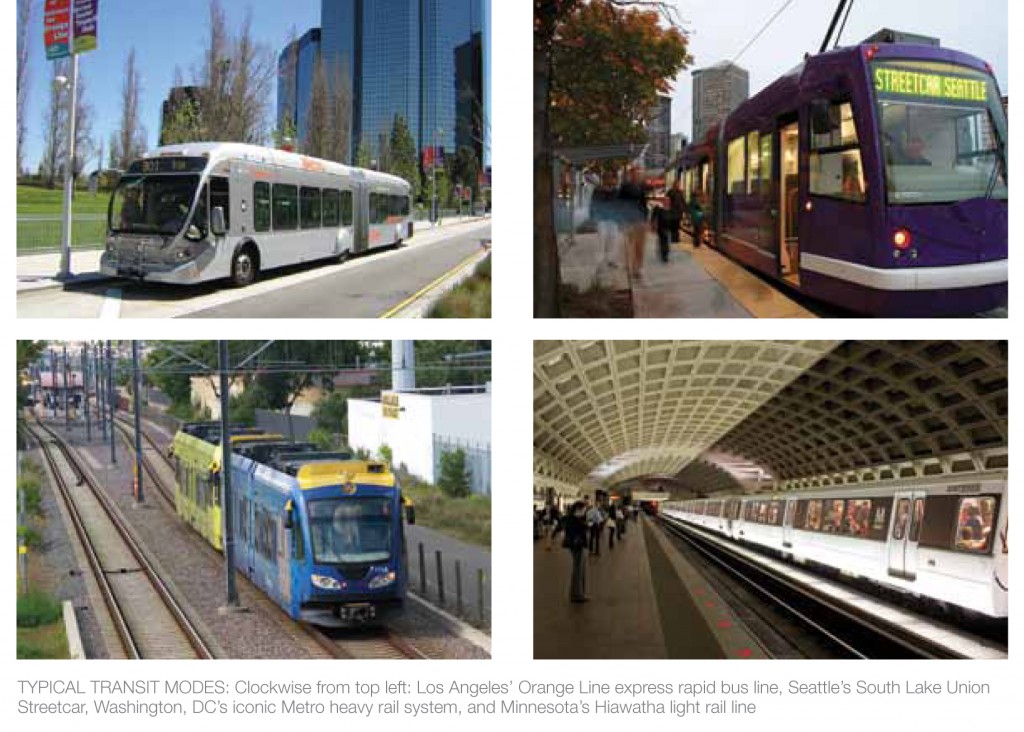
Top Left: Photo courtesy of the Metro Library and Archives, top right: Flickr photo by the Seattle DOT, bottom right: Flickr photo by Andrew Bossi, bottom left: Flickr photo by Steven Vance


Senate plan to give local communities more control in making their streets safer could be in jeopardy

It’s always hard to tell for certain what’s really happening on the inside during House-Senate conference committee negotiations on the transportation bill. Nearly all of the meetings are in private for the most part and confirming rumors and hearsay on what’s really happening is always very difficult. Which is one reason why you haven’t read all that much in the way of daily coverage of conference here on the T4 blog.

But we’re fairly certain that a crucial provision in the Senate bill is under attack by some — and we need your help to defend and preserve it in the final transportation bill that will emerge from conference.

Known as the Cardin-Cochran amendment, this provision that was included in the Senate bill would help our cities and towns revitalize Main streets, improve public health, and make streets safer for everyone who uses them. It does that by giving them the ability to make choices about how transportation dollars are spent in their communities.

Can you take just a minute to tell your senators and representative to preserve and defend the Cardin-Cochran amendment?

Many of you wrote your senators over the last few months about this, going back to when it was just an amendment in the Senate. That groundswell of support, as well as broad outreach from mayors across the country, resulted in a huge victory when it won bipartisan support and was included in the Senate bill. But now that provision is under attack and could be scrapped as the House and Senate negotiate a final transportation bill if we don’t fight for it. Today.

If this important provision isn’t included in the final bill, Congress would take transportation choices away from local governments and give the state sole power over them.

Senators already recognized that they should give control and choice back to local governments to invest in the smaller projects in their communities that revitalize their communities while building out a full transportation network that is safe for everyone.

These issues are being decided this week in the conference negotiations. So please tell your Senator and representative to preserve the Cardin-Cochran provision.

Note: Read more about this important provision here in this post with downloadable fact sheet.

Final House-Senate bill must prioritize the repair of our bridges and roads

The House and Senate are hashing out differences between their transportation bills right now.

Tell your senator or representative to support the Senate’s strong plan to prioritize the repair of our roads and bridges.

After months of hard work and thousands of calls and e-mails from many of you, we’re close to finally seeing a full transportation bill reach a final vote. A select group of House and Senate members are negotiating the final transportation bill right now in a conference committee, and they have immense power to affect the final product.

Can you take a minute to tell your senators and representative to prioritize the repair of our roads and bridges during negotiations?

More than 69,000 U.S. bridges are structurally deficient and almost half of our nation’s roads are rated below “good” condition. We continue to spend limited transportation dollars to build roads we can’t afford to maintain — while our existing infrastructure cracks and crumbles due to deferred maintenance.

The Senate’s bill would make the upkeep of our roads and bridges a top national priority. Now we need to make sure that this same priority is adopted as part of the final transportation bill that will go back to the House and Senate for a final vote.

It’s urgent that the final bill preserve these strong Senate provisions for repairing roads and bridges, and those decisions are being made right now. We’re so close. Tell your senator or representative to to support these provisions in conference committee.

There’s no way to know how much longer these conference negotiations will go on — time is short to signal our support for the strong provisions from the Senate bill.