UPDATE: We have updated our map to reflect new project funding data that has been released online. Check out the map below for specific information about projects. Approximately $2.46 billion remains unobligated across 60 projects.
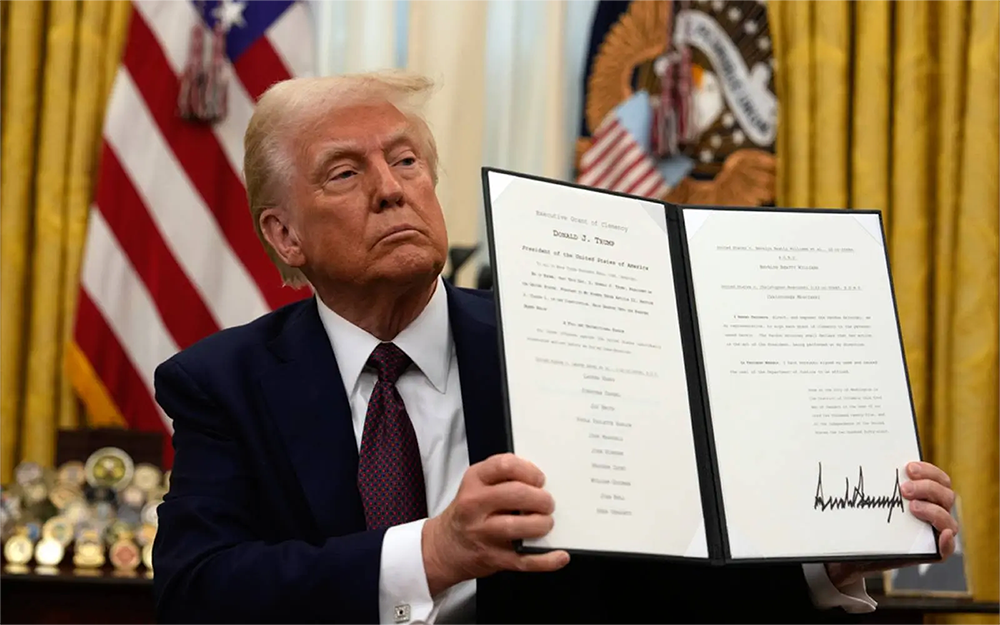
On April 30, the House Transportation and Infrastructure Committee will look to cut billions in funding to enact the President’s agenda through the budget reconciliation process. They plan to repeal up to $3.1 billion in funding for dozens of communities with awarded projects to reconnect communities divided by transportation infrastructure.
The House Majority’s Transportation and Infrastructure Committee just released text for their markup of the reconciliation bill. In it, they call for a full repeal of unobligated funding for the Neighborhood Access and Equity program, which provided over $3.2 billion in funding for reconnecting communities projects at passage. We found that up to $3.1 billion (97 percent!) remained unobligated and are now in the sights for elimination.
Why is funding at risk?
There has been a steady stream of confusion and uncertainty around transportation funding due to actions from the executive branch, with a very recent example being especially egregious dispute orders from a federal judge to get on with the programs. However, while the executive branch is flooding the zone with policy announcements and actions stemming from dubious legal authority, Congress is proceeding with a process rooted in law that will take billions in funding for dozens of communities’ projects to undo divisive infrastructure.
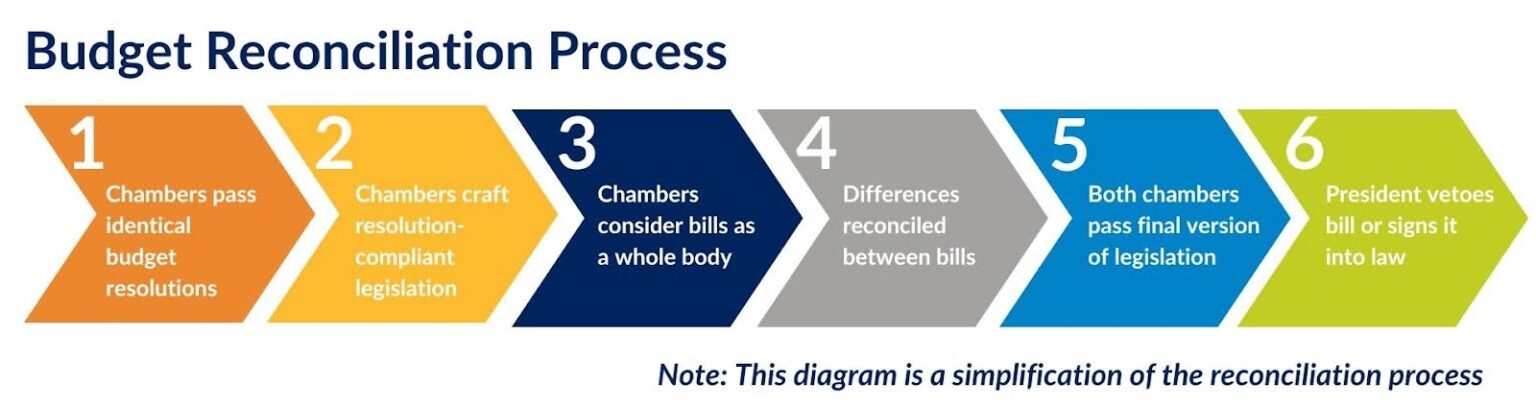
The Congressional majority is in the midst of the budget reconciliation process in order to pass a bill that achieves President Trump’s priorities. Reconciliation is a relatively complicated, multi-step process—but it comes with the distinct advantage of only requiring a simple majority vote, rather than a filibuster-proof 60-vote majority in the Senate, to pass. For more information on this process, check out the explainer on the process’s implications on our Smart Growth America site and the Congressional Research Service’s recent FAQ. Congress is currently on Step 2 of its process (see below), with both the House and Senate having adopted the same budget resolution and instructions for reconciliation. Now, the chambers must meet for scheduled bill markups to identify where each committee will identify cuts to programs to meet the framework of their budget resolution.
What should we expect for transportation?
The House of Representatives’ budget resolution framework is sweeping, calling for large funding cuts to pay for continued and potentially expanded tax cuts, while still increasing the federal deficit by up to $2.8 trillion.
Compared to other committees’ targets, the House Transportation and Infrastructure Committee’s budget outline for cuts is relatively small, with a top-line deficit reduction of only $10 billion. However, that top line is deceiving. The committee is also looking to shift over $20 billion in funding to the United States Coast Guard for border security and take $15 billion for upgrades to Air Traffic Control systems, as directed by the White House.
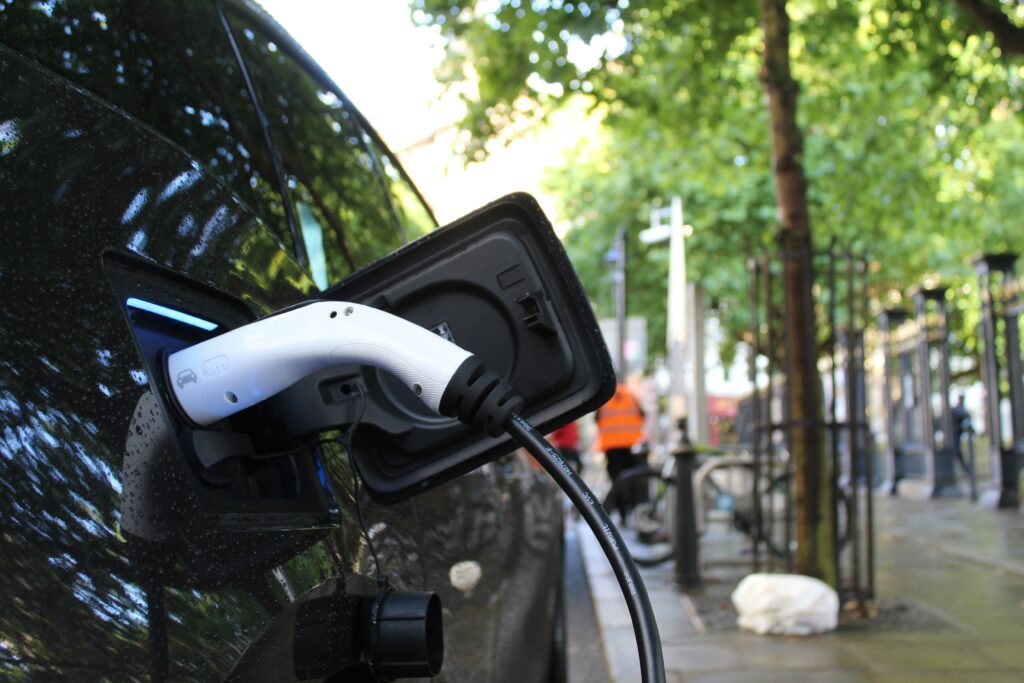
To pay for this, Transportation and Infrastructure Committee Chairman Representative Sam Graves needed to identify major program cuts and has proposed a $200 annual fee on electric vehicles, a $100 fee on hybrid vehicles, and a $20 fee on gas vehicles.
The cuts:
Due to the way funding was authorized for the Infrastructure Investment and Jobs Act (IIJA), programs funded by the law should be safer from potential cuts than other funding sources in this process.
What is not safe, however, are programs funded by the Inflation Reduction Act (IRA), including the Neighborhood Access and Equity (NAE) program, which added additional funding to projects similar to the Reconnecting Communities Pilot program to help more communities plan and build projects to repair divisive infrastructure boondoggles. Other programs that are up for repeal include Low-Carbon Transportation Materials, Environmental Review Implementation Funds, and more.
The program was in high demand when it was open for applications, with nearly 1,250 applications from communities in all 50 states, DC, and Puerto Rico, totaling $13.8 billion in unawarded funding requests.
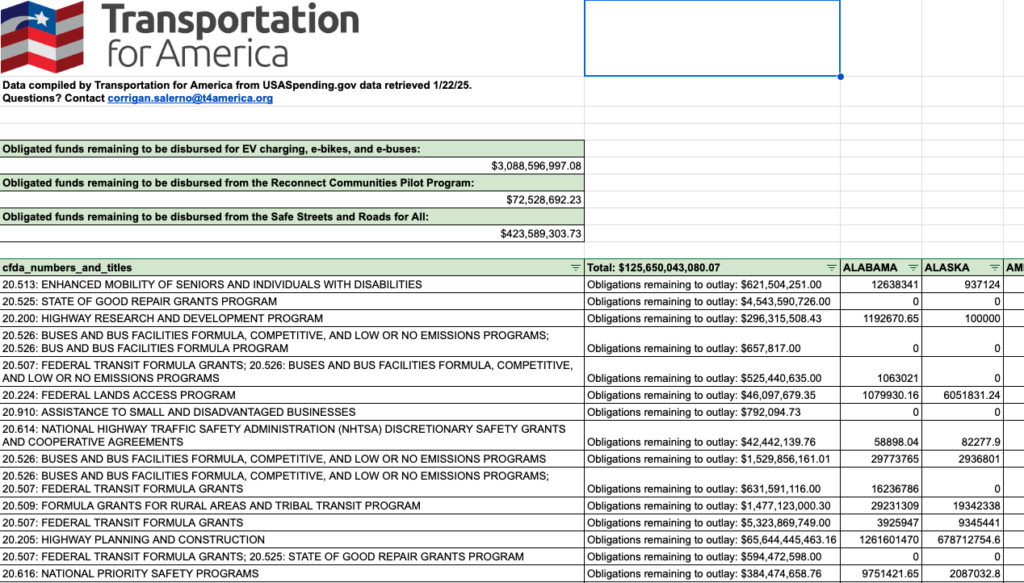
The Biden Administration awarded nearly 100 projects funding under the NAE program in federal fiscal year 2023. However, it seems the majority of communities did not reach final project agreements with the U.S. Department of Transportation before the transition between administrations. While public data can be delayed, our analysis of USASpending.gov award information finds that only about a quarter of awards (25 projects) have obligations logged. This means that the vast majority of these projects with existing funding announcements are at risk of having their funding taken away.
According to public data, $3.1 billion remains unobligated across 78 projects. If the Neighborhood Access and Equity Program is eliminated, the awarded funding could be removed, leaving those communities holding the bag and without the ability to complete projects.
Here are the projects that the Majority’s Transportation and Infrastructure Committee reconciliation bill would eliminate:
As the Trump Administration drastically reduces staff and professional capacity at the U.S. Department of Transportation, and the Secretary of Transportation continues to initiate confusing policies that inevitably delay the deployment of projects and policies in opposition, even when in conflict with the law, it is unlikely that much more funding has gone out to these communities. And now, with new USDOT policies threatening the ability of federal funding recipients to choose to enact policies promoting equity, the odds that funding prioritizing these projects moves forward are very slim. Already, the administration is disfavoring projects that reduce road capacity in grant programs regardless of context.
What now?
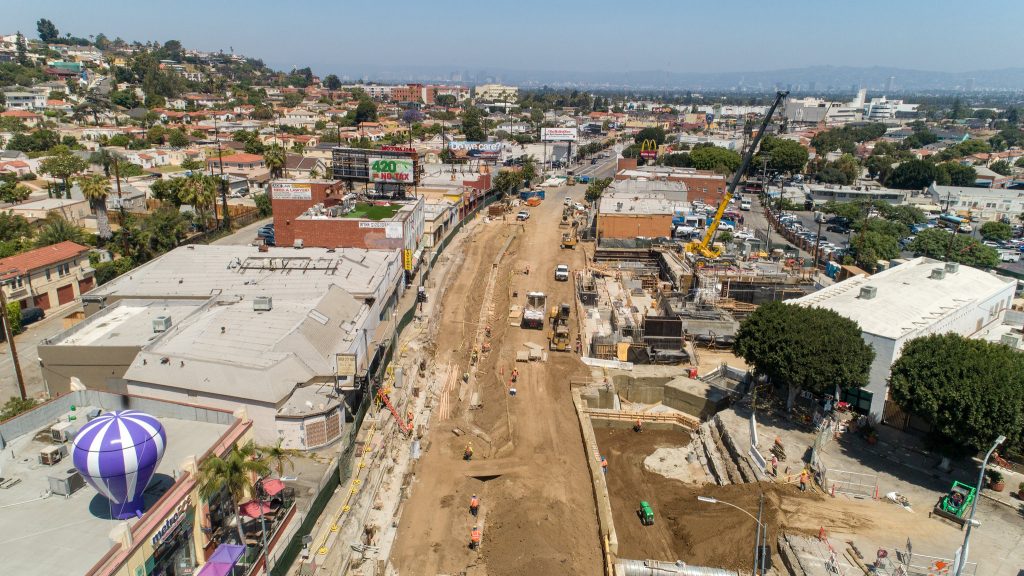
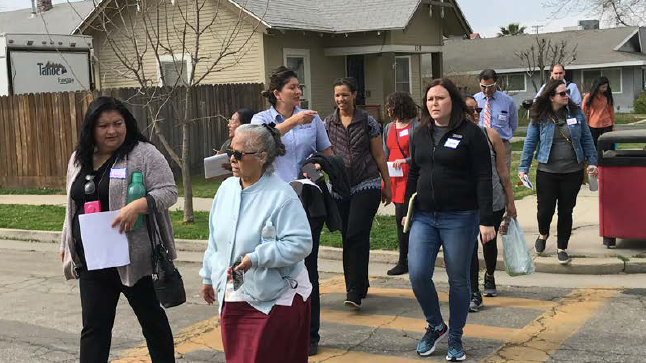
Reconnecting communities projects are not just about repairing old scars, but are about solving current problems and building toward a better future. With funding at risk for these critical projects, right now is the time to let your representatives know that these projects matter in your community. It is especially important to let Congress know why these projects are important. The outcomes of reconnecting communities projects speak for themselves: they focus on increased access to jobs, economic development, safer streets, and more reliable transportation, and often turn unproductive infrastructure over to more productive uses like housing or commercial activity.
Projects across the country and around the world have demonstrated the transformative power of these types of projects. In Rochester, New York, efforts to reconnect a community yielded private development worth more than 10 times the initial investment. In Chattanooga, Tennessee, replacing a limited-access freeway with a more connected and accessible boulevard continues to attract multi-million-dollar private investments. Economic development and reconnecting communities projects go hand in hand, and research has backed this long before the IIJA and IRA boosted funding for them.
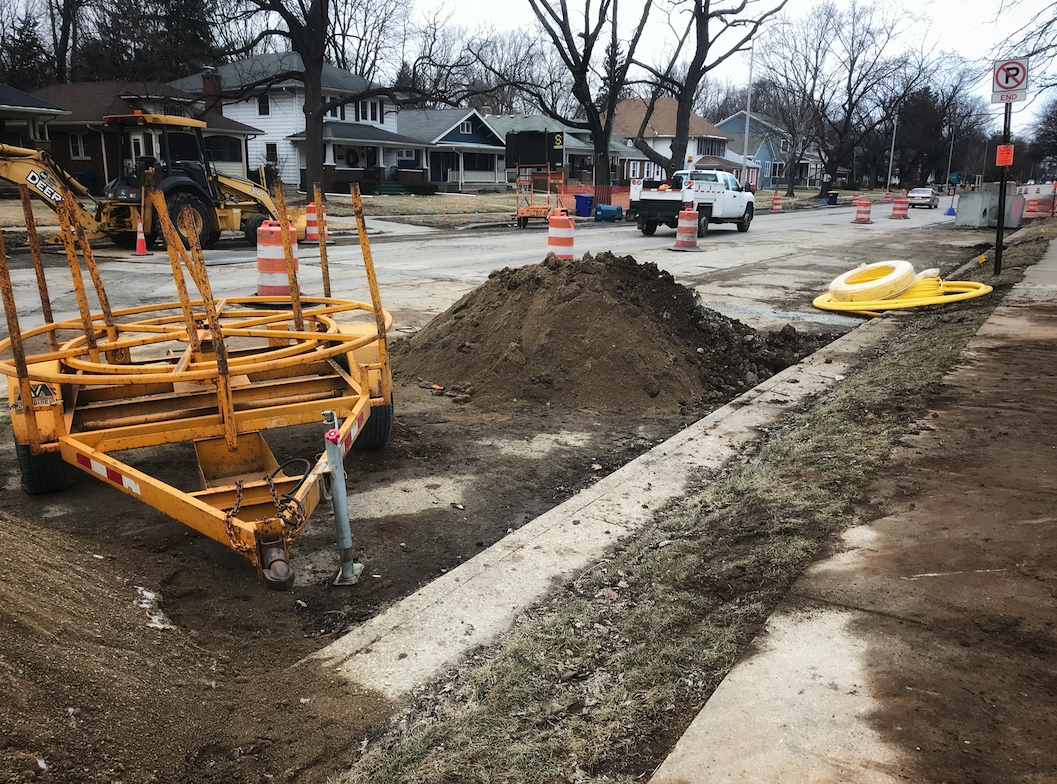
Cancelling pending reconnecting communities projects funded by the NAE grant program would be a major loss for communities across the country, and especially for the many rural communities in states home to less forward-looking DOTs, like the Seminole Nation’s Transit Plaza project in Oklahoma or the Manhattan Trail System project in Montana, that applied and were awarded funding.
Contact your House Representative and let your Senator know that you are concerned about the success of these projects and want to see the many benefits that they will provide come to fruition.
America Walks, the leading organization in the Freeway Fighters Network and one of our partners in efforts in Smart Growth America’s Community Connectors Program, is leading a sign-on opportunity for your voice to be heard.
We encourage you to find projects in or near your community and let your representatives know that you care about the success of these projects and that they matter for your community’s advancement. If you wish this program to continue, we urge you to let your representatives know as well. We’ve included info for identifying the Congressional representative for each project on this spreadsheet.