
Longer trips, faster speeds, fewer options: What’s really valued in the “value of time”?

A pedestrian walks along the edge of a road filled with cars.
Whose time are we saving? T4America photo by Steve Davis.

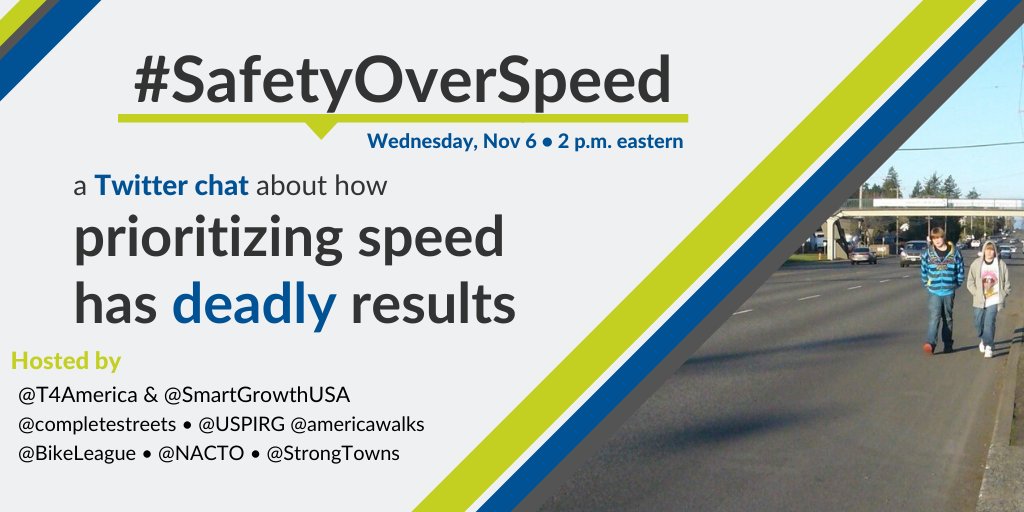
Despite its name, the federal “value of time” guidance doesn’t actually value travelers’ time at all. Instead, this arcane but influential measure focuses on one thing: vehicle speed. The result is more dangerous, less convenient travel for everyone.

Bear with us for this one.

This may seem completely arcane, but the federal value of time guidance has monumental implications because assigning a value to time gained or lost guides nearly every transportation decision. This guidance instructs transportation agencies on how to measure (1) the current performance of the existing transportation system and (2) the cost and benefit of future projects. In other words, when agencies are deciding whether to add a crosswalk or expand a highway, they use this guidance to help inform their decision. Unfortunately, current guidance is flawed, costing taxpayers’ time, money, and safety.

“Time savings” are mainly determined by vehicle speed

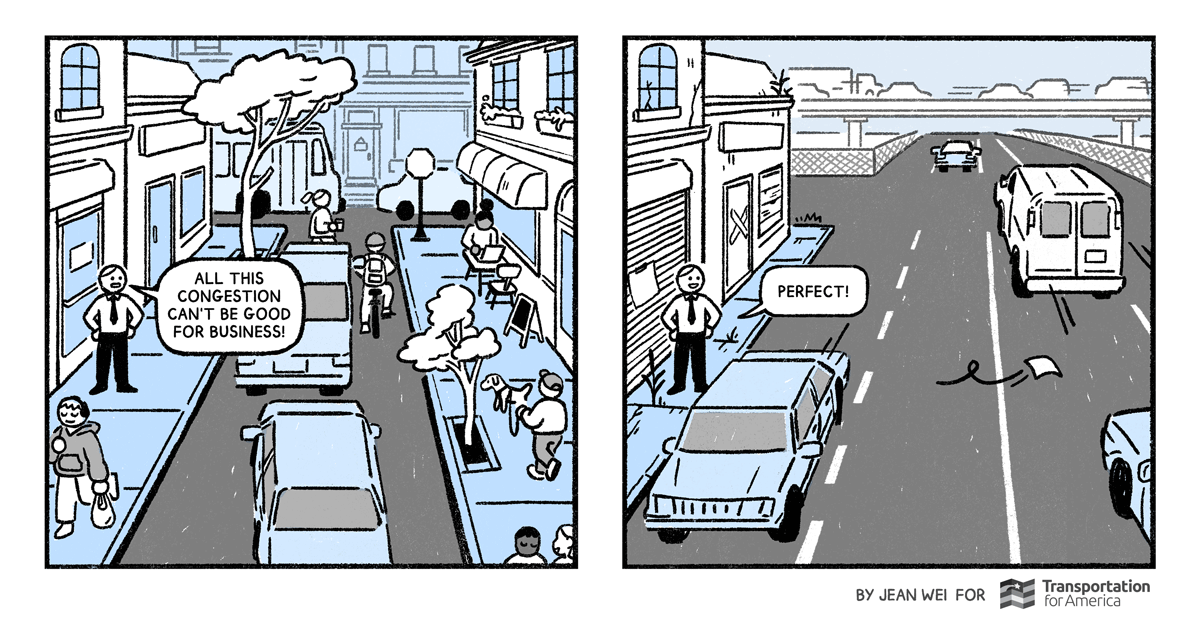
When modeling for time savings, agencies focus on only one thing: getting and keeping vehicles moving. As long as vehicles are moving faster, agencies predict that their new project will save time. It doesn’t matter if, to speed up vehicles, daily trips end up being longer and taking more time overall. 

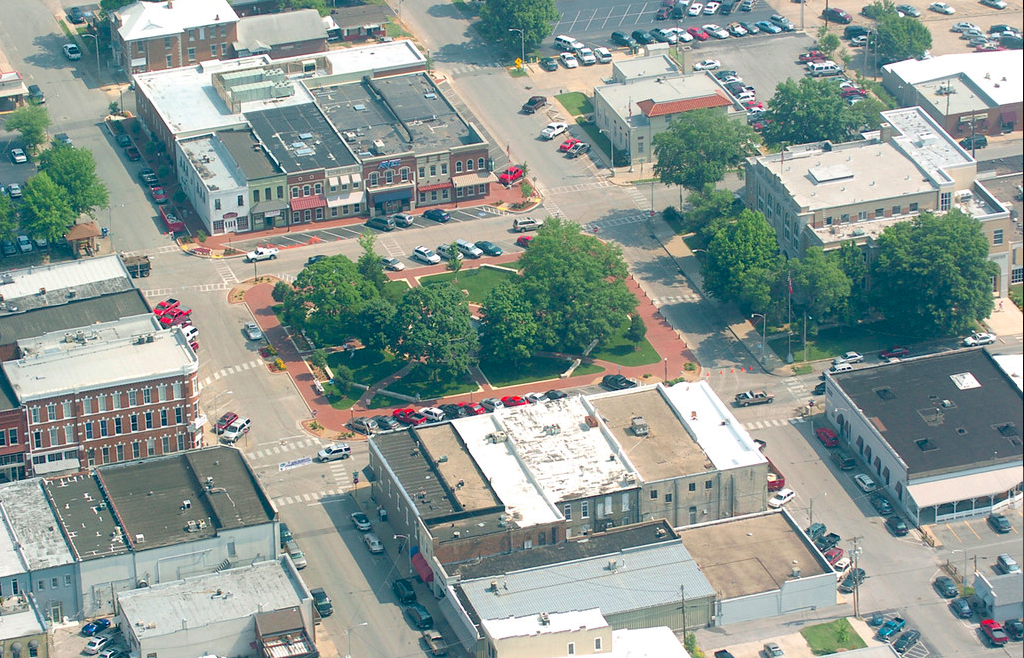
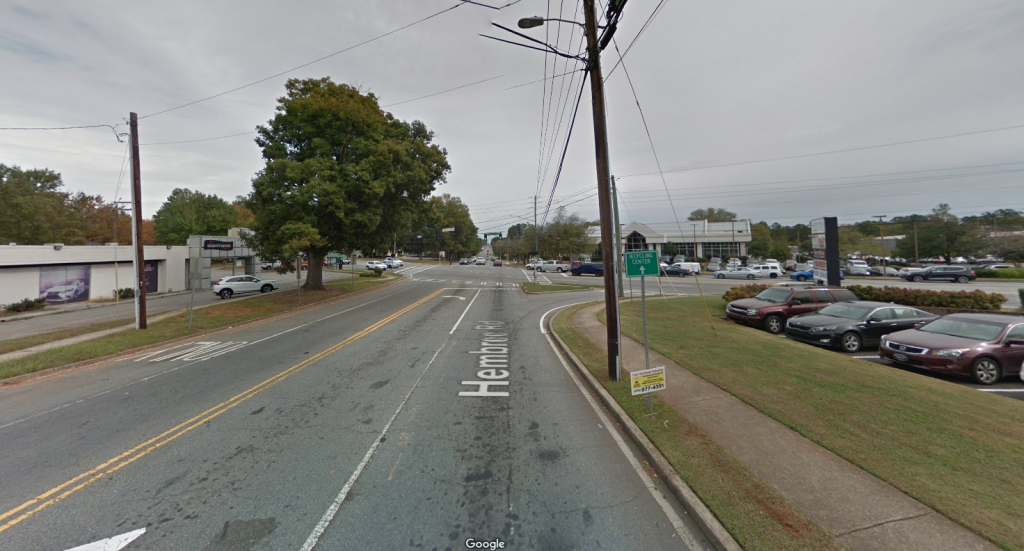
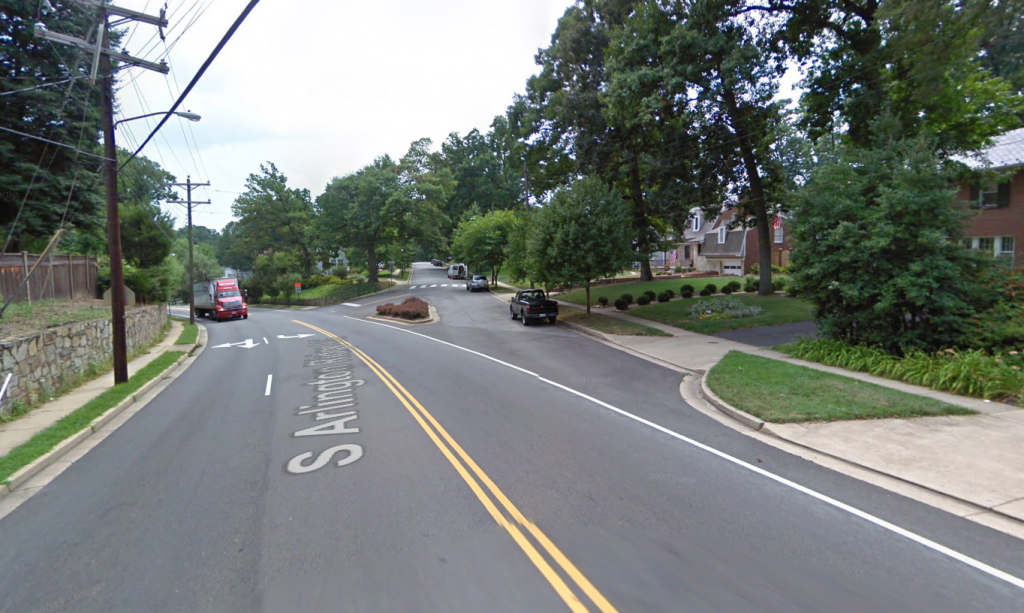
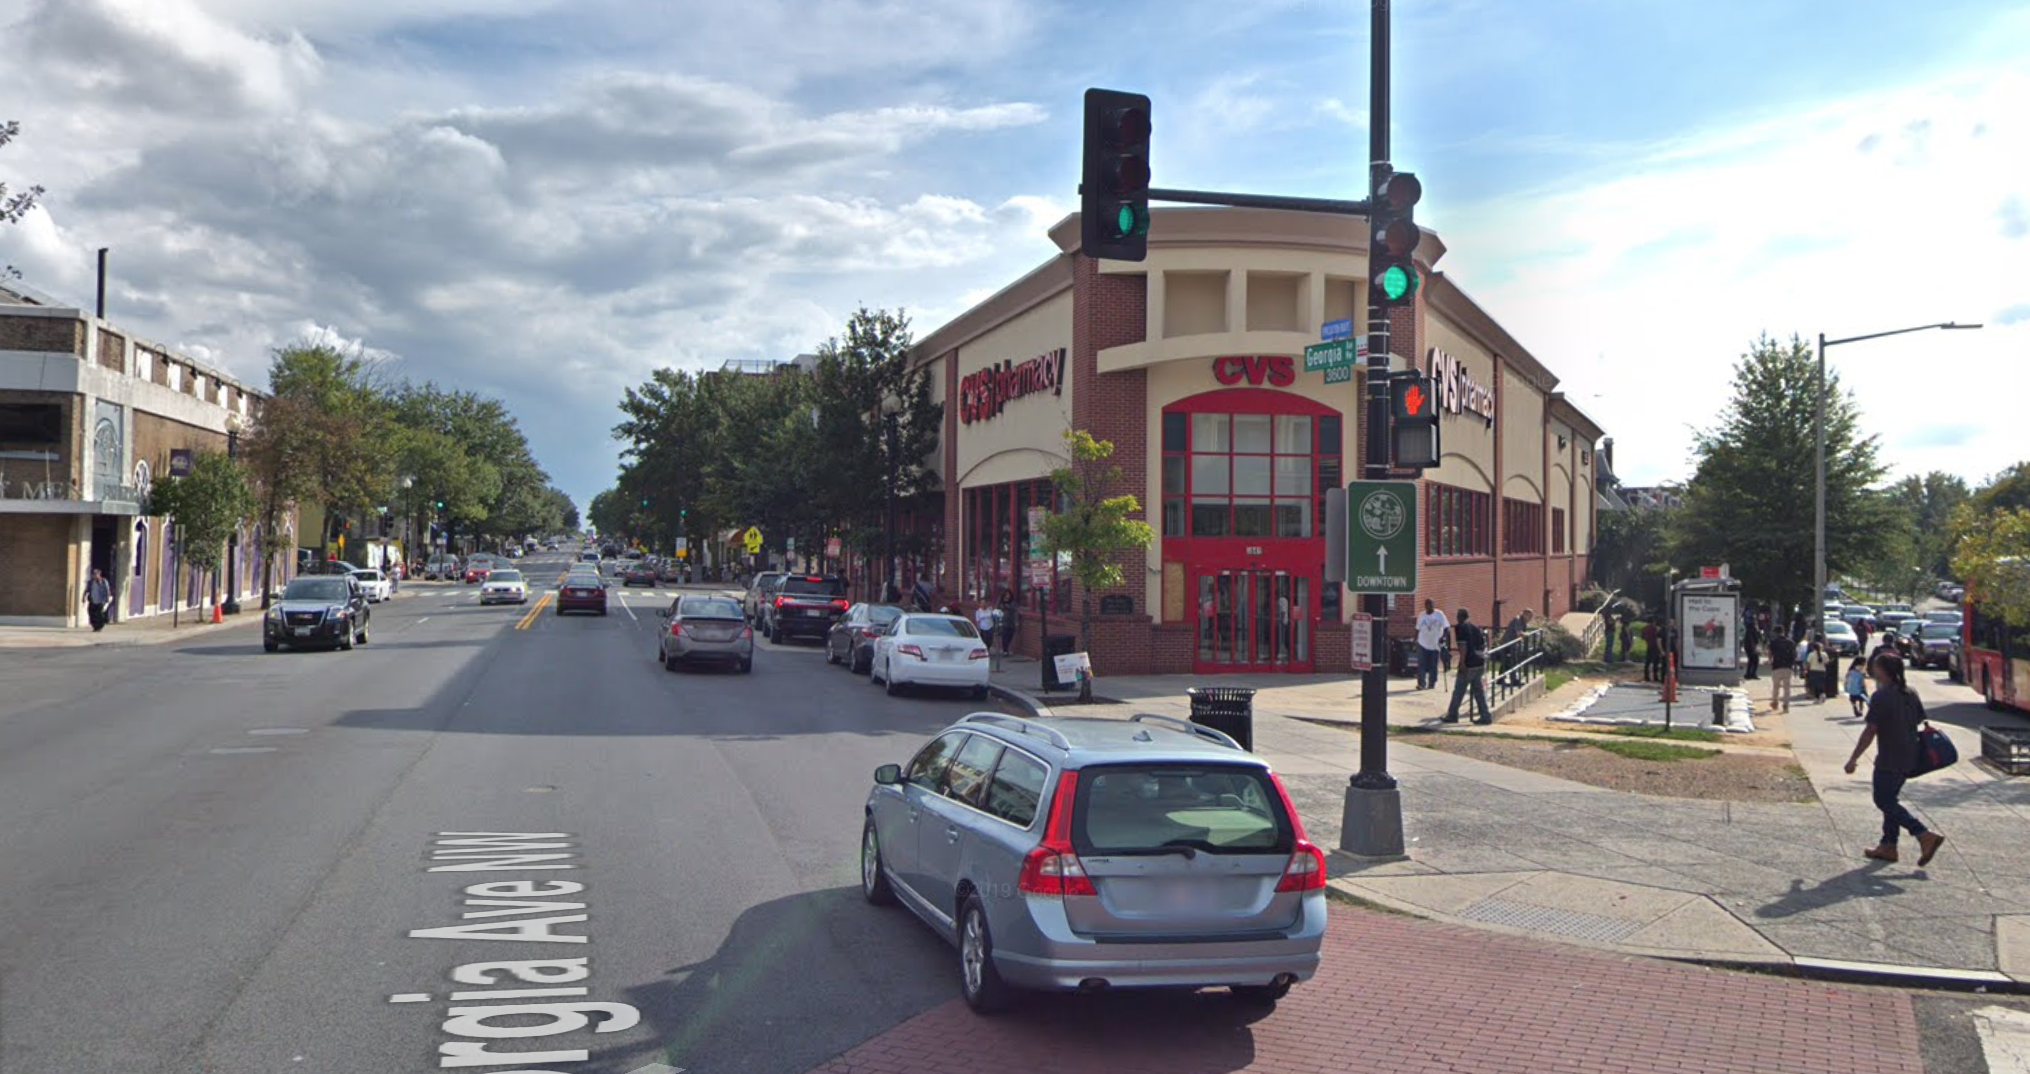
Imagine you’re driving to a grocery store located on the left side of a busy street. But allowing cars to turn left safely on this intersection would halt the flow of oncoming traffic and slow down car travel through the corridor. Instead, you have to drive to the next intersection and make three right turns to reach the grocery store. Your trip is longer, but overall, vehicle speeds stay high. This would be considered a time savings win under the current system.

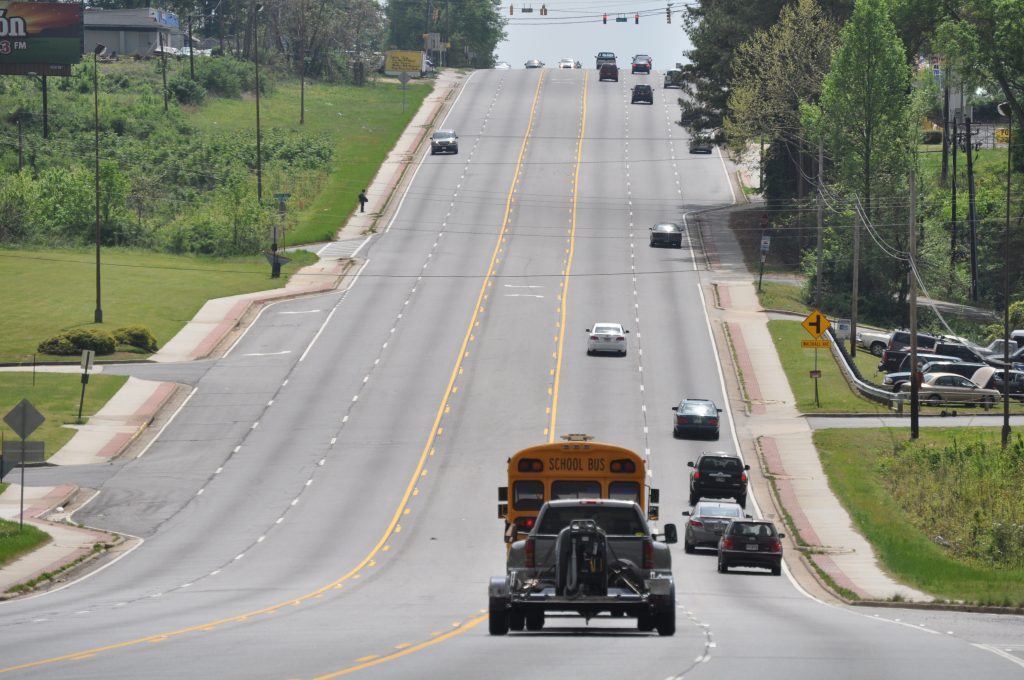
Expensive roadway expansions justified by projected time savings because they’ll result in less traffic—promises that often never materialize thanks to induced demand—are another example. As the State Smart Transportation Initiative recently pointed out, as roadways expand and speeds increase, people just tend to spread out more. “So, while the distance a traveler is able to reach in a given amount of time is increased, there are not necessarily additional destinations available to them,” as Aaron Westling at SSTI noted. Even if added lanes miraculously solve traffic and cars can go twice as fast, people will still find themselves taking longer trips as destinations move further apart.

Illustration produced for T4America by visual artist Jean Wei. IG/@weisanboo

How do agencies get their numbers anyway?

For vehicles and transit, agencies measure end-to-end travel times on a segment of roadway. Yes, you read that right—they aren’t measuring how fast people are able to travel from their origin to their destination but how fast people can travel on individual segments of road

Agencies can often believe they’ll help cars move faster, even though they’re relying on outdated or flawed models. Failure to account for induced demand is a great example of this. The result: time and money are wasted on projects that make travel longer, more dangerous, and in some cases, even slower.

Whose time is considered worth saving? Whose time isn’t even being measured?

The value of time guidance puts heavy value on the “nine-to-five” (or peak period) business trip. Travel to and from work is given greater importance than what the guidance refers to as “personal” or “leisure” trips like travel to schools, daycares, and doctors’ offices, let alone off-peak/non-traditional work trips that are more common for low-income workers. To explain this imbalance, the guidance claims that the schedule of work, dictated by the employer, creates more structure for measurement, even though schools and daycares track late arrivals and doctors can cancel appointments when patients arrive late.

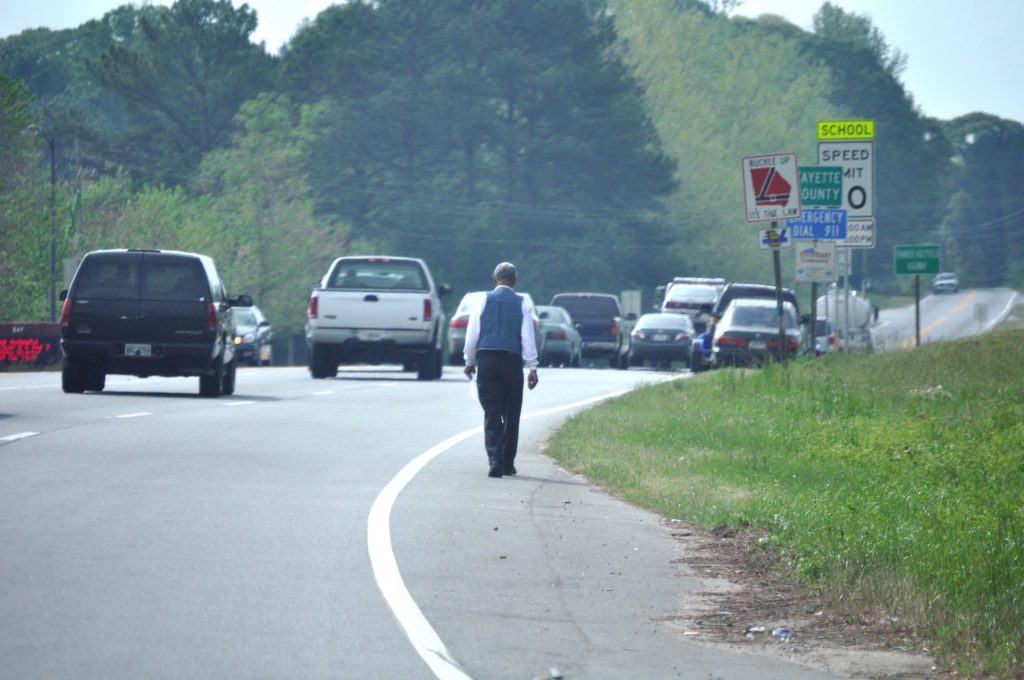
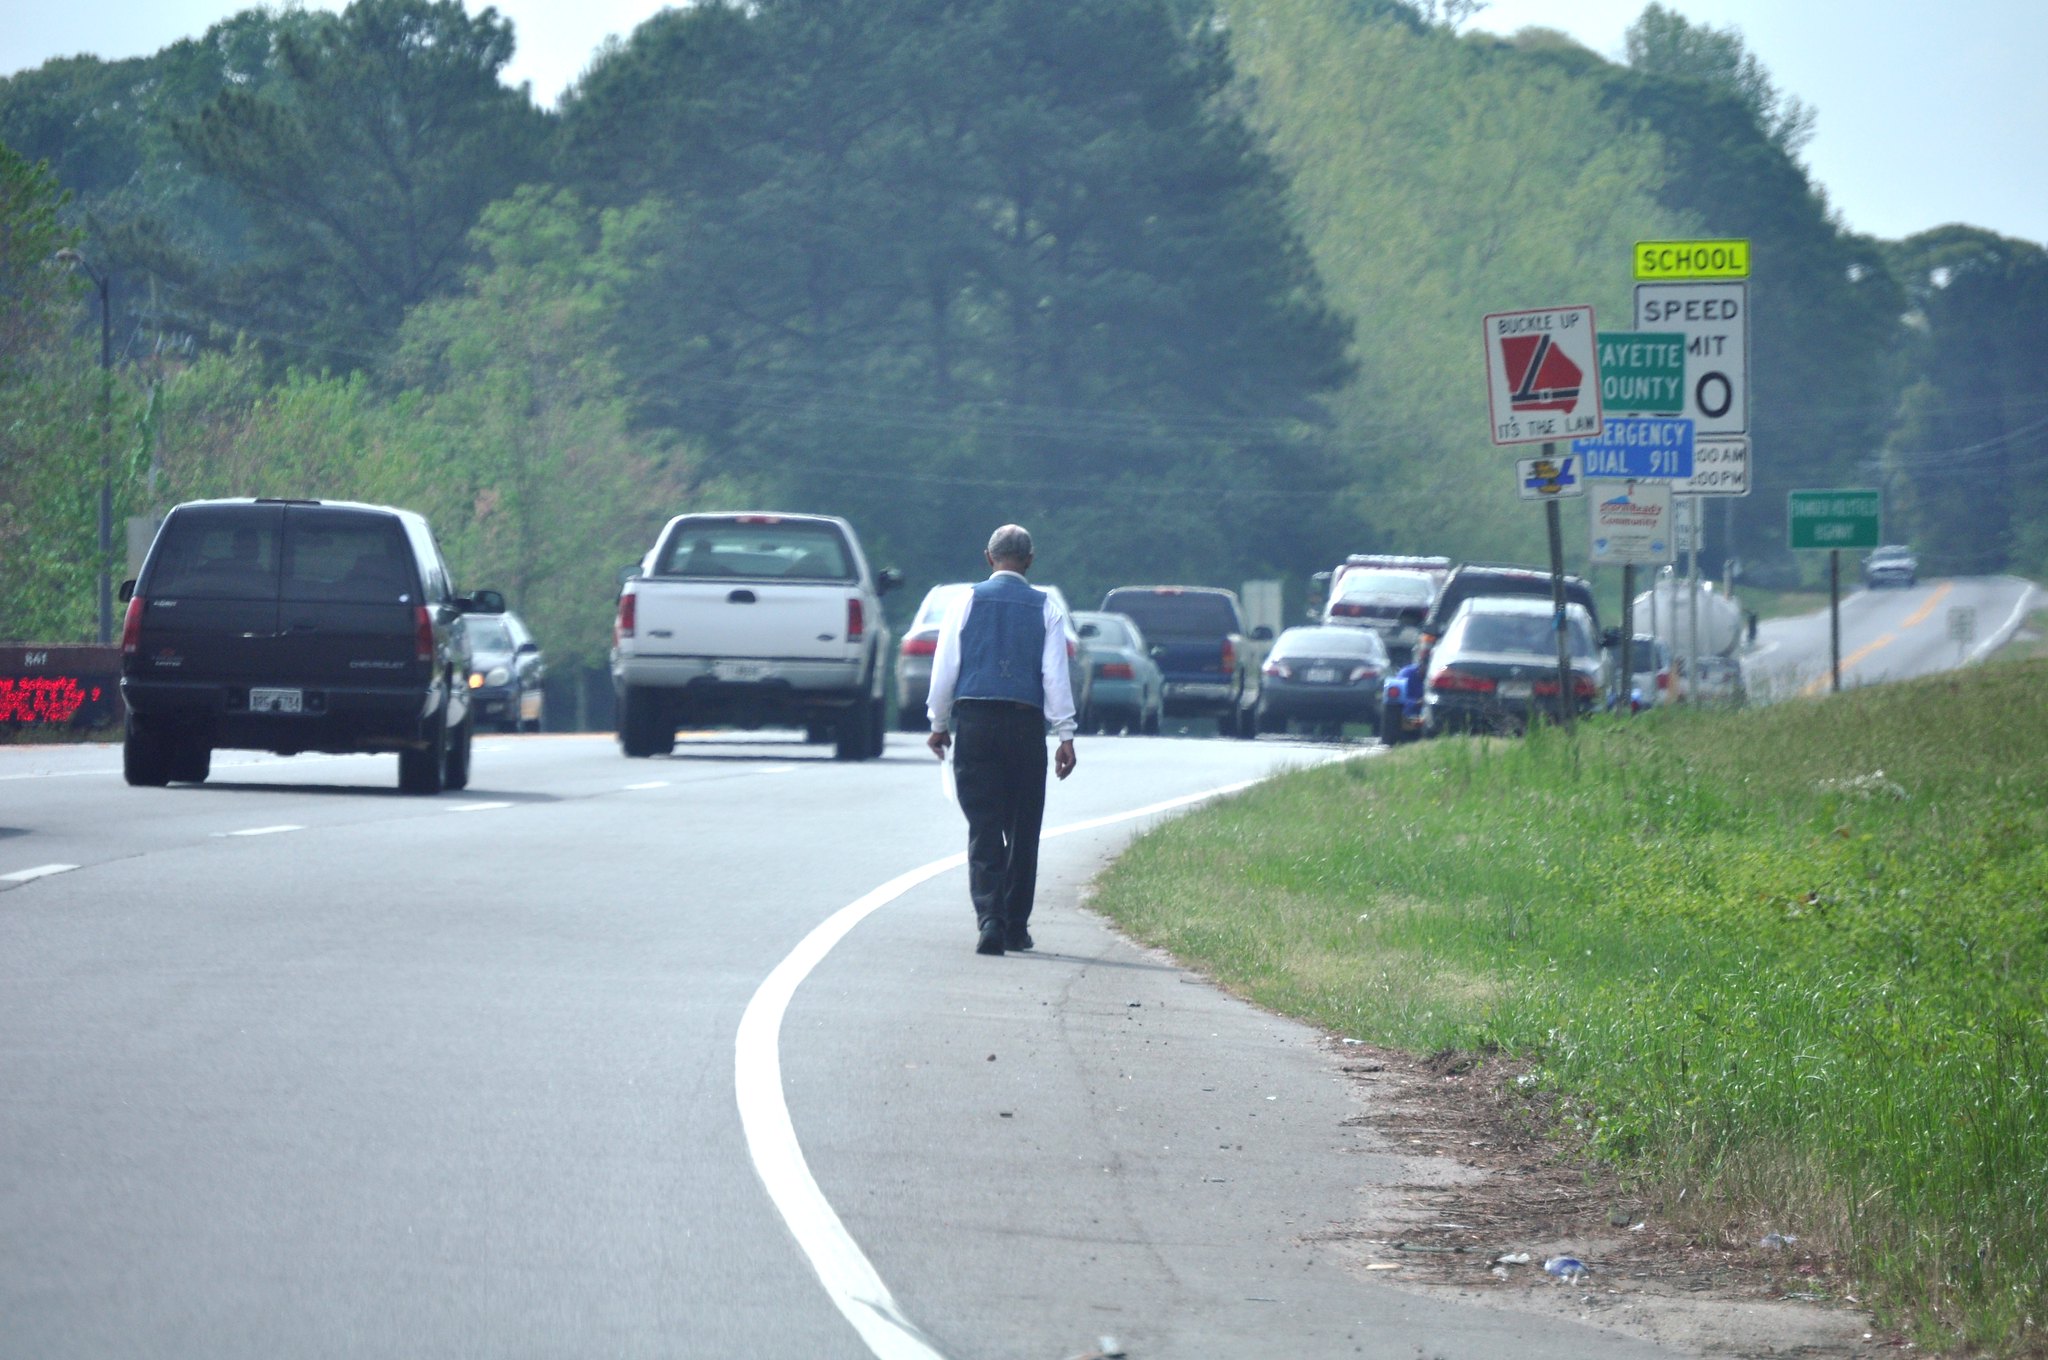
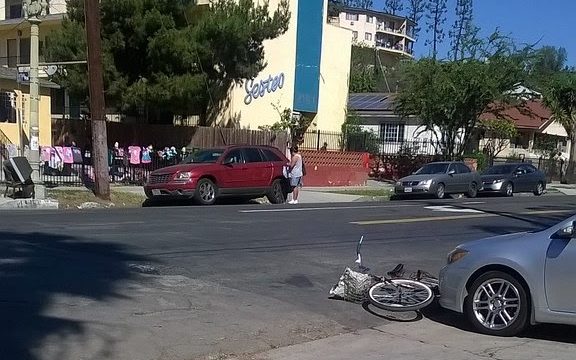
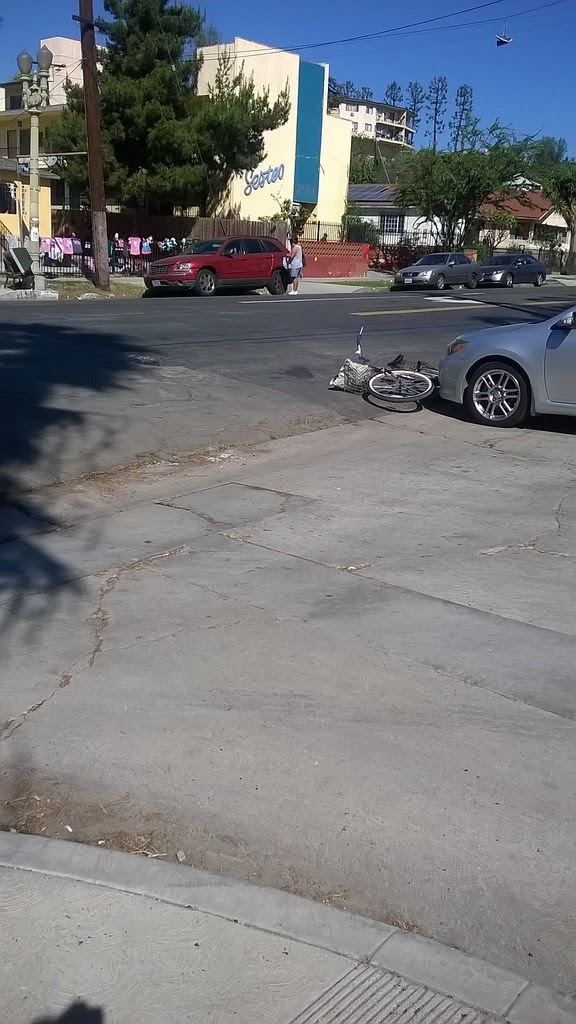
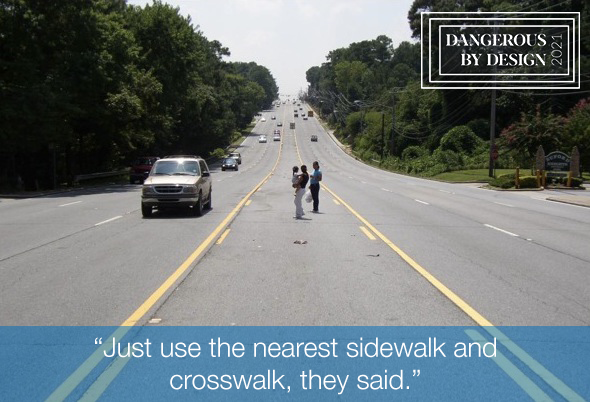
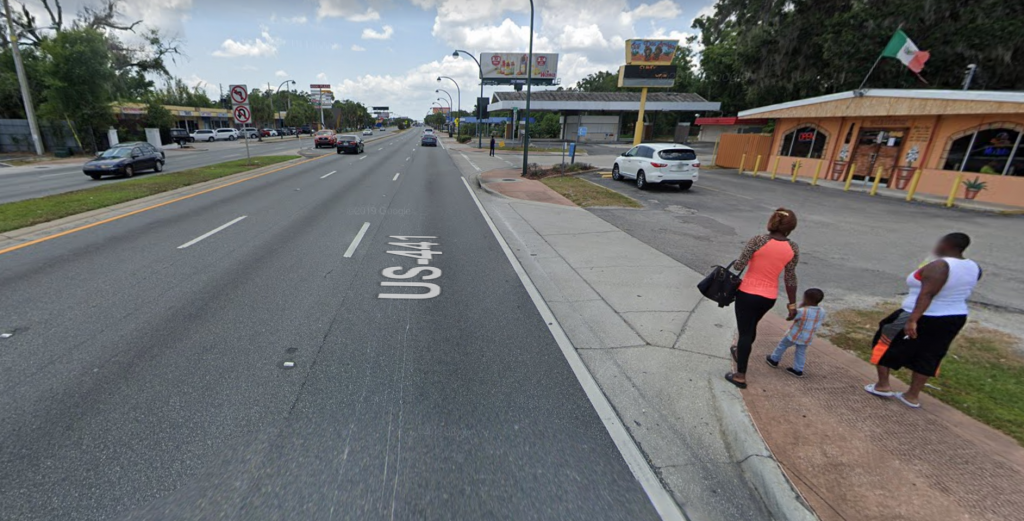
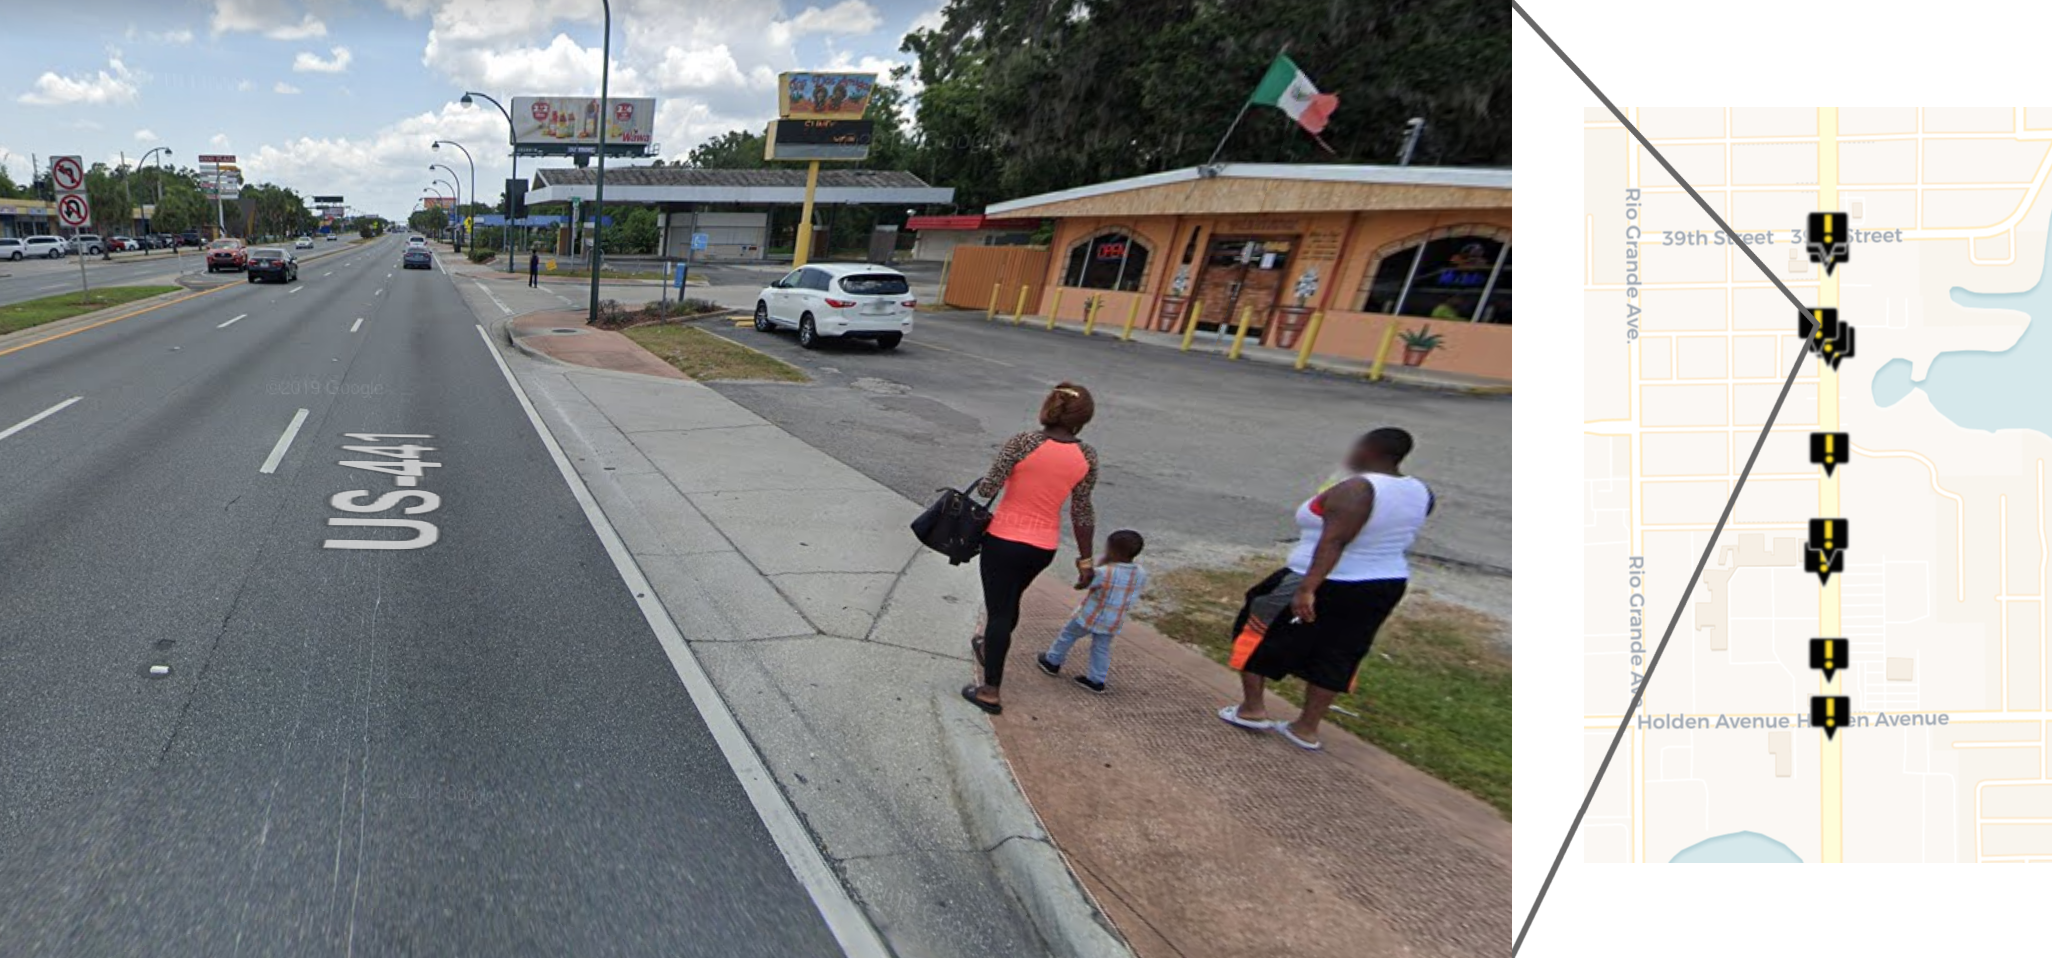
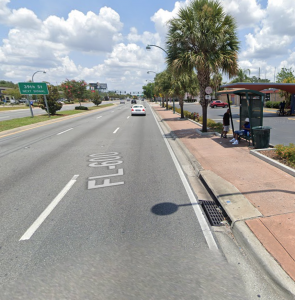
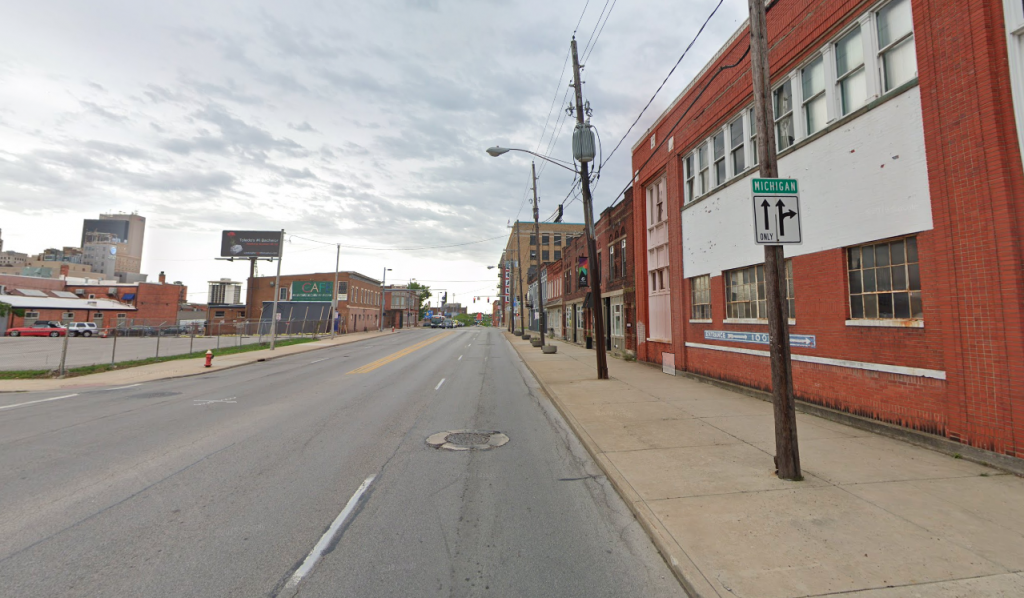
Local travelers get the worst of this bias. While agencies focus on making it easier for cars to move quickly, a highway that destroys a community (see I-49 in Shreveport) is easily justified on the grounds of time savings, even if locals lose 15 minutes having to walk out of their way to cross a now-dangerous street or can no longer walk to their destination at all because a new highway blocks their path. The impact to their time is literally never considered as part of the process of developing such a project.

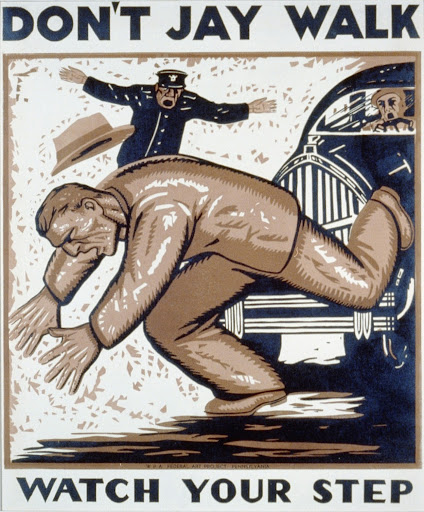
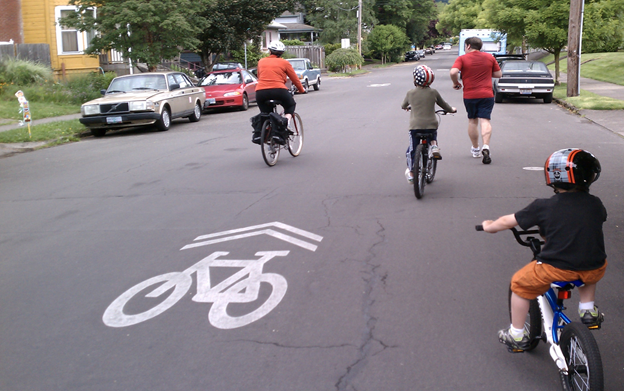
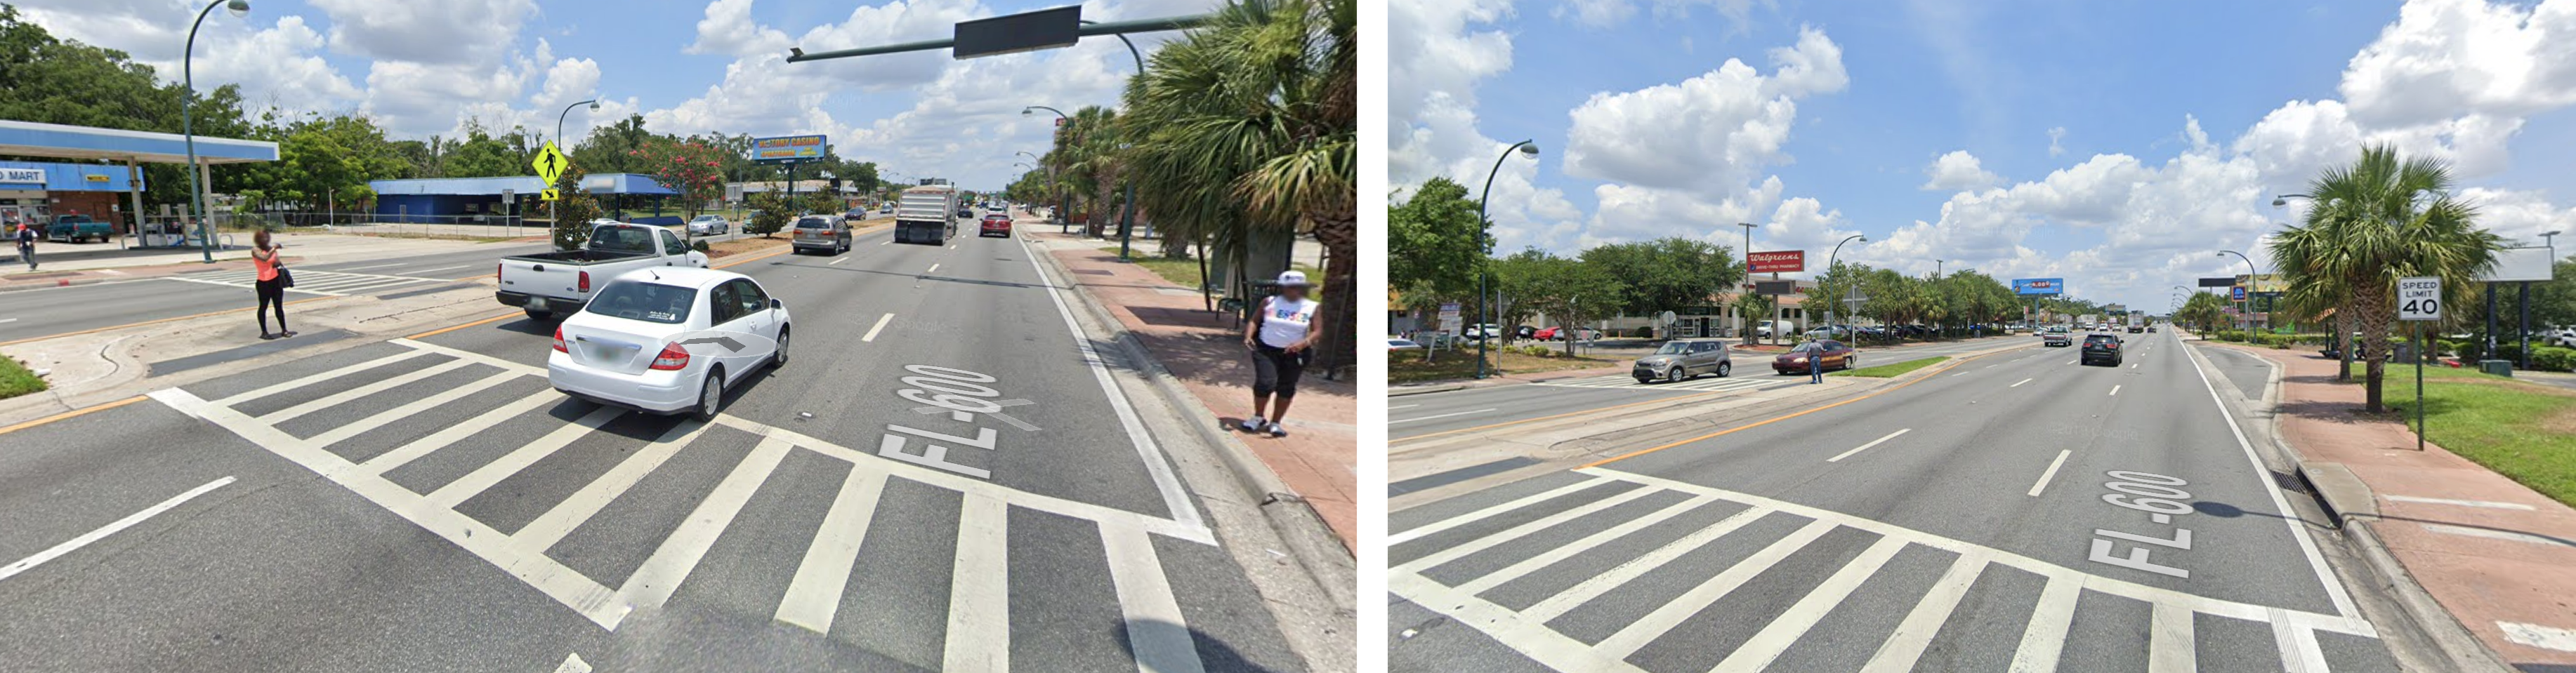
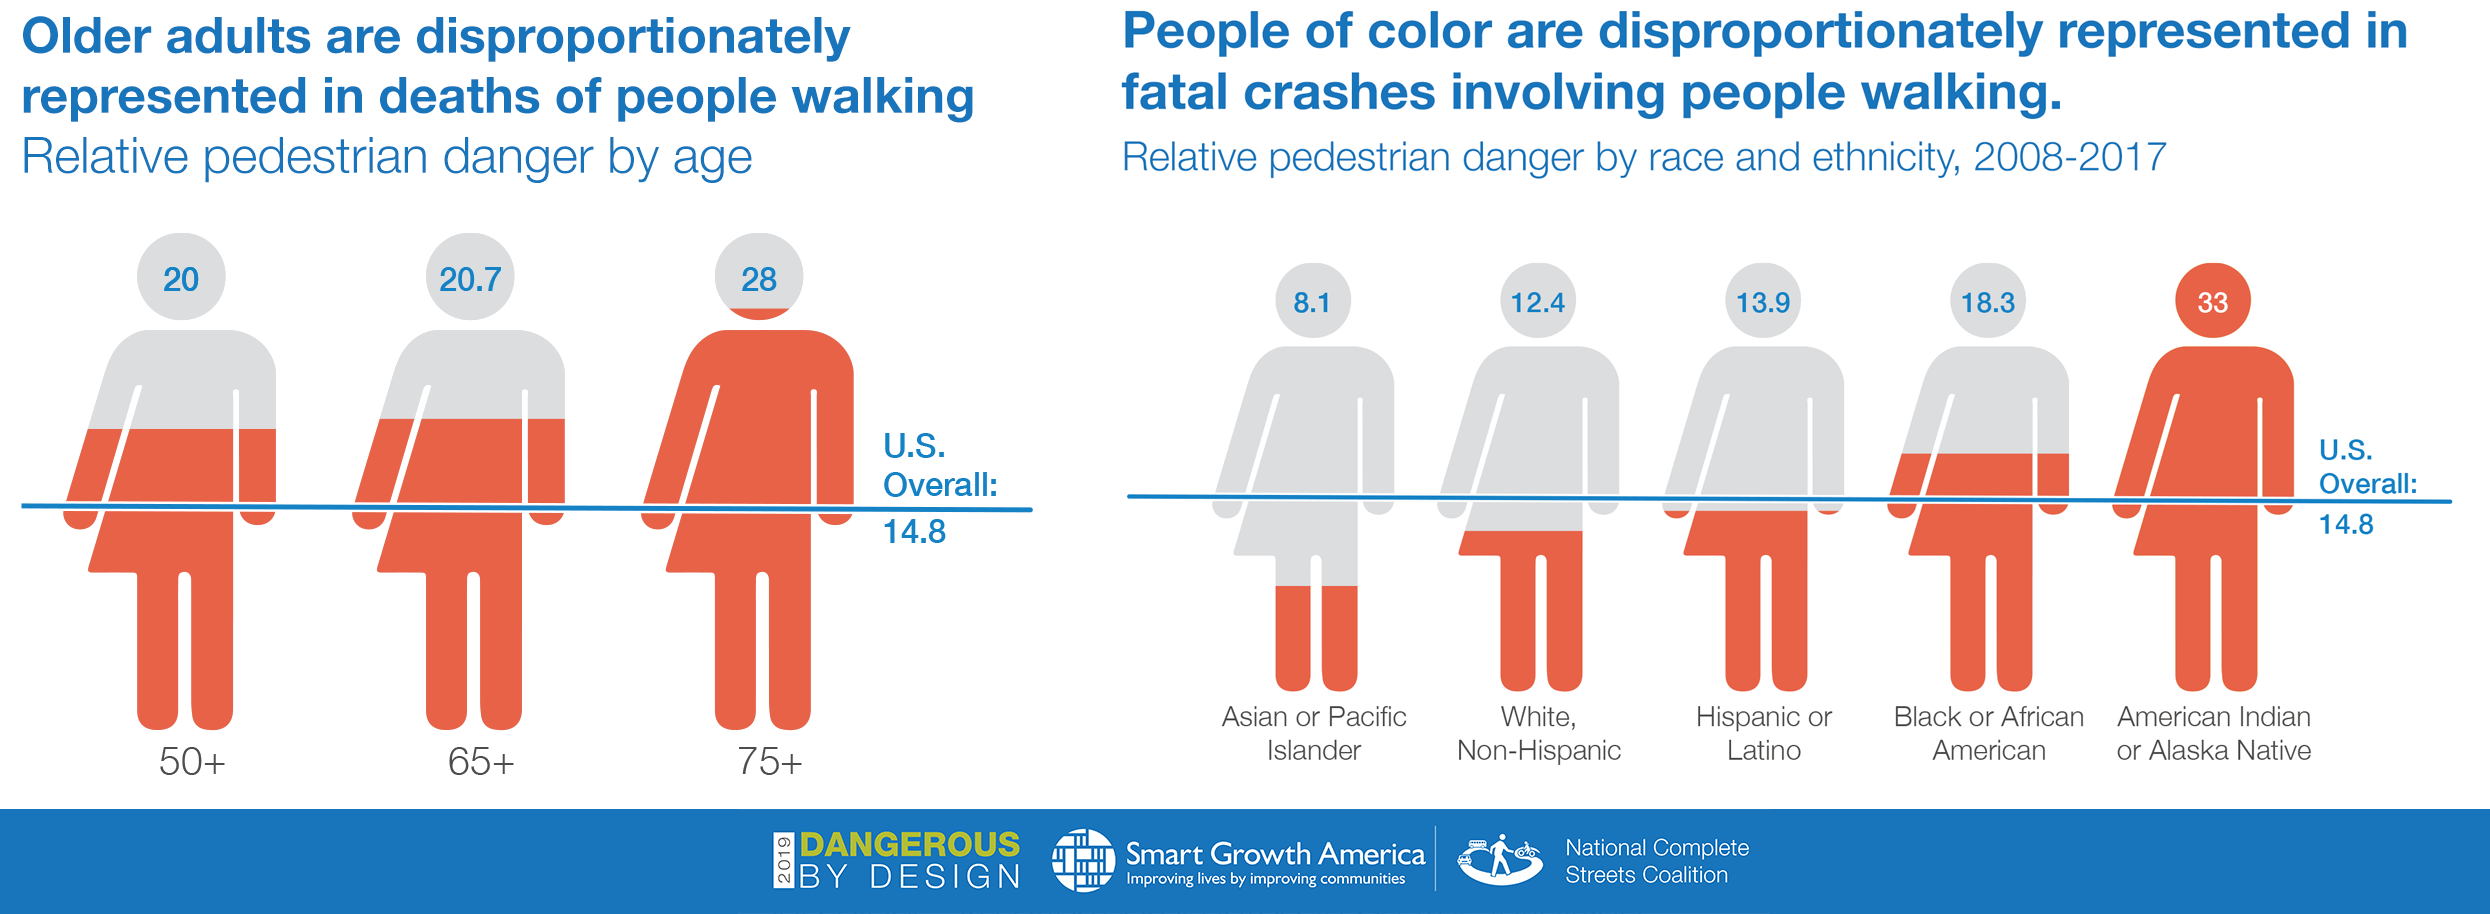
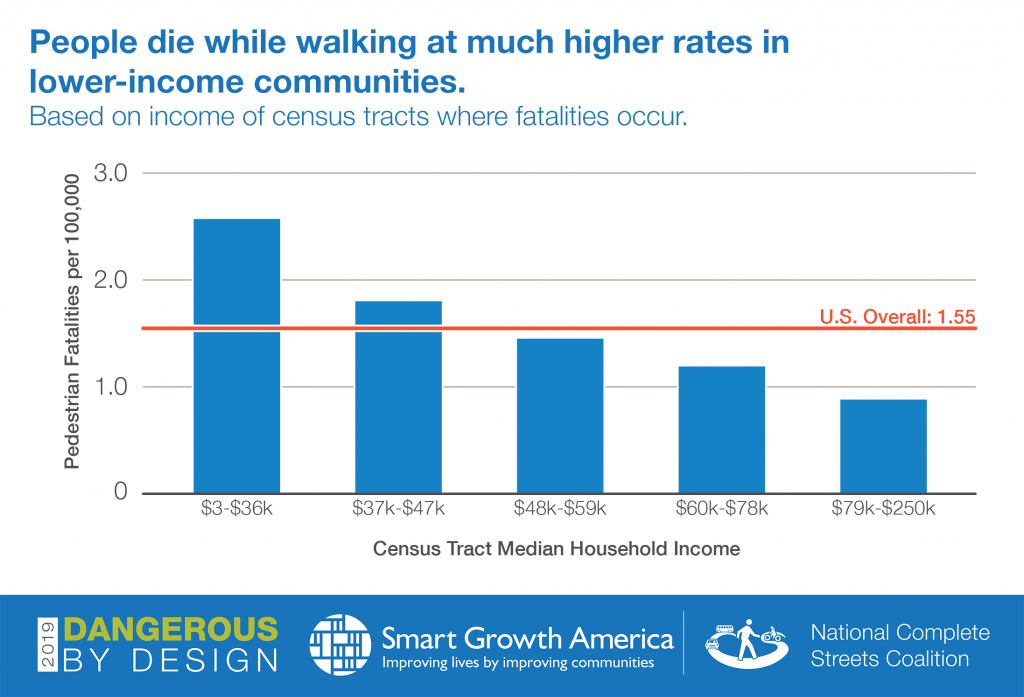
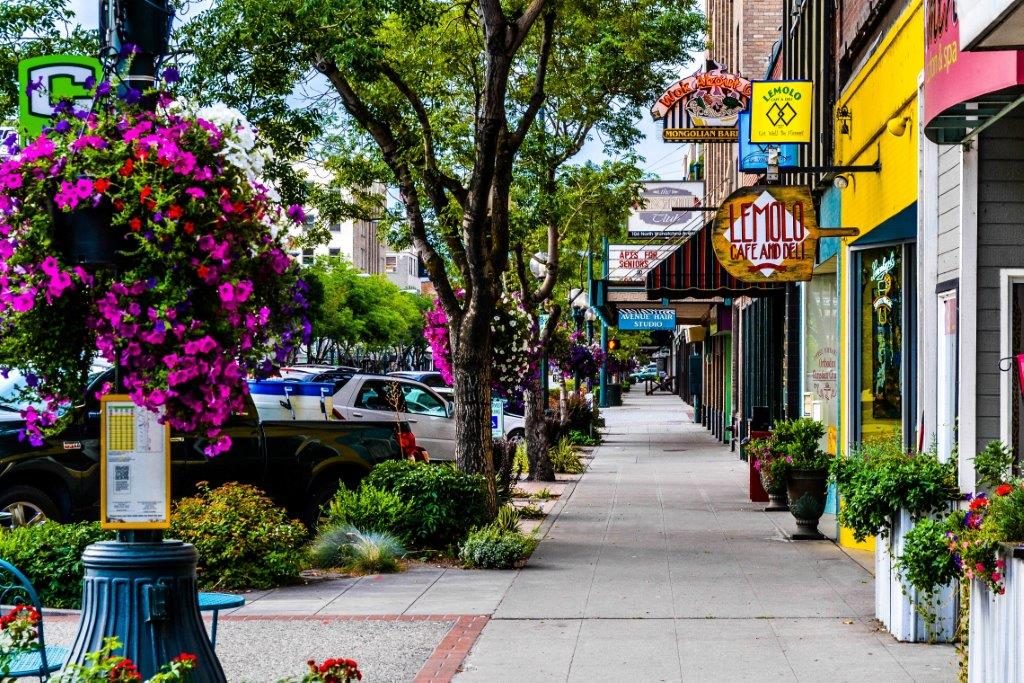
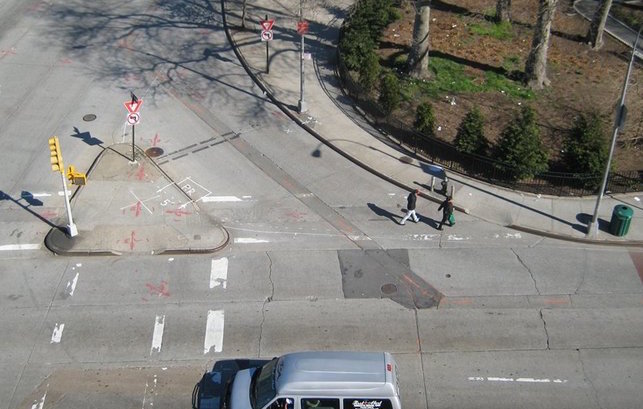
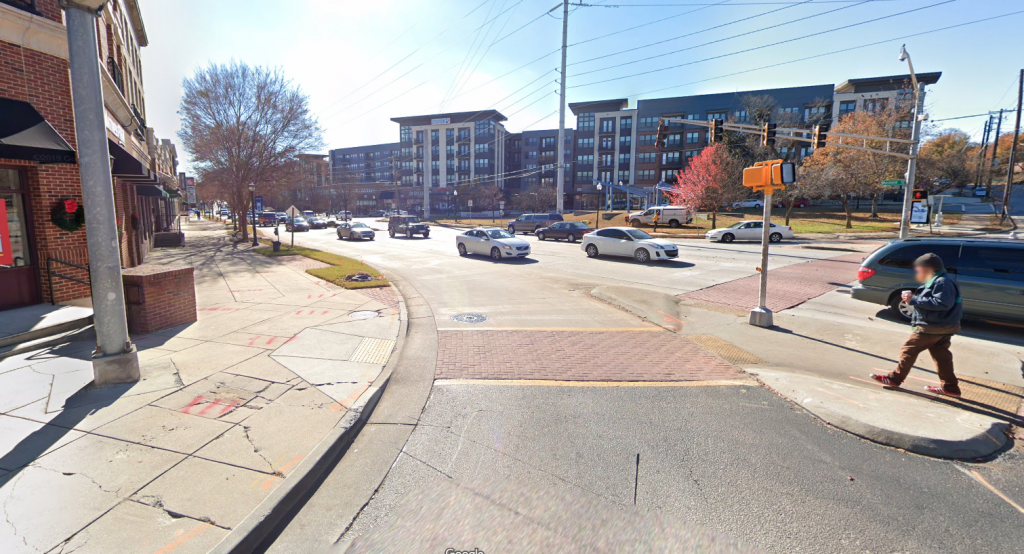
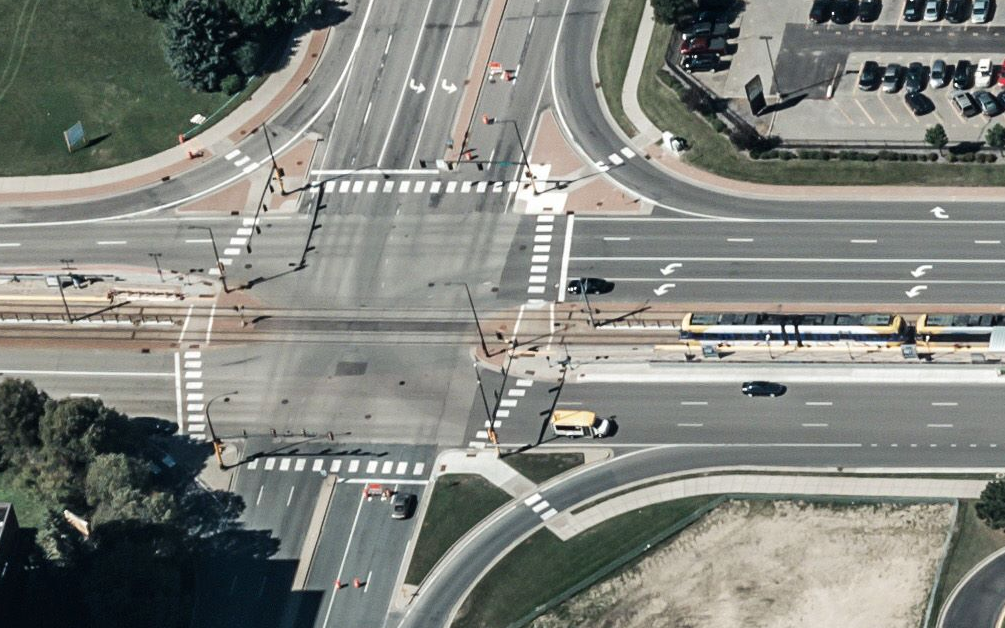
As another example, the small changes that result in faster car travel often make travel for other people more dangerous, which is never considered. Look no further than slip lanes, which exist solely to keep vehicles flowing quickly through intersections, directly through marked pedestrian crossings. These projects have a disproportionate impact on the time and safety of the people walking who have to cross bigger distances and make extra crossings. In most metro areas, low-income people of color are more likely to be pedestrians, while the white and wealthy are more likely to be driving and enjoying the “time savings” this deadly design feature provides.

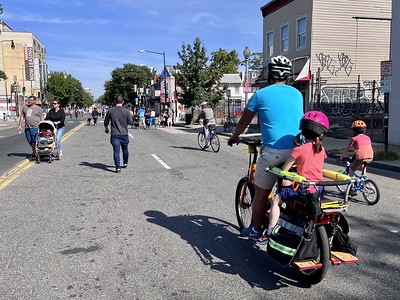
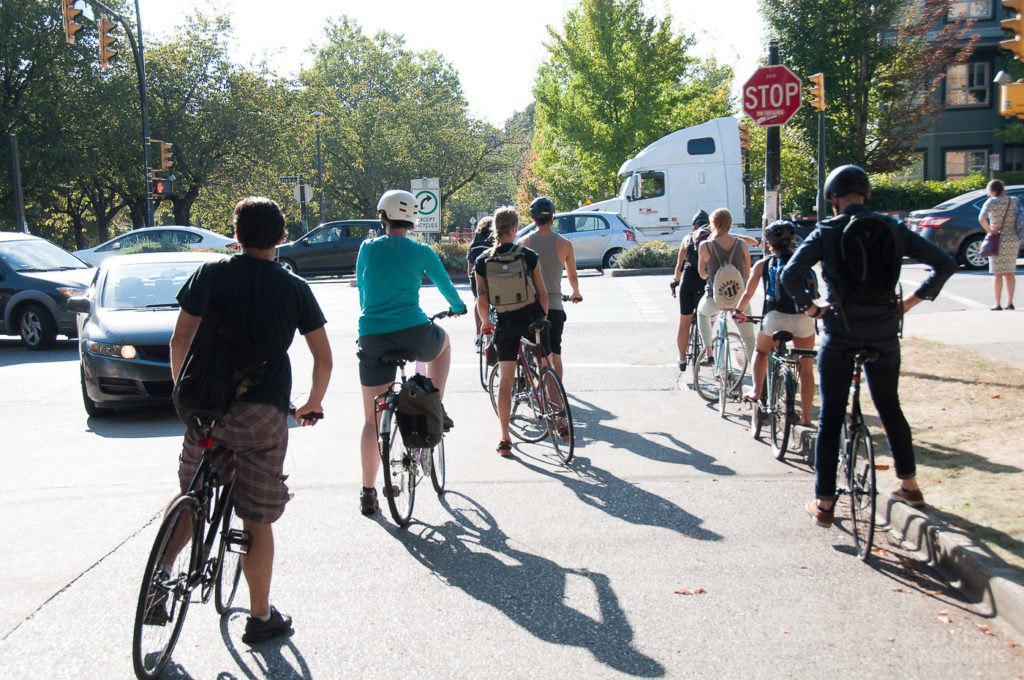
On top of this, in traditional travel modeling processes, pedestrians and cyclists aren’t even considered. Federal guidance assigns a possible value for active transportation, but only if agencies can figure out on their own how they’ll measure it. Transportation agencies end up being able to assign a value to driver time savings, however inaccurate, but not to cyclist and pedestrian time savings. Active transportation is a cheaper, healthier way to travel that’s far better for the environment than vehicle travel, but we stack the deck against realizing those benefits.

The value of time savings of longer distance trips is also worth more, so a ten-minute saving for a business traveler from DC to Miami is given more weight than saving ten minutes on a daily, local commute.

Worse still, value of time is scaled to household income. A wealthy person with more choice on where they live and more ability to pay is valued higher when they save time. Meanwhile, someone who works minimum wage, who has fewer options for places to live, is valued less in time savings.

Recommendations

The Biden administration should repeal the current value of time guidance and replace it, taking into account the advice below. Current federal guidance accomplishes little in actual time savings, and what little time it does save often benefits only a privileged few at the expense of the safety and convenience of all other travelers. All travelers deserve quick, safe, and convenient access to the goods and services they need. This is true no matter how you travel, no matter where you travel, and no matter when you travel.

Stop overestimating the value of time

One issue is that the models overestimate how exactly much travelers truly value time savings. One of the easiest ways to determine this is to look at drivers’ willingness to pay tolls to travel faster. Surveys find little evidence that people are willing to pay for time savings. Among others, there are examples of people in Texas sitting in traffic to avoid tolls, or drivers avoiding a new tolled bridge in Louisville which undermines the very basis of monetizing this benefit. 

Establish a minimum threshold for time savings

If a person saves five minutes on their commute each day, that won’t translate to sufficient time for work or a hobby or some other new, productive use. That’s why economists dismiss any time savings less than 10 minutes as “noise,” but under federal guidance, time savings as low as 10 seconds are considered valuable. Establishing a time savings minimum would ensure that costly projects result in real benefits to taxpayers.

Calculate the true time-saving value of other forms of transportation

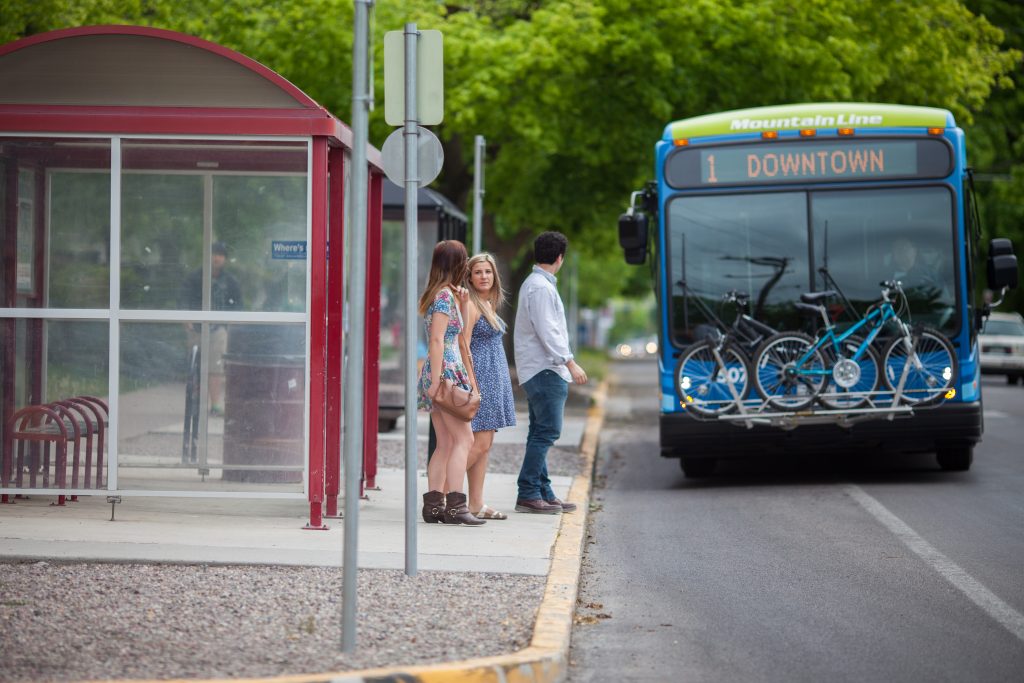
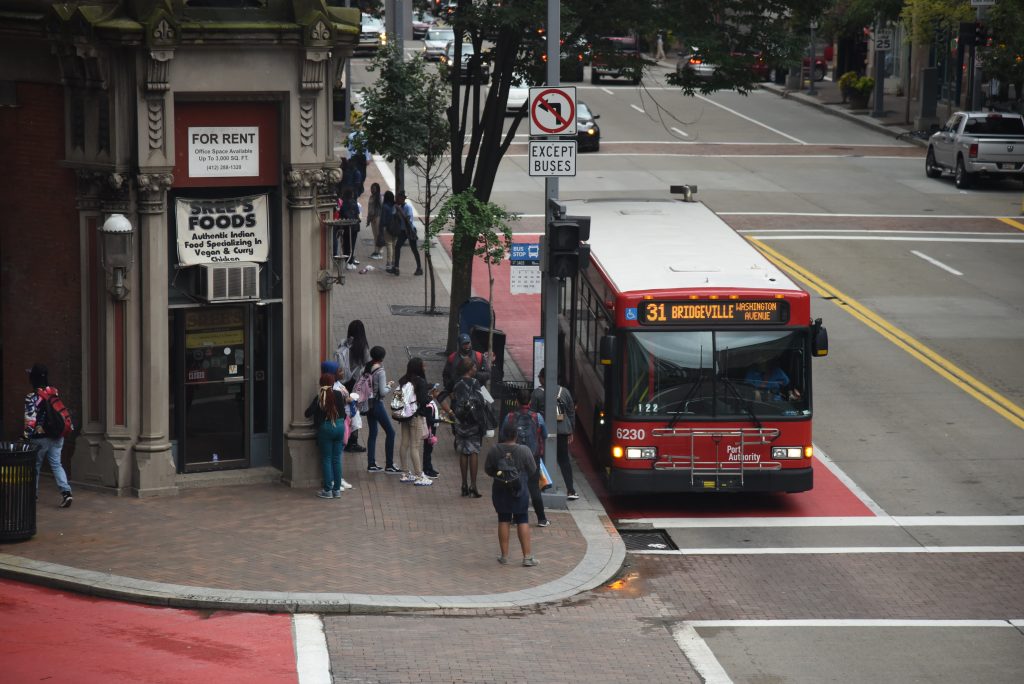
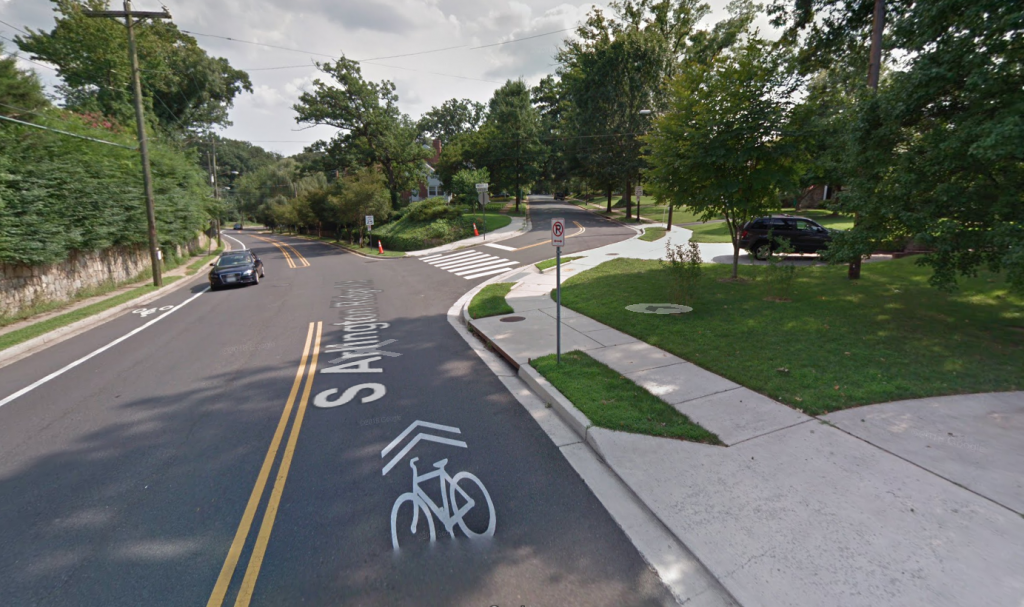
People also value their time differently. Someone who bikes to work might prefer this method of travel over sitting in traffic. If getting some exercise during their commute means they can avoid a trip to the gym, a person might even feel that they’ve saved time—even though these time savings wouldn’t show up in agencies’ calculations. Agencies also ignore the benefits of forms of transportation like public transit that allow people to be productive by working, reading, or relaxing more on their trip than someone driving a car. 

Calculating these benefits wouldn’t be difficult and could result in better transportation for everyone. If guidance included clearer and equally promoted value on health benefits and credited multitask transit riding as higher time savings over single task driving, agencies could better prioritize other modes of travel.

Stop tipping the scales for nine-to-five commuters

As teleworking during the pandemic altered travel schedules, agencies should also take advantage of the opportunity to reevaluate their emphasis on the nine-to-five business trip and give nontraditional work schedules, as well as necessary trips outside of work, more consideration.

Remember: it’s about time, not about speed

There are more ways to reduce time than simply increase vehicle speed. Take freight as an example. To save time, freight logistics experts don’t wait five years for a capital project as agencies do for roadways (and the benefits for these road expansion projects are quickly eroded by induced demand). In that time, freight companies make hundreds if not thousands of changes to their operations and practices that earn them more benefit than merely moving trains faster. They create redundancies in their system, which translates to choice for consumers. Furthermore, they recognize that the real time savings comes from warehousing and positioning needed goods closer to the customer, so that their trips become shorter overall. Yet nearly every model and metric we use ignores the growing length of our trips. 

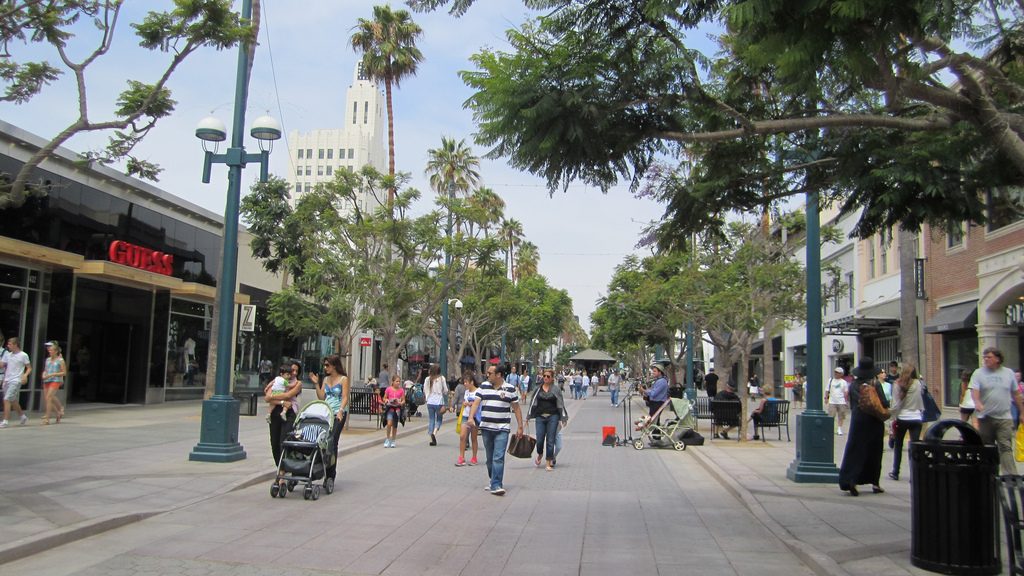
To actually save travelers’ time, agencies need to take local travelers into account and consider how projects impact the length of trips, not just how quickly cars can go.

USDOT road safety strategy finally acknowledges the importance of design on speeds and roadway deaths

press release

On the release of the new Roadway Safety Strategy by the U.S. Department of Transportation, T4America director Beth Osborne issued this statement:

“We’re very happy to see the administration specifically call out the importance of road design on speeds and driver behavior as a core area of focus, and acknowledge that risky behavior can be addressed through better roadway design. We’ve been fighting for years to get the media, the public, and especially transportation agencies to focus on the neglected role of street design in these deaths, and we’re encouraged to see an entire section on safer roadway designs and an entire section on safe speeds, including a call for updated guidance on setting safe speeds and the 85th percentile rule. 

“We’re delighted that USDOT will consider revising the guidance for state safety targets, requiring them to demonstrate measurable progress instead of permitting them to just accept more deaths as an unavoidable fact of our transportation system. It’s not, and we can’t allow states and metro areas spending our tax dollars to keep throwing up their hands when it comes to reducing fatalities.

“Why is it so important that USDOT use their administrative powers to improve safety? Because in the infrastructure bill, Congress declined to make safety a core priority of and requirement for the huge formula programs used to build or repair roads, instead opting for a strategy that creates new, small safety programs that can be overwhelmed by the hundreds of billions spent on moving cars as fast as possible in almost all contexts. Unfortunately, this plan focuses on using the small safety and bike/ped programs to fund improvements in safety. USDOT needs to make safety the fundamental consideration of the hundreds of billions that states get in programs such as the Surface Transportation Block Grant Program and the National Highway Performance Program. If safety for our most vulnerable users is the top priority then it will be a priority of all the programs, not just niche programs.

“There are a couple areas of concern. The safety plan calls for improvements to the design guidelines used by all traffic engineers (the MUTCD) but states that bigger changes will come in the next edition—which could take years to see and may be managed by an administration that doesn’t share the same priorities. That is a very risky move that could put people at risk. Also while proposing to update the program that assesses the safety of new cars to include the safety of people inside and outside a car, they’ve failed to specify the impact of the growing size of the front ends of vehicles on the increasing deaths of people outside of them. Drivers should be able to see the road in front of them for the vehicle to be road worthy. 

“Overall, we think this is a good strategy pointed in all the right directions, but we’re eager to get more specifics about what they plan to do in concrete terms. With a year of this administration already spent, we don’t need new plans and strategies that fail to bring about rapid change. We urge them to get started on implementation as quickly as possible and are eager to help.”

Lemonade from lemons: Improvements worth celebrating within flawed infrastructure bill

Pier 1 embarcadero

Money from the finalized $1.2 trillion infrastructure deal is already flowing out to states and metro areas who are plugging it right into projects both already underway and on the horizon. After covering six things the administration should do immediately to maximize this mammoth infusion of unexpected cash, here’s a longer look at some of the law’s incremental or notable successes, with the aim of equipping the administration and advocates alike to steer this money toward the best possible outcomes.

promo graphic for a guide to the IIJA

This post is part of T4America’s suite of materials explaining the 2021 $1.2 trillion Infrastructure Investment and Jobs Act (IIJA), which governs all federal transportation policy and funding through 2026. What do you need to know about the new infrastructure law? We know that federal transportation policy can be intimidating and confusing. Our hub for the new law will walk you through it, from the basics all the way to more complex details.

Passenger rail

Amtrak train pulling into a station
Image from Wikimedia Commons

If you’re looking for good news in the infrastructure bill, passenger rail probably represents the most encouraging and exciting inclusion in the bill. After being woefully neglected over the past 40 years, passenger rail is one of the biggest winners, receiving a historic investment that totals just north of $100 billion over five years. (All of which is thanks to impressive bipartisan work by the Senate Commerce Committee earlier this summer—read our much more detailed take on all the passenger rail provisions here.

This will provide significant opportunities to reshape American passenger rail in a transformative way. With the record investment, there is ample opportunity to improve safety and state of repair for existing rail infrastructure, make existing service more reliable, and support new, expanded passenger rail service. Communities near rail and lacking in intercity mobility options could connect their community with affordable intercity mobility and integrate passenger rail service with first- and last-mile community connections. 

But these improvements are not going to happen automatically nor will they happen easily. The Biden administration, the Federal Railroad Administration, Amtrak and others will have to be very aggressive in ushering this money out the door and supporting state and local plans for those improvements to see the projects that have been promised or mentioned in breathless news coverage come to pass. If the administration fails on this count, this could turn out just like the 2009 Recovery Act, where money sat idle or was even declined by governors. On top of that, freight railroads will be opposed to the improvements in some places, just like they’ve fought or negotiated in bad faith against the publicly and politically popular plan to restore passenger rail along the Gulf Coast.

Additionally, Amtrak’s mission and governing structure have been adjusted to bring a greater focus on expanding and improving the national network. For the majority of Amtrak’s existence, the mission of passenger rail service was to justify investments with performance and operate to make a profit, no matter the cost to user experience, and no matter that nearly every other transportation mode fails to turn a profit. This hampered innovation and opportunity to build and retain rail ridership. Small but significant changes in the infrastructure bill reorient Amtrak’s mission towards the value of the customer and the importance of connecting those customers across urban and rural communities. 

While the bill lays out goals for an Amtrak Board of Directors that better represents a diversity of perspectives and communities across the Amtrak system, as we noted last week, those slots need to be filled immediately if the administration is serious about improving passenger rail service and taking advantage of the funding and this historic opportunity.

By reinvigorating passenger rail infrastructure and user experience, this bill could lay the groundwork for other future advancements, including high-speed rail.

Connecting people to jobs and destinations

Alaskan Way Viaduct demolition in progress in Washington
Image from WSDOT via Flickr

As we’ve noted, the bill pours the lion’s share of the funds into the same old highway programs with few substantial changes. And states are already responding to their hard-won flexibility and historic amounts of cash by supercharging previously planned or ill-conceived projects. But there are some notable ways the bill recalibrates the highway program for the long run. 

First, a portion of every state’s funding will go to new programs aimed at reducing carbon emissions, improving transportation system resiliency, and congestion relief, in addition to existing money devoted to Congestion Mitigation and Air Quality (CMAQ) dollars. States and metro areas must also now dedicate a portion of their planning money towards Complete Streets planning and implementation. (2.5 percent of each state’s State Planning Research dollars and 2.5 percent of their metropolitan planning dollars.) This money will be dwarfed by the hundreds of billions going into streets and roads being designed the same old way, but this is an incremental step toward elevating active transportation and livable streets within the transportation program. 

Within the largest pot of funding that states and metro areas control (the Surface Transportation Block Grant program), the amount set aside for smaller but vital transportation projects like bikeways, new sidewalks, safe routes to school, and micromobility was increased from 1.5 percent up to 10 percent. This bill also lets local municipalities control more of this funding directly by increasing the share of that 10 percent that they directly control from 50 up to 59 percent

Lastly, while the $1 billion Reconnecting Communities program will be overpowered by hundreds of billions in highway funds perpetuating the very problem this program aims to solve, its inclusion is an important step toward repairing the damage of past highway projects and is worth celebrating. For the first time, Congress is acknowledging the racist and damaging history of highway building, laying the groundwork for future efforts and also providing a way for advocates to spotlight how some of the worst excesses of the past are still going on today in many urban areas. But devoting any federal dollars to tearing down divisive infrastructure plus the means to stitch communities together again is a vital step on the path toward reorienting the highway program to serving people and communities with the transportation system. 

Transit

A Philadelphia bus drives through a snowy intersection
Image from BruceEmmerling via Pixabay

Most of the headlines and coverage about transit focused on the fact that it will receive historic levels of investment over the next five years from the infrastructure deal. That’s certainly good news, but that also glosses over some important shortcomings. 

First off, unlike the Senate Commerce Committee did with passenger rail, the Senate Banking Committee never actually drafted a transit title to incorporate into the infrastructure bill. This preserved the transit policy status quo in amber for the next five years. Secondly, while the House’s superior INVEST Act proposal focused on trying to maximize transit service, frequency, and access, this bill failed to fix the current priority of keeping costs down no matter the effects on people when it comes to service, ridership, and access to transit. T4America is still looking to Congress to redress that wrong within the still-in-progress budget reconciliation bill (the Build Back Better Act), ensuring that public transportation, a fundamental backbone in our communities and a lifeline towards affordable housing opportunities, is properly funded.

Thirdly, while the $39 billion is a historic amount for transit and many excellent projects will be built because of it, this amount should have been higher. $10 billion was cut from the original infrastructure deal’s framework agreement with the White House back in June. 

While we weren’t anticipating the Senate increasing the share for transit, the infrastructure bill did maintain the historic practice of devoting at least 20 percent towards public transportation and did not decrease it. On a positive note, the bill emphasized improving the nation’s transit state of good repair, plus improving transit accessibility via a grant program to retrofit transit stations for mobility and accessibility.

Environmental stewardship and climate adaptation

A parking space painted green with a symbol indicating the space is dedicated for EVs
Image from Noya Fields via Flickr

Although the infrastructure bill continues to heavily fund conventional highway and road expansions, digging us into an ever deeper hole of traffic congestion and greenhouse gas emissions, it is also the federal government’s biggest investment yet in climate adaptation and protection and recognizes the severity of the impacts of climate change which are already being experienced across America.

The new PROTECT program dedicates $7.3 billion (~2.9 percent of each state’s share of all highway funds) and $1.4 billion in competitive grants to shore up and improve the resilience of the transportation network, including highways, public transportation, rail, ports, and natural barrier infrastructure. Knowing where climate- and weather-related events are likely to be worse is a vital first step, and the National Oceanographic and Atmospheric Administration (NOAA) will invest $492 million in flood mapping and water modeling which could inform future infrastructure planning and investment.

The existing Alternative Fuels program is expanded and recalibrated to focus more, though not exclusively, on zero-emission vehicles and related infrastructure. A new Carbon Reduction program will dedicate ~2.5 percent of each state’s share of highway funds (~$6.4 billion total) to support active transportation, public transit, congestion pricing, and other strategies to reduce carbon emissions. (Although the core highway program will continue making emissions worse.)

All of this represents a positive first step in federal recognition of the severity of the impacts of climate change, but it is still not scaled to the level of risk that we face, though we applaud Congress for taking a bipartisan step on climate change and we hope to see more.

Safety

Cyclists on the Black Lives Matter Plaza in DC
Photo by Ted Eyton via Creative Commons

When it comes to safety, a new federal safety program, even a large one, is not what we need. The entire $300+ billion transportation program should be a safety program, with safety for all users as the highest and ultimate consideration in every single case on every single project. A transportation system that cannot safely move people from A to B should be viewed as a failure, regardless of whatever other benefits it brings.

With that backdrop in mind, there are key safety provisions that ensure a fairer shake for vulnerable road users. If injuries to and deaths of people walking, biking or using assistive devices exceed 15 percent of a state’s total traffic injuries and fatalities, then that state must dedicate at least 15 percent of their Highway Safety Improvement Program dollars towards proven strategies to make those people safer and lower that share. This helps put some teeth into highway safety dollars to target investments where they are critically needed, versus typical lip-service and disingenuous investments sold as safety projects that are really about increasing capacity, speed, or other goals.

The new Safe Streets and Roads for All program is a competitive grant program allowing applicants to seek funding to better plan and implement Vision Zero strategies in their communities and regions. Once deemed a niche concept, the Vision Zero safety framework has gained some prominence. For it to go mainstream, it will need to be fundamental to all highway spending.

Looking ahead

Though this bill leaves much to be desired, there are still some notable changes that will start to shape the direction of state, regional, and local transportation programs. The key will be how they are used. In the coming weeks, T4America will highlight key opportunities to better administer, deliver, and shape the US transportation program for generations to come. 

Behind the scenes on the rise in pedestrian and cyclist fatalities and injuries

A bike on its side after a crash

Driver expectations, higher speeds resulting from less congestion, major gaps in infrastructure, and a systemic criminalization of pedestrian and cyclist traffic on the road have contributed to the alarming, record increases in the deaths of people struck and killed while walking or biking, according to researchers.

Crash at Lincoln Park and Barbee in Lincoln Heights. Photo by Umberto Brayj via Flickr.

Whether for recreation or simply to get from point A to point B, Americans have been walking and biking more, and thanks to COVID-19, this pattern has only intensified.

As more people walk and bike, we’ve also seen a historic increase in the numbers of people struck and injured or killed by vehicles while walking or biking. Researchers have been delving into this worrisome trend and the factors that may be contributing to this pattern, and at the same time, municipalities are rethinking their roadway safety or Vision Zero strategies.

Photo on left: An open street in Georgia. Photo by Joe Flood via Flickr.

Research out of the University of Toronto highlighted a worrisome trend of drivers failing to acknowledge cyclists or pedestrians, especially at turns and intersections. “The results were quite surprising,” said Professor Birsen Donmez. “We didn’t expect this level of attention failure, especially since we selected a group that are considered to be a low crash-risk age group…. Drivers need to be more cautious, making over-the-shoulder checks, and doing it more often…. The takeaway for pedestrians and cyclists: drivers aren’t seeing you.”

They go on to postulate that there is an increased intensity and diversity of demands for drivers’ attention, including signage, diverse modes of transport and their evolving technology, and the presence of more cyclists and pedestrians. (Others have noted that the increase in deaths was coupled with increases in speed overall during the first half of the pandemic as streets emptied out, showing the connection between speed and greater numbers of deaths.) This demand for attention is at odds with the complacency of drivers, many of whom are not accustomed to having to worry about pedestrians and cyclists, and now they’re struggling to adjust. Making matters worse, the pedestrian and cyclist infrastructure that could clue drivers into the need to make room on the road is inconsistent, making it harder (not easier) for drivers to recognize when they’re sharing the road.

The need for consistent pedestrian and cyclist infrastructure is a twofold problem. One, roadway design and transportation policy makes safety and convenience for cyclists and pedestrians secondary to the auto, and at times, normal cyclist and pedestrian behavior is deemed outright illegal, according to Peter Norton’s book Fighting Traffic: “In the early days of the automobile, it was drivers’ job to avoid you, not your job to avoid them…. But under the new model, streets became a place for cars — and as a pedestrian, it’s your fault if you get hit.”

This encourages false assumptions about what belongs and what doesn’t belong on our roadways; as if streets aren’t meant to be shared with other users. If drivers assume pedestrians and cyclists shouldn’t be in the road, they’re less likely to be on their guard.

Image on left: An anti-jaywalking poster created in 1937. From Wikimedia Commons.

Secondarily, according to research by J. M. Barajas‘, the existing engineering, education and enforcement approaches to Vision Zero do not address the root of the issue with pedestrian and cyclist traffic fatalities that are overrepresented by people of color. This disproportionate impact is the result of a failure to invest in safe bike and pedestrian accommodations in marginalized communities. 

Simply adding bike lanes and sidewalks won’t be enough. Safety from crime is another issue of concern for people of color, who often opt to travel on higher visibility corridors, which is where bike lanes and sidewalks are rarely considered because of the impact on the traffic engineers’ sacred cow of vehicle speed. Instead, this necessary infrastructure is more commonly placed on low-volume roadways, which have less public visibility. And for those who do bike, they are subject to police harassment, as cops are more likely to stop Black cyclists than white cyclists.

Since the spike in traffic deaths during the pandemic, pedestrian and cyclist fatalities are getting more visibility. The way we respond to this issue matters. Will we continue to push for only more ineffectual traffic enforcement, which disproportionately harms people of color? Will states and localities continue to push education campaigns that do nothing to address the root causes of driver inattention? Will we finally address unsafe designs as a primary culprit? Under the infrastructure bill, we could easily turn up the dial on these failing approaches and claim progress, even as fatalities continue to worsen.

What pedestrians and cyclists really need isn’t more tickets for jaywalking or lectures about wearing reflective gear. They need infrastructure that consistently makes room for them, prioritizes their safety and comfort above vehicle speed, and that provides greater visibility for all road users when they do mix with traffic, so that when drivers need to share the road, it doesn’t come as a surprise.

Month of Action Week 2: Tackling our deadly streets

With Congress writing long-term transportation policy this month, we need to make sure that this bill doesn’t continue the broken status quo. This week, we need you to take action to support the Complete Streets Act.

With the Senate writing long-term transportation policy right now, our Month of Action is going full-steam ahead. Thank you if you took last week’s action to send our template reauthorization letter to your member of Congress. 

For Week 2, we need you to take action to support the Complete Streets Act. 

The number of people struck and killed by drivers while walking increased by 47 percent over the last decade, as our partners at Smart Growth America found in the latest edition of Dangerous by Design, to be released tomorrow. We are in the midst of an astonishing safety crisis as the United States has become—over decades of broken policy—an incredibly deadly place to walk.

But a handful of leaders in the U.S. House and Senate have introduced a bill that would finally require states and metro areas to design and build safer streets for everyone. The Complete Streets Act of 2021 is desperately needed but it will take your support—and the support of your members of Congress—to get this bill passed into law.

Keep an eye out tomorrow for Dangerous by Design 2021, Smart Growth America’s report showing how dangerous each state and the largest metro areas are for people walking.

Unsafe streets in marginalized communities lead to inequitable traffic enforcement

Equitable enforcement of traffic rules is a major national discussion. But under-discussed is the role dangerously-designed streets play in putting Black and brown people in a perilous position: break traffic law and risk interacting with police, or put themselves in harm’s way when navigating unsafe infrastructure. Here’s our recap on a recent House hearing on equitable enforcement of traffic rules.

A “slip lane” in Atlanta, GA, making street crossings much more dangerous.

Last week, the House Transportation and Infrastructure Committee’s Subcommittee on Highways and Transit held a hearing on equity in traffic safety enforcement.  The hearing mostly covered data on racial profiling in traffic stops and how to equip our law enforcement officers with tools to identify their implicit bias and learn how to manage it when conducting traffic stops.

While these topics are extremely important, the Transportation and Infrastructure Committee doesn’t have jurisdiction over improving the relationship law enforcement has with communities of color. However, it does have jurisdiction over solutions to unsafe street design in these communities that lead to more traffic-related stops between law enforcement and people of color.

For example, take the story of Rodney Reese: a Black high schooler in Texas who was arrested and charged for “being a pedestrian in the roadway” as he walked home from work. Rodney had no choice but to walk in the street because the sidewalk was too icy to safely walk on. He spent a night in jail. 

Racism and bias may have led these officers to arrest and charge a high schooler for walking home from work. But, the question that the subcommittee has jurisdiction over is why was this high schooler walking in the roadway in the first place and what can this committee do about it?

According to Smart Growth America’s report Dangerous by Design, Black Americans were 72 percent more likely to be struck and killed while walking compared to people who don’t identify as Black in the past decade. Black people are also much more likely to be stopped, ticketed, and arrested for jaywalking

Stories like Rodney’s are quite common in marginalized communities where underinvestment has led to unsafe, high-speed street design that make walking and biking all but impossible. Vulnerable communities are often put in an impossible predicament to break the law and put themselves at legal risk to get to work, school or a doctor’s appointment or choose another option that may not be as convenient, cost more money or time.

Safe street design benefits everyone, especially marginalized communities by making it easier to bike, walk, and access transit stops. This can reduce the number of traffic infractions and therefore the number of interactions communities have with law enforcement for traffic related stops. Transportation for America implores the committee to continue to have these conversations and focus on building marginalized communities back better by investing in them. Not only does investing in safe street design prevent communities from having unwanted interactions with law enforcement, it’s also better for economic development. Streets designed to accommodate (slow) drivers, people walking and biking, and transit riders creates thriving communities by attracting businesses and connecting communities to jobs.

Here are a few things the committee can do to improve equity for communities of color and begin to reverse underinvestment in safe streets infrastructure or Black and brown communities:

  • Require USDOT to collect locations of all collisions resulting in death or serious injury, highlighting those involving cyclists and pedestrians, and produce a detailed map of an annual High Injury Network and update the Fatality Analysis Reporting Systems (FARS) accordingly. Better data, and detailed maps of dangerous corridors can help communities target investments to improve safety, and in those communities most impacted by unsafe designs.
  • Identify changes to the process for compiling FARS data so that the release of annual data can occur in the half of each calendar year. FARS data is not available on a regular, predictable, schedule. This undermines its utility for the public and local DOTs. 
  • Require the Federal Highway Administration (FHWA) and the National Highway Traffic Safety Administration (NHTSA) to issue guidance to states and metropolitan planning organizations (MPOs), instructing them not to set safety targets that would be higher than the existing level of pedestrian and cyclist fatalities, as many states have routinely done under the current performance management system.
  • Require USDOT issue guidance for determining how investments impact racial and economic equity and to use this guidance as a criterion for discretionary grant programs;
  • Approve the Complete Streets Act of 2021, which creates state complete streets programs and provides funding and technical assistance to develop and construct projects, with a focus on equity and connections to jobs and services;

The INVEST Act, which passed the House in the 116th Congress, made great strides in moving the needle on these issues by incorporating a focus on safety throughout all federal programs and overhauling a broken system that allows states to increase pedestrian death without penalty. It also dedicates more funding to protect vulnerable communities and sets speed limits to prioritize safety over speed.

We want to see Congress build on the INVEST Act and are calling on the House and Senate to fundamentally reform our surface transportation. Continuing on a path of status quo will only exacerbate the inequities our most vulnerable communities face every day.

State safety targets show need for Congress to further prioritize safety

People on bikes waiting at a stop sign to cross a congested intersection

The following blog post is co-authored and published in partnership with the League of American Bicyclists, a national non-profit advocating to make cycling accessible and safe for all Americans, and the National Complete Streets Coalition, a non-profit, non-partisan alliance of public interest organizations and transportation professionals committed to the development and implementation of Complete Streets policies and practices and a program of Smart Growth America.

For decades, state departments of transportation have treated pedestrian and cyclists fatalities like weather events: something that increases simply as people drive more, putting these deaths outside of the control of DOTs. But with COVID-19 proving this to be false, it’s past time for state DOTs to implement performance measures to reduce the number of people killed while walking or biking. Here’s our comparison of state safety targets.

People on bikes waiting at a stop sign to cross a congested intersection

(Update: 2/2021This post originally stated that the number of states setting targets to improve fatality/injury numbers was increasing each year, which is not the case. 18 states set negative targets in 2018, and 20 states did so in 2020. That language has been changed. – Ed.)

Transportation policy can take a long time. In 2012, Congress passed the Moving Ahead for Progress in the 21st Century Act (MAP-21) which required the US Department of Transportation (US DOT) to establish a safety performance measure to assess federal investments in transportation. In 2016, the Obama administration promulgated a final rule. And now, in 2020 the US DOT has assessed state safety performance measures.

Most transportation advocates believe that performance measures are critically important to the future of federal transportation policy. Performance measures require data collection by states, regular reporting assessed by US DOT, and result in financial impacts for states that do not meet performance targets. While this concept is pretty simple, it is a profound shift in transportation policy towards accountability. It is also more important than ever in 2020, as the rate of roadway fatalities jumped 20 percent, even though driving was down 17 percent due to Coronavirus-related travel restrictions

Non-motorized safety performance measures were opposed by 23 state DOTs and the American Association of State Highway Transportation Officials. They exist thanks to the work of many advocates, including nearly 10,000 individuals who contacted the Federal Highway Administration (FHWA) during the rulemaking process. 

The good news: In every year that states have set safety targets, most states (at least 30) have set targets that would reduce non-motorized fatalities and serious injuries. If state DOTs are serious about reaching zero traffic deaths, this must continue and they must do more to make these targets come true.

The bad news: Many states are setting safety targets that anticipate more people dying or being seriously injured while biking and walking. In 2020, 20 states set safety targets of more deaths and serious injuries—more than the 18 that did so back in 2018. For those 2018 targets, six of those 18 states exceeded even their grim targets of increased fatalities and serious injuries. At least 10 states have targets that are clearly trending up, sometimes dramatically, including in states with very poor safety records for people biking and walking. This implies that those states do not have a serious theory for reducing non-motorized fatalities and serious injuries or are not serious about reaching zero traffic deaths. And these bad targets are in the context of the US making much less progress on traffic deaths than peer countries.

Pennsylvania’s safety targets versus average fatalities and serious injuries

For example, Pennsylvania has never set a non-motorized safety target that was lower than the 5-year baseline average for fatalities and serious injuries. The FHWA assessment was that Pennsylvania has not met its target or made significant progress. The state’s targets have trended up significantly, implying that the state has no serious plans to reverse its poor performance. 

A little more than a third of the states that FHWA found met their safety performance target across all modes had higher levels of non-motorized fatalities and serious injuries than their 5-year baseline average. This means that despite data showing that people who bike and walk are less safe, these states will not be incentivized to spend Highway Safety Improvement Program funds on safety improvements for people who bike and walk.

Safety performance target assessments

The FHWA cautions against drawing conclusions based upon its safety performance target assessments. Each state sets its target in a unique way and missing a target may mean different things in different states. Sometimes these differences are notable, like Florida setting a target of zero, although the state has no chance of meeting that target (the state of Florida also notes by their own target that they expected the rate of driving to have a greater impact on safety than anything else).

We believe that there are still lessons to be learned from comparing state targets assessments and here are a few.

1. The non-motorized safety performance target as the worst performing safety target.

More states failed to meet their target and more states failed to improve relative to their baseline than any other type of target. 

2. Only four states—Delaware, Hawaii, Rhode Island, and Vermont—set a goal to decrease non-motorized fatalities and serious injuries and achieved it.

This low rate of meeting reduction targets is unlikely to be due to overly ambitious targets (like Florida’s target of zero) because more than 75 percent of the states that missed their target to reduce non-motorized fatalities and serious injuries performed worse than their 5-year baseline average.

3. Only 32 percent of states performed better than their five-year baseline average.

This is understandable given that pedestrian and bicyclist deaths hit 30-year highs in the period assessed, but highlights the widespread nature of pedestrian and bicyclist safety problems.

4. Four of the five states with the most bicyclist and pedestrian fatalities—California, Florida, New York, Texas, and Georgia—performed worse than their five-year baseline average.

New York was the only state to improve upon its average. Florida and Georgia were the only states in this group that set targets to improve.

States that fail to meet their own targets (some of which are targets to have less safe roadways) suffer very minor consequences—all states have to do is spend safety funds on safety projects and submit an implementation plan. But for the first time, thanks to Congress requiring performance measures, we can see how they are performing and hold them to account.  

For decades, many departments of transportation (like Florida stated in their safety report) and transportation experts have claimed that increases in driving dictate increases in traffic fatalities and serious injuries. This claim allows transportation agencies to treat traffic fatalities somewhat like weather events — outside of their control. However during the COVID-19 pandemic, we have seen that this claim cannot be true. The National Safety Council found in the first six months of 2020, the rate of roadway fatalities jumped 20 percent, even though driving was down 17 percent. Transportation agencies must recognize their responsibility to make safe systems rather than claiming they are powerless to make roads safer. 

The United States has reached a point where the transportation sector is the go-to example of a sector where deaths are tolerated. Congress, and decision makers at all levels of government, need to take decisive action to reorient the transportation sector to prioritize safety. The House INVEST Act took important steps to prioritize safety and Congress should build upon those steps in the future.

Angry that speed is prioritized over safety? Here’s what to do about it

Last week was #SafetyOverSpeed week here at Transportation for America, where we took a deep dive on our second principle for transportation policy: design for safety over speed. We spent the week discussing how prioritizing speed makes it almost impossible for most Americans to reach destinations anyway other than driving. Now we need to do something about it. Heidi Simon, the Deputy Director of America Walks, discusses how you can make a difference in your community. 

LA’s ever-increasing walkability.

America Walks was disappointed—but not surprised—to learn that 6,283 friends, family members, and neighbors lost their lives while walking in 2018. As a national non-profit working to create safe, accessible, and enjoyable places to walk and move, we know all too well the immense challenge that this nation faces in addressing the devastating trend of growing fatalities among people walking and biking.

Our lack of surprise? Well, that’s because—despite a plethora of street design tactics proven to increase safety—we’re operating in a transportation system that prioritizes cars over people, and has for decades.

We know that many of the issues that plague people walking (and biking) are not new. Poor street design, improper speeds, and a culture that prioritizes cars over people have created a landscape that continues to unnecessarily endanger the most vulnerable users of the public rights of way.

Yet too often the conversation on making roads safer focuses on things that have little to no actual influence on improving safety. The distraction of the distracted walking narrative, the false notion that wearing reflective clothing will save lives, and the idea that these deaths are inevitable are all narratives that do a disservice to improving safety.

Perhaps the biggest issue is that the urgency to reduce the number of people killed while walking and biking occurs only periodically throughout the year, like when NHTSA released 2018 fatality numbers. By then, it’s too late to help those who have unnecessarily lost their lives while doing the most basic of human activities.

But it’s not too late to do something for those who are walking and biking on our streets right now. We can use data to target high crash corridors and improve spaces for our most vulnerable road users. We can make it clear that the only acceptable number of deaths on our streets is zero. And we can start today to do the work needed to make walking and biking safe for all users:

Use your voice: Tell decision-makers at all levels that funding for active transportation needs to be increased and that we need to take steps to improve safety through reduced speeds, improved road design, and policies that actually address safety concerns. This can be done at town halls, by visiting their offices, or inviting them to take a walk with you, your walking club, a walking school bus, or a main street business council. (One way you can help right now is by supporting a long-awaited federal Complete Streets bill.)

Use your head: Dive into the data related to pedestrian fatalities and use it to inform your advocacy. Learn more about the issue, stay vigilant to distractions like victim-blaming, and don’t let the issue disappear from the public debate.

Use your feet: Get out and do a walking audit with friends, neighbors, and your local elected officials to show them what’s being done well and not so well on the streets in your community. Never done one before? Check out our guide here with helpful quick tips like:

  • Inviting people from a variety of background, professions, ages, and abilities.
  • Don’t be afraid to knock on doors to get the word out about the event.
  • Build relationships with decision-makers and local elected officials early so they’re more likely to be engaged during and after the audit.

Missed Transportation for America’s Safety over Speed blog posts? Check them out.

Our seven favorite tweets from the #SafetyOverSpeed tweet chat

Last week we hosted a tweet chat to discuss the importance of prioritizing #SafetyOverSpeed, in tandem with our week of blogs discussing our second principle for transportation policy. Here are our seven favorite tweets from the chat. 

Thanks to our tremendous co-hosts for making the Tweet Chat a success: Smart Growth America, the National Complete Streets Coalition, U.S. PIRG, America Walks, the League of American Bicyclists, the National Association of City Transportation Officials, and Strong Towns.

Missed Transportation for America’s Safety over Speed blog posts? Check them out.

Now to our favorite questions!

Why are there more deaths on arterials—”stroads” in the words of Strong Towns—than on highways with speed limits as high as 70 mph?

Why are most local and arterial roads—particularly in sprawling suburbs and cities—still being designed for high speeds? 

Lowering speed limits alone does little to reduce speeds. How can we better slow vehicles on local and arterial roads? 

According to Dangerous By Design, older adults, people of color, and people walking in low-income communities are disproportionately represented in fatal pedestrian crashes. Why, and how can we fix this?

What are some economic benefits of slowing down streets? 

Transportation is the largest source of U.S. carbon emissions. How can lowering speeds help reduce those emissions?

Speed is often considered a local and state issue. Why should the feds get involved, and how can they support communities that make their streets safer?

Safety over speed: Safe streets are climate-friendly streets

Lowering speeds have more benefits besides saving lives: street designs that keep speeds low help reduce carbon emissions, too. In this blog post by our friends at the Natural Resources Defense Council (NRDC), Ann Shikany and Carter Rubin discuss how safer roads increase rates of biking, walking, and transit ridership, and enable fewer and shorter car trips.

Slow neighborhood greenways help people get around without getting in their cars. Photo via City of Seattle.

In communities across the county, our transportation system provides key linkages for commuters to jobs, kids to school and all of us to our social, family and recreational opportunities.

But the flip-side is that after decades of prioritizing transportation investments in new highways with a focus on speed above all else, we’re stuck with a transportation system that produces more carbon emissions than any other sector in the United States. Spread-out development facilitated by wide fast roads make cars all but essential for daily travel in many U.S. communities.

When you dive deeper into those carbon emissions—you’ll find that 59 percent of them come from light-duty vehicles—that includes the cars we drive around in for most daily trips. While the majority of daily trips are less than three miles, most of them are made by car. 

Even worse, transportation emissions are rising because people are driving more and making longer trips. Even with cleaner fuels (not to mention electric cars) and more efficient vehicles, the uptick in driving more is obliterating any emissions benefits. 

Why are people driving more, and using cars for even short trips? Because, with an overarching focus on vehicle speed and avoiding delay, nearly everything we’ve built for 60 years has been  designed for high speed vehicle movement, which makes getting around by any other mode—biking, public transportation, or your own two feet—dangerous and unpleasant. Our transportation system—and the federal policy that built it—forces many Americans to drive to get just about anywhere.

The good news is over 40 cities in the United States have adopted Vision Zero policies that seek to eliminate traffic fatalities and major injuries on our roads through safety policies and investment in the kind of infrastructure that will help keep everyone safe—with a priority on those who are most vulnerable. 

Some of the key strategies that cities use to meet this goal include:

  • Providing physical protection for people walking and biking, like bike lanes protected with planters, bollards and curbs.
  • Reducing vehicle speeds on routes intended for people walking and biking, so that people of all ages and abilities feel safe. 

Projects that lower speeds and make it easier to bike, walk, and use transit also compliment land use changes that bring destinations closer together. Slower speeds allow our streets to become places where people want to be, not race through. (As our own Carter Rubin said sarcastically when asked about the economic benefits of lower speeds during yesterday’s #SafetyOverSpeed tweet chat: “Brb, going to go shopping on the side of a freeway.” ) 

Improving bike and pedestrian networks is also one of the top policy priorities included in the Bloomberg American Cities Climate Challenge, and is being supported in nine challenge cities. If you’d like more detailed information on these policies, check out the Climate Action Playbook sections on bike and pedestrian infrastructure. We’ll also give you a quick snapshot of what this policy looks like in action:  

Prioritizing bikeway, sidewalk and crossing improvements (Portland, OR): Portland leads large U.S. cities in the percentage of commuters who bike to work and ranked tenth in 2016 for the percentage of commuters who walk to work. The city has 350 miles of bikeways, with more than 50 miles funded to be installed in the next few years. Portland has developed this infrastructure not just by creating bike plans, but by backing these plans up with funding. Portland is currently updating its pedestrian plan to prioritize sidewalk and crossing improvements and other investments to make walking safer and more comfortable across the city. It will identify gaps and needs in Portland’s pedestrian network, prioritize funding to locations with the greatest need first, and identify performance measures to track progress. (Read more.)

Responding to the need for safety improvements (Cincinnati, OH): After facing a record breaking year of pedestrian-involved crashes—430 in 2018—Cincinnati Councilmember Greg Landsman led the charge for safer streets. The city is now pursuing a Vision Zero strategy that included appointing new leadership and dedicated staff resources within the city’s Department of Transportation, prioritized funding for pedestrian safety improvements, and increased enforcement. Through the American Cities Climate Challenge, Cincinnati’s transportation team will also receive Vision Zero design training from the National Association of City Transportation Officials (NACTO).  (Read more.)

Every community deserves safe streets, clean air and action on climate. Thankfully, many cities are taking the first step by implementing Vision Zero policies locally. There is also work to be done at the federal level. On October 23, 2019, Representative Earl Blumenauer introduced the Vision Zero Act, which would make Vision Zero policies and investments eligible for federal funding. NRDC supports this legislation. Transportation for America’s push for safer streets as part of a comprehensive federal transportation investment strategy. 

Safety over speed week: The U.S. builds death traps, not streets

We took a look at one busy road outside of Orlando where a dozen people have been struck and killed by drivers in recent years. The mix of high-speed traffic with people walking, biking, and taking transit is a dangerous combination; in the event of a crash, people die. The Complete Streets Act of 2019 would go a long way to give local government more resources to redesign these dangerous streets so everyone can travel along them safely.

South Orange Blossom Trail isn’t a pleasant path through an orange grove, as the name would suggest, but rather a busy street in the Orange State that runs south from downtown Orlando. South Orange Blossom Trail is like many similar ‘arterial’ roads across the country: grocery stores, places of worship, clothiers, gas stations & auto repair shops, apartments & homes, restaurants, and a multitude of other businesses have sprouted along the route. And like so many similar streets surrounded by development in cities and towns of all sizes, it’s also a death trap for people on foot.

A street view of South Orange Blossom Trail and the location of this image relative to the 12 pedestrian deaths along this stretch of road from 2008 to 2017.

Between 2008 and 2017, 12 people walking were struck and killed by drivers along a 3,400 foot stretch of South Orange Blossom Trail. This six-lane thoroughfare (three lanes in each direction) is a gauntlet for people walking, and with the multitude of shops and homes in the area and bus stops regularly dropping people off on the side of the road, people walking are everywhere.

The nearest crosswalk isn’t even visible from this bus stop outside an apartment building.

This particular segment has a posted speed limit of 40 mph, but there is absolutely nothing about the design of this road that would encourage drivers to observe that limit. The wide, straight lanes and open skies communicate to drivers that this is a highway and you should thus be driving at high speeds. There are even signs that tell you which intersection you’re coming up on (because you’re certainly driving too fast to see it, as in the picture above). The only two signalized crosswalks along this stretch for pedestrians are at either end, 3,400 feet apart or about a 15 minute walk. While there are some unsignalized mid-block crosswalks, you have to be brave, stupid, or have no other choice to try crossing three lanes at a time hoping drivers going 50+ mph will stop for you. This street was built for speed not safety. It’s no wonder that a dozen people have been killed while walking along it in recent years.

South Orange Blossom Trail is the quintessential example of how U.S. street design standards and a focus on speed above all else have created such dangerous roads and why we have an epidemic of pedestrian deaths in this country. It’s a street designed for speed and to avoid vehicle delay. People walking, biking or taking transit are merely afterthoughts, just guests on this road designed for cars. Simply ask the people waiting to cross in the middle of these six lanes if it feels like this street was designed with someone walking in mind.

two images showing pedestrians attempting to cross the street.

It’s also the quintessential example of a street that the Complete Streets Act of 2019 in Congress is designed to fix. The Complete Streets Act would designate a small slice of federal highway funding to create Complete Streets that are safe for people walking, biking, taking transit, or driving. Any community with a Complete Streets policy—be it a county, city, town, or tribal government—would be able to apply for this funding directly to retrofit dangerous streets with safer designs.

Take action

Under the Complete Streets Act, counties could adopt a Complete Streets policy (if one isn’t already on the books) and then apply for dedicated funding to retrofit roads like South Orange Blossom Trail in unincorporated areas. Depending on the context, a safer street could include narrower lanes, protected bike lanes, signals at mid-block crosswalks, street trees, and other design interventions that can help slow cars and make space for different uses. On locally-owned roads, cities and towns could use the same pot of federal funding to implement similar improvements on dangerous roads.

For too long, prioritizing cars going fast above all else has been the top consideration in the design of our streets. It’s how we ended up with dangerous streets that look more or less exactly like South Orange Blossom Trail in all 50 states (even in Alaska, just add mountains along the skyline). According to current U.S. street design standards, this road and its ilk are designed exactly as they should be; that’s the problem.

We have to start putting safety over speed. Safety—literally keeping people alive—is more important than shaving a few seconds off a driver’s commute. And prioritizing safety is fundamentally incompatible with high speeds on these kinds of streets. The Complete Streets Act of 2019 would be a major step in the right direction, if Congress can pass it.

Send a message to your representatives urging them to support the Complete Street Act.

Safety over speed week: The key to slowing traffic is street design, not speed limits

Today, as “safety over speed” week continues, we’re running a guest post from our friends at Strong Towns that uses some simple pictures to explain how street design is a far more powerful tool for slowing down traffic and prioritizing safety compared to the strategy of lowering speed limits.

It’s “safety over speed” week here at T4America, and we are spending the week unpacking our second of three principles for transportation investment. Read more about those principles and if you’re new to T4America, you can sign up for email here. Follow along on @T4America this week and check back here on the blog for more related content all week long. Today’s post was written by Strong Towns and was originally posted in January of this year. We are thankful to Chuck Marohn and his Strong Towns team for letting us repost it here.

The cost of auto orientation—designing our towns and cities around the easy, fast movement of cars—is not just measured in dollars and cents. The number of U.S. traffic fatalities in 2017 topped 40,000 people. Nearly 6,000 of those people were on foot—a 25-year high. Each of those people had a unique story. Each of them had a family.

And after each high-profile crash, we all hear the same litany of advice from law enforcement and traffic safety professionals.

“Be hyper-aware of your surroundings.”

“Always obey the speed limit.”

“Speed is a factor in 30 percent of crashes.”

“Safety is a shared responsibility.”

And yet, we know that people are sometimes going to make mistakes. Even conscientious drivers make mistakes. People walking, going about their business, are going to make mistakes. No one is going to be hyper-vigilant every moment that they’re out in the world. And why should we have to?

We can’t regulate our way to safety. We must design our streets to be safe.

Two simple photos reveal what it means to design a street to be safe, versus counting on the speed limit alone to do the job. This meme was created by planner Wes Craiglow of Conway, AR, and shared on social media by the “Transportation Psychologist,” our friend, Bryan Jones. We first shared it back in 2015, but it remains timeless, so here it is again:

12189751_793987447390525_7047780377547951323_n.jpg

As Wes points out: “The meme is intended to help viewers consider how different street designs makes you feel as a driver, and ultimately affect how you behave behind the wheel. Generally speaking, as depicted by the lower photo, narrower travel lanes, shorter block lengths, and a tree canopy, all contribute to drivers traveling more slowly. Conversely, wide lanes, long block lengths, and open skies, as seen in the upper photo, communicate to drivers that higher speeds are appropriate.”

Look again at the two photos. Imagine yourself behind the wheel of a car on each street. On which street would you drive faster? On which street would you exercise more caution?

“Forgiving” design is a misnomer

12189751_793987447390525_7047780377547951323_n.jpg

The first photo looks like tens of thousands of suburban streets all over America. It’s entirely representative of something the transportation engineering profession calls “forgiving design.” The premise is simple: drivers will make occasional mistakes—veer a bit out of their lane, fail to brake quite hard enough—and if the street is wide, with high visibility in all directions, and free of immediate obstacles such as trees and fences, those mistakes won’t be catastrophic.

The problem: this street feels too forgiving to a driver. Too safe and comfortable. So drivers speed up. The engineers didn’t account for this aspect of human psychology.

This residential street is built like a four-lane highway, and so even though its legal speed limit is 20 miles per hour, it’s no surprise when somebody guns it up to 40 miles per hour or more down a street like this. It feels natural to do so. It feels safe. But it isn’t safe—because on a city street, unlike a freeway, there might be people around. People who will most likely be badly hurt or killed if a speeding driver hits them.

Read transportation engineer Jon Larsen’s explanation of why the forgiveness of slow speeds is better than the “forgiving” design of wide streets.

The paradox of street design: if it feels a bit dangerous, it’s probably safer

12189751_793987447390525_7047780377547951323_n.jpg

The second photo, on the other hand, represents the most basic, frugal approach to designing a street for slow speeds. It’s not perfect. It lacks sidewalks or bicycle facilities, which some of our readers might take issue with—and yes, many places ought to have those things.

But this “slow street” does something really profound and important. It causes drivers to slow down, whether or not there’s a posted speed limit or law enforcement is present, because of the uncertainty and sense of heightened risk.

The street is narrow. Visibility is limited—look at that front left corner of the intersection, where a red fire hydrant stands next to a white fence. The lack of visibility there is not a safety hazard: paradoxically, it’s probably the single biggest thing that promotes safety at this intersection. Because if you’re driving here, and can’t see whether a vehicle is approaching from the left, what are you going to do?

That’s right. You’re going to slow down.

Read Daniel Herriges’s article on why narrow streets can deliver a ton of benefits to our cities and towns at low cost.

Why 20 miles per hour?

If we could keep most urban traffic to 20 miles per hour or less, we could eliminate the vast majority of deaths from car crashes in our cities and towns. We wouldn’t eliminate mistakes—people, both inside and outside vehicles, are going to make them—but those mistakes would rarely be deadly.

mphdeathrate.jpg

The place for wide lanes and “forgiving design” is on a high-speed road. City streets, on the other hand, should be places for people. We know how to design streets that will slow down traffic automatically, without the need for heavy-handed enforcement, and regardless of what the speed limit sign says. We just need to do it.

Read Chuck Marohn’s article on the crucial difference between a street and a road.

Learn more about our Slow the Cars campaign. Do you like this content, and want to help us produce more like it? Become a member of the Strong Towns movement, and support Strong Towns’s work to make our streets safe, welcoming, and productive places for people.


Thanks again to Strong Towns for participating in yesterday’s Twitter chat, for letting us share their content here, and for running our post on slip lanes from earlier this week.

Safety over speed week: Our transportation system values some lives more than others

U.S. transportation policy focuses first and foremost on ensuring that drivers can travel with as little delay as possible. But this laser focus on speed sidelines other more important considerations like the preservation of human life and the health impacts of vehicle pollution. Prioritizing safety in our transportation policy—at the federal, state, and local levels—would be a major step towards a more equitable transportation system.

America’s transportation system is fundamentally inequitable. More resources go to wealthier and more politically connected communities; streets are designed to prioritize high-speed (expensive) vehicles over the safety of people, walking, biking, or taking transit; everyday destinations are out of reach for many people who don’t own or can’t afford a car. Those are just a few obvious examples.

Equity is a key consideration throughout our new principles for transportation, but it’s at the heart of the second one: Design for safety over speed.

In the U.S., our overarching priority in transportation for the past century has been to help cars to go as fast as possible, all the time, no matter the context. The term jaywalking was invented to shame people who dared to use public space that was increasingly becoming the realm of cars alone. We bulldozed entire neighborhoods—almost exclusively communities of color—in cities around the county to make way for new interstates that enabled white flight. And as interstates and other roads filled with traffic we spent vast sums of public money to bulldoze even more homes and businesses to widen the roads, only to watch them fill up with even more traffic.

But our focus on prioritizing speed above all else with the public right-of-way has not had the same negative impact on everyone.

The pollution that this futile pursuit of speed has generated disproportionately impacts lower-income people and people of color. “On average, communities of color in the Northeast and Mid-Atlantic breathe 66 percent more air pollution from vehicles than white residents,” according to the Union of Concerned Scientists. This pollution shortens lifespans and can have lifelong impacts from developmental problems in children to increased rates of asthma, diabetes, and other chronic health impacts.

As our colleagues at Smart Growth America noted in Dangerous by Design 2019, “even after controlling for differences in population size and walking rates, we see that drivers strike and kill people over age 50, Black or African American people, American Indian or Alaska Native people, and people walking in communities with lower median household incomes at much higher rates.”

While federal data on traffic fatalities doesn’t include information on a victim’s income level, it does include where a person was walking when they were killed. And people walking in lower-income communities are far more likely to be struck and killed by drivers than people walking in middle-income communities. (One would logically assume that these victims are more likely to live in those lower-income communities.) The disparities in these fatality rates are a direct reflection of policy and funding decisions. Low-income communities are less likely to have sidewalks (in good condition), marked crosswalks, and street design to support safer, slower speeds.

We need to prioritize the safety of those outside of vehicles

Part of the solution is making sure we’re putting the safety of people walking, biking, and taking transit on equal footing with people driving. In most places, the people more likely to be traveling outside of a vehicle are people who have suffered the most from the previously outlined disparities and inequities. Our call to design local and arterial roads surrounded by development for no more than 35 mph would dramatically improve equity. When you have people walking, shopping, dining, waiting for the bus or otherwise going about their lives, roads designed for drivers to travel at 40 or 50 mph are simply too fast and too deadly. A pedestrian hit by a driver at 50mph is about twice as likely to die as a person hit at 35 mph.

See the full interactive graph at ProPublica.

To be clear, this isn’t just a function of speed limits.

While lowering speed limits is important, what most people don’t understand is that once you’re behind the wheel of a car, you will drive at the speed you feel comfortable. Designing for safety is paramount. Wide, straight lanes and open skies give unspoken cues to drivers that this road is built for speed. In contrast, narrower, perhaps curvier lanes that are enclosed by buildings or streets trees signal to drivers that they should be driving slower.

Beyond being intentional about the safety of people outside vehicles, resource allocation is critical. Many federal grant programs for infrastructure projects, even small but critical ones like redesigning a deadly intersection, require a local funding match. But for many poor cities and towns—both rural and urban—securing such matching funds can be prohibitive. At the local level, officials need to be intentional about tracking where and how funds are being spent to ensure that the streets in lower-income areas designed for safe travel just more affluent areas.

Communities impacted by vehicle pollution should also have a larger voice in planning future transportation investments. Too often these communities are excluded, or their voices are given less weight than others even though they will be the ones who bear the greatest impact from a widening highway or larger road. One example of this is how most projects to widen or expand a roads typically only consider the limited improvements to travel time for commuters traveling through that area, while failing to consider the impacts on those who may need to cross that street, or the increased air pollution for those who live nearby.

It’s simply not part of the typical calculus; all of the underlying metrics in the federal transportation program focus simply on vehicle speed, delay, and throughput. Many states are even planning for more people to die in future years—it’s an implicit acknowledgement that their streets are unsafe yet nothing in federal law requires them to try and kill fewer people. So many simply won’t act.

Safety must be our priority. Making walking, biking, and taking transit safer will save lives and help reduce driving, in turn reducing the health disparities in low-income communities and communities of color.

In the end, this is about whether or not we value the lives of everyone. Today, our transportation policy—particularly at the federal level—values a few seconds saved for motorists each day over the lives of people walking, biking, or taking transit. It values the lives of the wealthy over the lives of low-income people. And it values the lives of white or more affluent Americans over the lives of other Americans. By putting safety at the heart of our transportation policy, we can start to create a more equitable transportation system.

Safety over speed week: Prioritizing safety is intrinsically connected with improving transit service

Nearly every bus transit rider starts and ends their trip with a walk, and decisions made to prioritize vehicle speed over safety often have significant impacts on transit. This excerpt from the new book Better Buses, Better Cities helps explain how better bus transit and prioritizing safety over speed are intrinsically related.

It’s “safety over speed” week here at T4America, where we are spending the week unpacking our second of three principles for transportation investment. Read more about those principles and if you’re new to T4America, you can sign up for email here.

The content that follows is an excerpt from “Better Buses, Better Cities: How to Plan, Run, and Win the Fight for Effective Transit” by Steven Higashide, published by Island Press. Steven is a former colleague of ours at T4America as an outreach associate based in New York a few years ago before moving on to the Tri-State Transportation Campaign and then to TransitCenter, where he today serves as the research director. We are proud to see his book in print and are thankful to him and Island Press for letting us share this long excerpt from Chapter 4 entitled MAKE THE BUS WALKABLE AND DIGNIFIED, sourced from pages 59–61 and 74-75. – Stephen Lee Davis, T4America.

On a Saturday afternoon in April 2010, Raquel Nelson, her 4-year-old son A.J., and her two other children (aged 2 and 9 years) stepped off the bus across the street from their apartment in Marietta, Georgia. It had been a good but long day. Raquel and her children had celebrated a birthday with family and pizza. To get home, they took their first bus from the pizza restaurant to a transit center, where they missed their connecting bus and had to wait more than an hour for the next one.

Home was across a five-lane, divided road. And so, together with several other people who had been on the bus, the Nelson family crossed halfway across the street to wait in the median. As Raquel stopped to gauge traffic, one of the other adults in the group decided to start walking. Raquel’s son A.J. broke free from her grip to follow, and Raquel hurried to catch up.

A.J. was killed moments later, by Jerry Guy, who was behind the wheel of a van despite having “three or four beers” in his system.

Raquel and her 2-year-old daughter were also struck and injured. And yet that was only the beginning of her ordeal.1

County prosecutors charged Raquel with vehicular homicide, which carried a potential sentence of 3 years in prison. A jury convicted her, and she was sentenced to 12 months’ probation with the option of a retrial, which she chose. Her case wound through the courts for 2 more years before Raquel agreed to plead guilty to a single charge of jaywalking.

Raquel Nelson’s case made national news. But the loss she and her family experienced is replicated in nearly every city on wide “arterial” roads that encourage high speeds. In the City of Los Angeles, for example, 6 percent of streets are responsible for 65 percent of traffic deaths and injuries. When mapped, pedestrian deaths line up on these roads like dominoes.

Because they tend to have important destinations on them, arterial roads also tend to carry the most bus riders. But the tie between transit and walkability goes beyond pedestrian safety. Nearly all transit riders are pedestrians at some point during their trip. In Los Angeles, for example, 84 percent of bus riders get to their bus stop on foot.

The pedestrian experience is the transit experience, then. A bus rider may appreciate frequent and fast service but still be dissatisfied with her trip if she has to trudge through mud on the way to the bus stop, cross the street with her head on a swivel, and wait in the rain with no shelter. Someone who uses a wheelchair may be unable to use the bus at all if there are no sidewalks leading to the stop.

Poor walkability is corrosive to bus ridership and makes it harder to improve transit service. In Staten Island, New York City, transit planners had to make major adjustments to a redesign of the borough’s express buses after riders complained that the changes forced them to walk in the street or on lawns.

Although Austin’s bus network redesign has generally been considered a success, it ran into the same problems. More than a month after the launch of the redesign, Capital Metro was still moving stop locations in response to complaints that people had to transfer in places without good walking infrastructure. “If you’re going to go to more of a grid-based system and you’re going to have more on-street connections, then you really need to look at the pedestrian experience of those intersections,” Capital Metro’s Todd Hemingson said. (As of April 2019, only about 60 percent of streets in Austin have sidewalks.)

Improving the walk to transit, on the other hand, can have measurable impacts on transit ridership. Ja Young Kim, Keith Bartholomew, and Reid Ewing of the University of Utah found that after the Utah Transit Authority built sidewalk connections to bus stops that lacked them, ridership at those stops grew almost twice as fast as at stops in similar neighborhoods that had not been improved. Demand for paratransit was also stemmed near the stops with sidewalk improvements, saving the agency on its budget.

Although walkability and transit can’t be separated, government usually makes its best effort to do so. Just as transit agencies must convince cities to give transit priority on the street, they must rely on local and state government to create a good walking environment. That’s no given.

The state of walking in America represents an enormous collective failure. Even in urban neighborhoods where many people walk, engineering practices that favor drivers tend to degrade the experience. Intersections can be designed with slip lanes that allow cars to gun through turns. Zoning may allow curb cuts that turn the sidewalk into a gauntlet of traffic. The default rule at most intersections is “right turn on red,” intrinsically hostile to people walking because there’s never a time when they can be sure cars won’t turn into their path.

These decisions are rooted in a philosophy that prioritizes vehicle speeds and is often baked into engineering measures and practices. Engineers often assess streets using a metric called “automobile level of service,” where an A grade is free-flowing traffic. A major traffic engineering manual recommends against striping crosswalks unless at least ninety-three pedestrians already cross the intersection per hour—or if five people were hit by cars at the intersection in the past year. Peter Furth, an engineering professor at Northeastern University, has pointed out that “Synchro, the standard software [traffic engineers] use, is based on minimizing auto delay, and it doesn’t even calculate pedestrian delay.”

Although most streets are municipally maintained, most cities require local property owners to maintain sidewalks abutting their property. This means that wealthier neighborhoods tend to have better maintained and safer sidewalks. The further you get from downtown, the more likely it is that sidewalks themselves will shrink, decay, or vanish. Property owners may not be required to build sidewalks at all, which means many cities simply lack sidewalks in a huge portion of their territory.

Fighting for People on Foot

Pedestrian infrastructure doesn’t cost much relative to other transportation infrastructure. Houston’s $83 million in backlogged sidewalk requests could mostly be wiped out by nixing a $70 million project to add an interchange on an area toll road. Even the $1.4 billion price tag to build functional sidewalk on every Denver street doesn’t look so daunting when the Colorado Department of Transportation is spending $1.2 billion in just 4 years to widen Interstate 70, which runs northeast of downtown Denver.

Shelters aren’t particularly expensive either, costing roughly between $5,500 and $12,000 each. In 2017, medium and large transit agencies spent $297 million on infrastructure at bus stops and stations, compared with $2.2 billion on rail stations—or about 6 cents per bus trip and 47 cents per rail trip.

Creating walkable places requires changing municipal processes so that compact planning (creating neighborhoods where there are many destinations worth walking to) and pedestrian-friendly street design become routine.

This often starts with outside advocacy and political action.

The do-it-yourself movements I mentioned earlier in this chapter ultimately seek not to supplant government but to prod it to action. A year after MARTA Army launched its “adopt-a-stop” campaign, the state of Georgia awarded the Atlanta Regional Commission $3.8 million for bus stop signs, shelters, and sidewalks. Cincinnati’s Better Bus Coalition doesn’t just build benches; it has also published an analysis showing that shelters are disproportionately in wealthy neighborhoods. Streetsblog USA runs an annual “Sorriest Bus Stop in America” contest that has gotten governments in Kansas City, Maryland, and Boston to address bus stop walkability.

In Nashville, a long-time neighborhood activist, Angie Henderson, was elected to the city’s Metropolitan Council on a platform of walkable neighborhoods in 2015. Henderson later sponsored and passed a law requiring most developments in inner-city neighborhoods and near commercial centers to include sidewalks or pay into a citywide sidewalk fund. Denver’s City Council created a $4 million fund to help lower-income homeowners fix the sidewalks in front of their houses and budgeted for three new Public Works employees to manage the program and step up enforcement of sidewalk regulations throughout the city. And Seattle’s Department of Transportation has broken with the engineering guideline that says crosswalks should be striped only where many people already cross or where there are frequent pedestrian crashes.

Within transit agencies themselves, it’s important to raise the profile of the walk and the wait. Metro Transit’s Better Bus Stops Program is a great example. The decision to elevate a routine process into a branded program gave bus stops new stature throughout the agency.

“[The process of siting bus shelters] could be thought of as very dull and unimportant,” Farrington said. “But to package it, to get a great little logo and have it be a substantial program with its own name and people, it’s been a positive spiral of more resources and more support of the work.” She said that staff who had previously worked on park-and-ride stations were now spending more time on bus stops. True, in some ways the program was an outlier, funded by an Obama-era discretionary program, Ladders of Opportunity, that no longer exists. But transit agencies could replicate it using funding from many other sources.

Metro Transit’s program also offers a clear example of how well-resourced, well-planned public engagement can strengthen and educate both the transit agency and the communities it operates in.


Thanks again to Steven Higashide and Island Press for allowing us to run this excerpt. You can buy his book direct from Island Press or find links to purchase at other various outlets there. -Ed

Safety over speed week: Drive like your kid business lives here

Economic slowdowns are generally a bad thing. But slowing down might be good for the economy, so long as we’re slowing vehicle speeds. Streets designed to accommodate (slow) drivers, people walking and biking, and transit riders are better for businesses, save money on health care costs, and can help businesses attract and retain talent.

It’s “safety over speed” week here at T4America, and we are spending the week unpacking our second of three principles for transportation investment. Read more about these principles and if you’re new to T4America, you can sign up for email here. Follow along on @T4America this week and check back here for more related content all week long.

Imagine a vibrant commercial corridor, with people window shopping, eating at a sidewalk cafe, or chatting in a plaza. Perhaps there are cars parallel parked under trees planted next to the wide sidewalk. Some are locking up their bikes while others are waiting at a clearly marked bus stop. Cars are traveling slowly and crosswalks are frequent. 

Now imagine that place where the slow traffic is replaced by high-speed vehicles on the nearby roadway. The sidewalks no longer feel like a place to stroll and window shop and outdoor seating is unpleasant—the people have disappeared because it feels unsafe. The sidewalk might be narrowed and trees removed to accommodate more lanes to move more cars quickly past the once vibrant corridor. The people may be gone, but the businesses are still there and struggling to hang on. 

In America today, we are much more likely to build the second lifeless street that prioritizes speed than we are to build the first vibrant street that prioritizes safety.

Our transportation policies are designed primarily to move vehicles as quick as possible while ignoring other users. Instead of sidewalk cafes and cyclists locking their bikes, the street is empty. Instead of parking and shopping, motorists speed through, on their way to somewhere else. Public transit riders have disappeared too, as this is no longer a destination, it is a place to drive-through. 2

Our focus on keeping cars moving above all else harms local economies. Study after study has shown that business sales at worst stay the same but often increase when we redesign streets to lower speeds and safely accommodate people walking and on bikes. Getting more people (i.e potential shoppers) on the street is key.

Streets with slower speeds are more inviting for everyone, including people walking, biking, and taking public transit, creating the crowds which spend and invest in the corridor. Streets with slower speeds enable environments where people will spend time and linger, creating a sense of civic community, a sense of place. Streets like this are the basic building block of creating and capturing long-term value. And most cities and towns, whatever their size, would never survive without having these incredibly financially productive corridors.


Downtown Erwin, TN photo by Brian Stansberry. Licensed with Creative Commons 3.0

Healthy streets are good for business

Beyond these direct economic impacts of safer streets, making it safer for people to walk or bike can improve community health and reduce medical costs, freeing up public and private dollars to be invested in other ways.

A 2010 report from the National Highway Traffic Safety Administration (NHTSA) found that bicycle and pedestrian crashes caused “$16 billion in economic costs and $87 billion in comprehensive costs, accounting for 7 percent of all economic costs, and 10 percent of all societal harm (measured as comprehensive costs).” Imagine all that money, which could otherwise be spent in local communities. 

Making your downtown a safer place to walk is a key component of economic competitiveness in today’s economy. Research indicates that companies of all sizes are increasingly relocating to walkable and transit-accessible downtowns because that’s where talented workers want to be. Amazon’s recent search for a second headquarters—where access to transit was a core requirement—is just one example of this larger trend. We wrote about State Farm’s similar move to consolidate dozens of offices in just a few transit-connected, walkable locations a few years back.

Congress urgently needs to decide whether or not to prioritize safety over speed with the billions in transportation dollars they give to states and metro areas each year, but fortunately, we do not have to choose between safer streets and our economy. We just have to choose safe streets.

Safety over speed week: Slip lanes would never exist if we prioritized safety over speed

A specific design feature on our roadways is the quintessential embodiment of what happens when speed is the #1 priority and safety becomes secondary. Slip lanes, those short turning lanes at intersections that allow vehicles to turn right without slowing down, are incredibly dangerous for people walking. Yet states & cities keep building them. Why?

It’s “safety over speed” week here at T4America, where we are spending the week unpacking our second of three principles for transportation investment. Read more about those principles and if you’re new to T4America, you can sign up for email here.

Any traffic engineer or transportation official would surely tell you that safety, if not the most important consideration, is truly a core priority. But embedded deeply in our federal transportation program is another guiding principle that stands in direct opposition to safety:  “Cars need to always move fast and never slow down.” Whatever the stated priorities are, this hidden prerequisite makes every other goal a nearly impossible task—especially safety. 

Slip lanes on roads and streets are emblematic of what it looks like in practice to sacrifice safety on the altar of speed, where this underlying goal of “keep cars moving fast at all times” runs counter to the goal of “keep everyone safe while moving from A to B”—even if you say that safety is important. If we truly prioritize safety, as T4America is suggesting in our second principle, we would never build a slip lane on a local street again. 3

What are slip lanes and why do they exist?

It’s important to remember that slip lanes were created to solve one specific set of problems: vehicle speed and delay. 

They were borne of the simple realization by traffic engineers that cars turning right—even on a green light—can produce dreaded congestion because slowing down to a safe turning speed can delay traffic traveling straight. So to solve this one problem, they started adding lanes that allow traffic to make right turns without being required to slow or come to a stop, often accompanied with an additional lane on the approach or the exit. Whether you live in a rural, urban or suburban area, this feature isn’t hard to find: they’re a regular feature in most environments that were designed and built with federal money and guidance over the last 50 years. 

Safety was always at best a secondary consideration, though it really wasn’t considered much at all for decades as traffic engineers started adding slip lanes to road projects all over the country.

Slip lanes are dangerous because they prioritize vehicle speed over the safety of everyone who needs to use the road

Slip lanes increase the distance that people have to cover to cross a street, put people into spots that are often the hardest for drivers to see, and encourage drivers not to slow down when approaching an intersection and a crosswalk—the precise moment they should be the most careful. This slip lane I saw in N. Fulton County, Georgia earlier this summer is a pretty typical design. 

Traveling east on N. Hembree Road (with a speed limit of 40 mph!), if a driver is planning to turn right here and sees the green light ahead, all the design cues are directing the driver to blaze through the right turn onto Alpharetta Highway without slowing down. That driver could be hitting maximum speed right as they reach the crosswalk across the slip lane—exactly the spot where engineers have said that a pedestrian should “safely” cross this street.

I saw a woman crossing here and I was astonished to see that in the time that it took her to take just three steps from the middle of the street towards safety, a minivan goes from entirely out of the frame to just 10 feet away from her.

Because slip lanes were borne of the sole focus on avoiding vehicle delay, all efforts to make them “safer” will be limited. Safety is not why they exist. Even the Federal Highway Administration (FHWA) knows they are inherently unsafe—it’s astonishing to read their guidance for making them, in their words, “less problematic”:

Intersections should be designed to accommodate safe pedestrian crossings using tight curb radii, shorter crossing distances, and other tools as described in this document. While right-turn slip lanes are generally a negative facility from the pedestrian perspective due to the emphasis on easy and fast vehicle travel, they can be designed to be less problematic.

How are slip lanes emblematic of safety losing out to the ultimate priority of speed?

Here’s an intersection in Minneapolis with slip lanes on all four sides. These don’t exist primarily to make anyone safe—safety is an add-on consideration to the primary desire to keep cars moving as fast as possible through this intersection. Those crosswalks and pedestrian “islands” that you see aren’t designed to get anyone across this street in the safest way possible, they are a half-hearted attempt to make the best of a road designed explicitly to keep cars moving quickly above all else. 

Making the experience for people walking on a “negative facility…to be less problematic,” is a pretty interesting choice of words to describe a deadly design feature at a time when pedestrian fatalities are hitting numbers not seen since 1990. But we keep building them because moving vehicles quickly and without delay is the outcome we care about above all others.

What prioritizing safety over speed would look like

As we say in our second principle, local and arterial roads must be designed to put safety first. Protecting the safety of all people who use the street must be a priority reflected in the decisions we make about how to fund, design, operate, maintain, and measure the success of our roads. The next surface transportation law must make safety a priority and start to undo the damage wrought by decades of federal design guidelines and billions in federal transportation dollars.

So what would this look like in practice? This small change in Arlington, Virginia is a great example. 

This is a minor collector road that runs largely through a residential neighborhood—not too far from the future home of Amazon’s second HQ. This slip lane made it possible for drivers to whiz into the neighborhood street without so much as a tap on the brakes. Look down the street and what do you see right after cars have sped through the gentle right turn? A crosswalk. That’s what it looked like back in 2009, but here’s what it looks like today:

The lanes were narrowed, the slip lane was eliminated, the right turn was converted into a sharper turn that requires drivers to slow down before turning, and the crosswalk was moved to the safest and shortest point of the intersection where pedestrians will be the most visible. 4

It’s very possible that because cars now have to slow down to turn right, that traffic occasionally slows down on the main road. There could even be a slight back up if a few people are turning right and have to yield to someone crossing the street. But this change is exactly what it looks like in practice to prioritize safety over vehicle speed or delay. 

While this small change is certainly one worth celebrating, this isn’t the standard practice of state DOTs that control the lion’s share of federal transportation funds, and speed remains their number one priority—even if they have a stated commitment to safety. This project was the result of a local county making decisions on their own and with their own funds. Most states will not change their practices unless Congress gives a guiding directive that the lives of the 40,000 people who die as a result of traffic fatalities each year are more important than a few seconds of delay.


Access to safe, convenient transportation is a fundamental right. Today, most Americans are denied this right because their roads—not just their highways—are designed to move vehicles at the highest speeds possible, and roads are not designed for people walking, biking, or taking transit as a priority. Safety may be important, but it’s never the top priority when designing these streets.

Until we come to grips with the fact that moving cars fast at all times of day without delay is a goal that can’t always be squared with our other priorities—especially safety—and until we can admit that perhaps everyone is not going to be able to go fast all the time, we’ll continue building unnecessarily large and expensive roads where thousands of people are killed each year.

No more slip lanes. Because safety should be a primary goal of our transportation investments.

Competition: Which street is the most dangerously-designed?

This week, we’ll be taking a deep dive on our second principle for transportation policy: design for safety over speed. Throughout the week, send photos of streets in your area that are designed for speeds far higher than the posted speed limit or where the speed limit is way too high for the context. On Friday (Nov. 8), you’ll have a chance to vote for the worst offender.

At slow speeds, cars can mix safely with other road users. High-speed interstates remove conflicts to keep people safe. But when people and high-speed traffic mix, that’s a recipe for disaster.

There’s a difference between the speed limit posted on a road and the speed the road has been designed for. People will drive at the speed they feel comfortable, regardless of the speed limit. Wide, straight lanes with open skies, long blocks, and few traffic signals or stop signs tell drivers it’s okay to go fast. Conversely, narrower lanes, more frequent crossings, and street trees can encourage slower speeds that are more appropriate for developed areas.

Off the interstates, in areas with shops & restaurants, offices, schools, and homes, we should be designing for slower speeds—speeds that keep people walking, biking, or taking transit safe and comfortable. Too often these very streets are designed to encourage high-speed thru traffic and then we wonder why our streets are so dangerous to people walking and biking.

Send us photos of dangerous streets in your area! Email us at jenna.fortunati@t4america.org or tweet your photo(s) to @t4america and tell us a little bit about it. On Friday, we’ll poll our followers to identify the most egregious example of a street that prioritizes speed of people’s safety.

Examples of unsafe streets abound, and it’s not just suburban arterials. Take for example, Georgia Ave NW through the heart of Washington, DC. The posted speed limit is 30mph, but this four-lane, two-way road is arrow straight and drivers rarely travel at or below 30.

Within a few hundred yards of this photo there are laundromats and pharmacies, numerous bars and restaurants, homes for thousands of people, an elementary school, and a church. There’s also a metro stop and a dozen different bus stops—people walking are everywhere. Yet the design of this street clearly prioritizes the speed of car traffic over the safety of everyone else.

We want you to send us photos of streets where cars routinely drive above the speed limit (or where the posted speed limit is way too high) because the street isn’t designed to prioritize safety, or not designed appropriately for its busy context. Snap a photo this week and send them to us with a short description via twitter or email. On Friday, we’ll hold a poll on our Twitter account where you can vote for the worst offenders.

Safety over speed week: There’s one thing that almost every fatal car crash has in common

We face an epidemic of people struck and killed while walking and biking because our local streets—not just highways—are designed to move vehicles at the highest speeds possible rather than prioritizing the safety of everyone. It’s high time to stop sacrificing safety on the altar of speed with the tens of billions that the federal government spends every year. Here’s how Congress could make that happen.

It’s “safety over speed” week here at T4America, and we are spending the week unpacking our second of three principles for transportation investment. Read more about those principles and if you’re new to T4America, you can sign up for email here. Follow along on @T4America this week and check back here on the blog for more related content all week long.

Let’s start with a number: 49,340. 

That’s how many people were struck and killed by cars while walking on streets all across the United States between 2008 and 2017. Almost 50,000 preventable deaths. 

And yet, by and large, we call these crashes “accidents.” We still believe that these 50,000 deaths, and the deaths of almost 32,000 people every year killed inside of vehicles, are either just the cost of doing business for our transportation system, or were the product of bad behavior: distracted drivers, fatigued drivers, drunk drivers, or drivers not wearing seat belts. 

There’s no doubt that distracted driving increases crash risk and should be punished. But distracted driving can’t explain all of these deaths. There’s one thing that almost every crash has in common, though: high vehicle speed.

When crashes occur at higher speeds, they are more likely to be fatal, especially when they involve a person biking or walking.

In 2017—the year in which pedestrian and cyclist fatalities first reached the highest level since 1990—the NTSB issued a landmark study about how speed is the #1 culprit in traffic fatalities, finding that scores of crashes would not have been fatal at lower speeds. 

It’s easy to ignore something that you don’t understand, and most policymakers don’t understand when and how high speed roads can be safe—and when they aren’t. 

When are high-speed roads safe, and when are they deadly?

The only way to make a high speed roads safe is by separating opposing traffic; removing conflict points, like driveways and cross streets; and separating or removing cyclists and pedestrians. Of course, this is something we frequently do: it’s called a limited-access highway. 

But we’ve tried to design for similar high speeds on our arterial roadways in existing communities while retaining all the points of conflict that make those speeds deadly. Think of any suburban road lined with retail, offices, schools, and homes. Those streets—with multiple destinations along them—are designed like highways.5


Graphic from Strong Towns

Our sister organization, the National Complete Streets Coalition, explains that most cyclist and pedestrian fatalities occur on these 35-50 mph arterial roadways in our urban and suburban areas—roads designed for high speed but with all the conflict points of the slower speed streets, like slip lanes or numerous curb cuts for entrances and exits across a sidewalk. 

Reducing speed is the best solution

If we want these roads to be safe, they either need to become limited-access highways (unlikely, expensive and damaging for the local context) or they need to be designed for lower speeds with lower speed limits.

And we know exactly what speed these roads need to be designed for: 35 miles per hour, or less in many cases. But 35 should be the ceiling for these types of roads, not the floor, when it comes to design speed.

We are pursuing higher speed roadways because we have placed jobs and services far away from the homes of the people who need them. We make up for the inconvenient location of everyday necessities with higher speeds in hopes of shorter travel time, but it never works out that way. Instead, we get a lot of traffic congestion as everyone floods onto the same roads, seeking the same far-away, disconnected destinations. Even in free- flowing traffic, people save seconds or, rarely, a minute or two. And for that, we sacrifice thousands of innocent lives each year. More often than not, those killed are children, the elderly or those with lower incomes.

We need to better measure how speed contributes

Currently we only call a crash “speed related” when someone was driving over the speed limit. We don’t track whether the speed limit was inappropriately high, or if the speed  of the car played a factor in the crash or fatality even if the speed was under the posted limit. In fact, numerous local governments across the country are in arguments with states on who has the authority to lower speed limits. 

It’s time to determine and report when speed was a cause of a crash. It’s time to give local governments the authority to lower speeds to make a street safe and appropriate for its surroundings. And engineers should design roadways in support of slower, safer speeds. 

Congress can make protecting the safety of all people who use the street a priority by reflecting this in the decisions they make about how to fund, design, operate, maintain, and measure the success of our roads. The federal program should require designs and approaches that put safety—for everyone—first.