
New national survey examines how metro areas use performance measures to evaluate their spending

Thanks to action taken by Congress, metro areas will be required to use a data-driven process to measure the performance of their transportation spending. But some metro areas already go far beyond the modest new federal requirements. T4America’s new national survey of over 100 metro planning agencies examines the current state of the practice — and where it’s headed.

The federal transportation law enacted in 2012, MAP-21, ushered in a new era by requiring metropolitan planning organizations (MPOs) to start evaluating the performance of their transportation investments against a handful of federally required measures. (We’ve written about this just a bit over the last few years.)

Some metro areas have been doing this for years, going far beyond the federal government’s modest new requirements (such as safety or condition of roads & bridges) to assess their transportation investments in terms of more ambitious goals like return on investment, public health and access to jobs. With the new suite of measures finalized by USDOT in early 2017, it’s no longer an option for MPOs now — it’s a requirement.

To find the answers to some of these key questions and establish a state of the practice, T4America conducted a national survey of 104 MPOs from 42 states in 2016. Our survey tried to assess:

  • How many MPOs are already using performance measures in some form?
  • How many are interested in going beyond the new modest federal measures?
  • What’s keeping them from doing more?
  • What other key goals and metrics are they interested in measuring?

Among a range of interesting findings, we discovered that the majority of the MPOs surveyed (75 percent) are already using performance measures in some fashion. However, there is significant room for improvement in how they use them — only 30 percent of all MPOs utilize performance measures to evaluate specific projects for inclusion in the fiscally constrained five-year plans that govern all short-term spending.

While most MPOs are focused on meeting the new federal requirements, two-thirds of all agencies surveyed also want to become national leaders in using performance measures — including many MPOs currently doing only the minimum or just getting started. When it comes to additional measures outside of MAP-21’s modest new requirements, nearly half of MPOs surveyed chose equity and/or health as one of the five additional goals they are interested in measuring and assessing.

View the full survey results here.

Apply for technical assistance from T4America

In addition to the survey, T4America is today announcing a new technical assistance program specifically designed to help MPOs successfully respond to federal, state and local requirements. Find out more about applying, including info on an upcoming webinar to explain more about the application process.

Learn more & apply

NOTICE OF FINAL RULEMAKING: Assessing performance on the NHS, freight movement on the interstate system, and the CMAQ program

DATE EFFECTIVE: FEBRUARY 17, 2017

[FEDERAL REGISTER NOTICE, HERE]

Overview

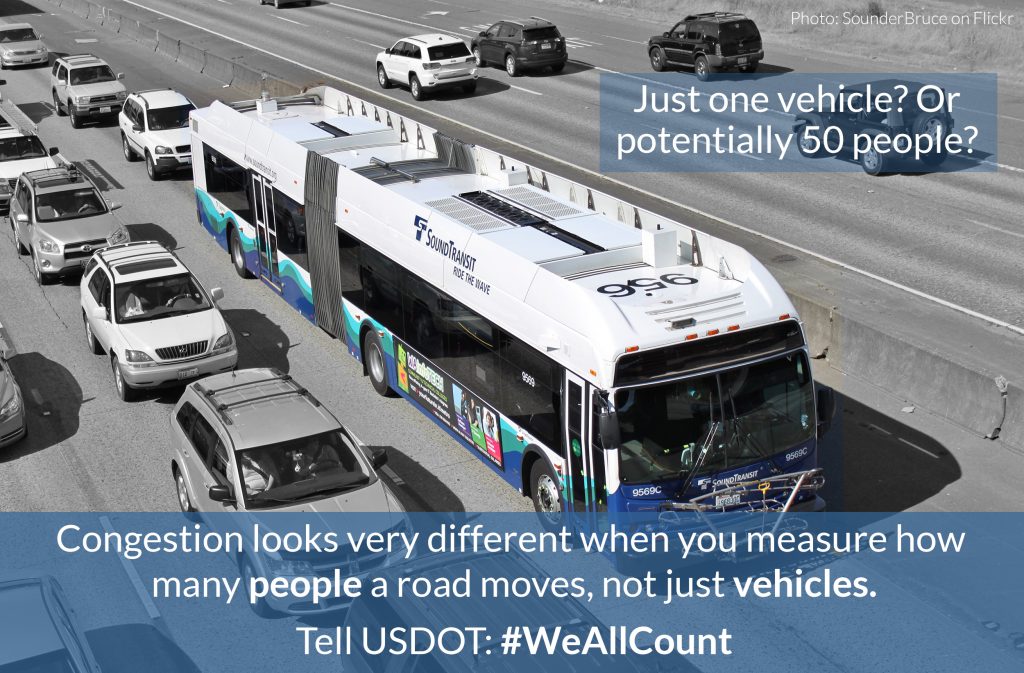
Less than one year after the Federal Highway Administration (FHWA) first proposed outdated measures of congestion (see T4America’s blog post here) and after thousands of our members and partners provided comments, FHWA is now finalizing this rule. Published on January 18, the final rule rolls back some of the redundant, vehicle-focused measures initially proposed in the notice of proposed rulemaking (NPRM) and incorporates some significant changes, many of which we advocated for.

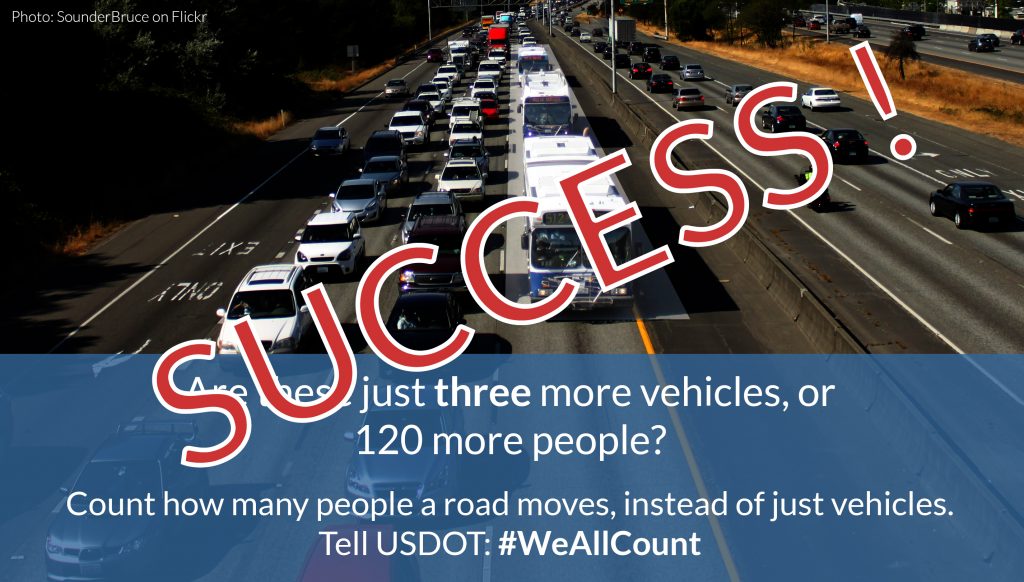
In response to comments from T4A and others, the final rule adds two new measures – a carbon dioxide emissions measure and a multimodal measure. To better reflect the number of people traveling on the system, two of the other proposed measures were modified so they are based on person-travel instead of vehicle travel.

In addition, the faulty measures for percentage of the interstate freight mileage uncongested and Peak Hour Travel Time Reliability (PHTTR) included in the NPRM were both deleted from the final rule. The final rule also simplifies the required data processing and calculation of metrics.

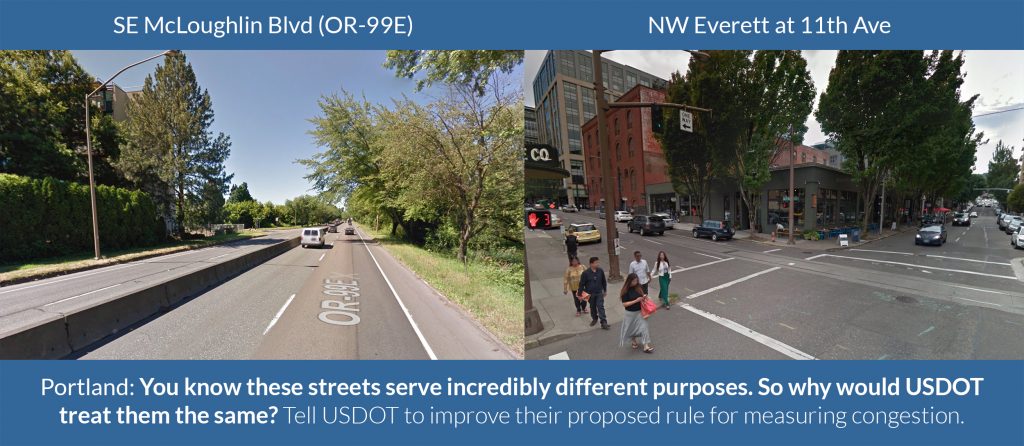
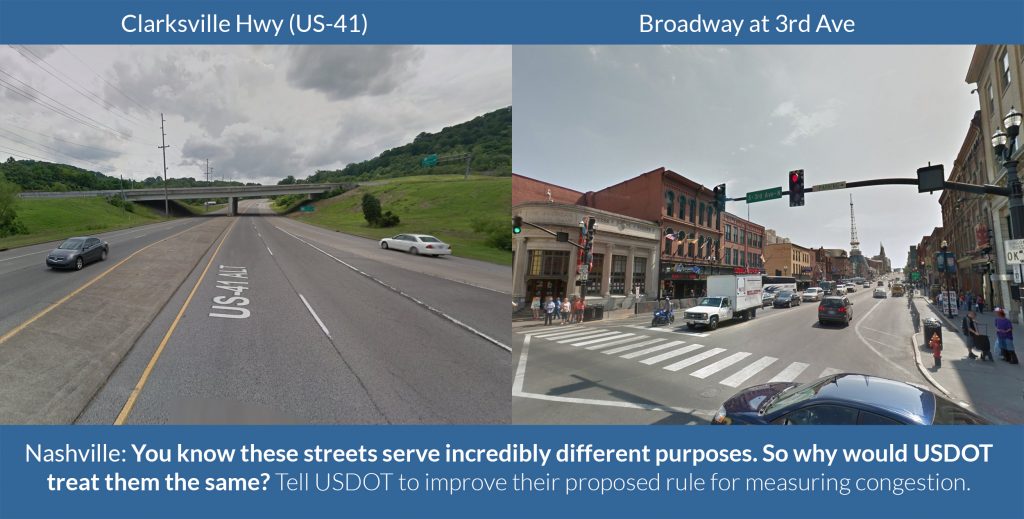
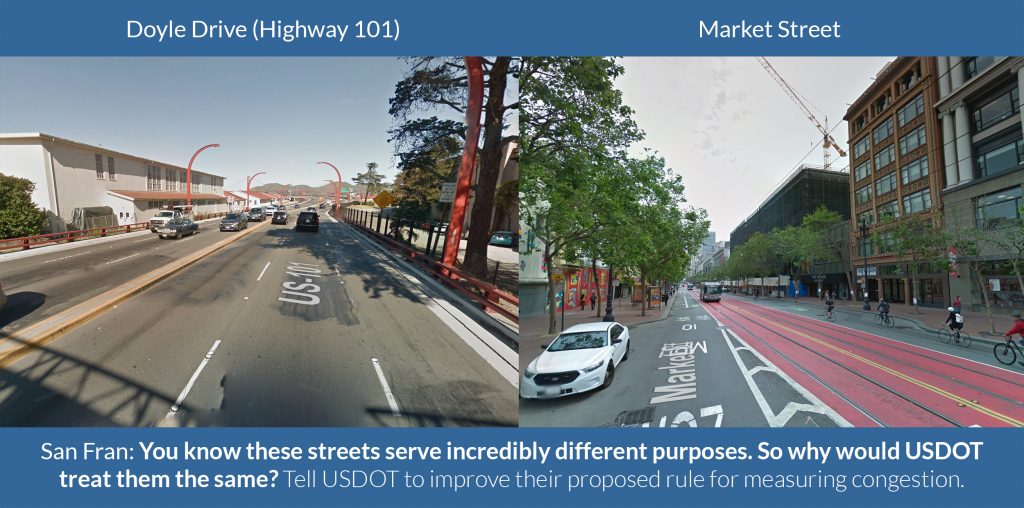
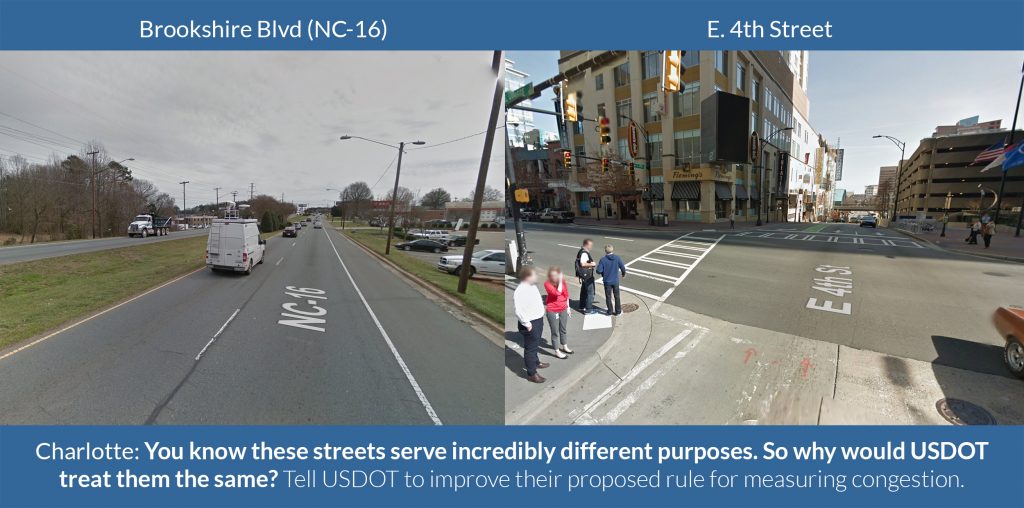
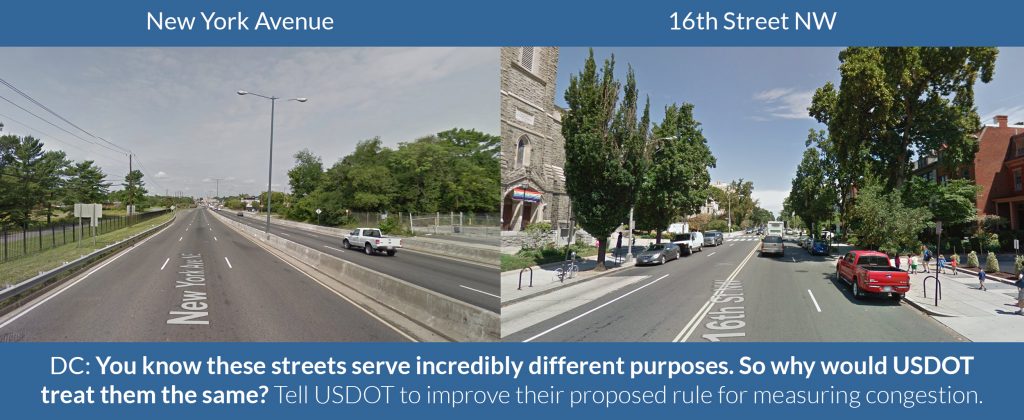
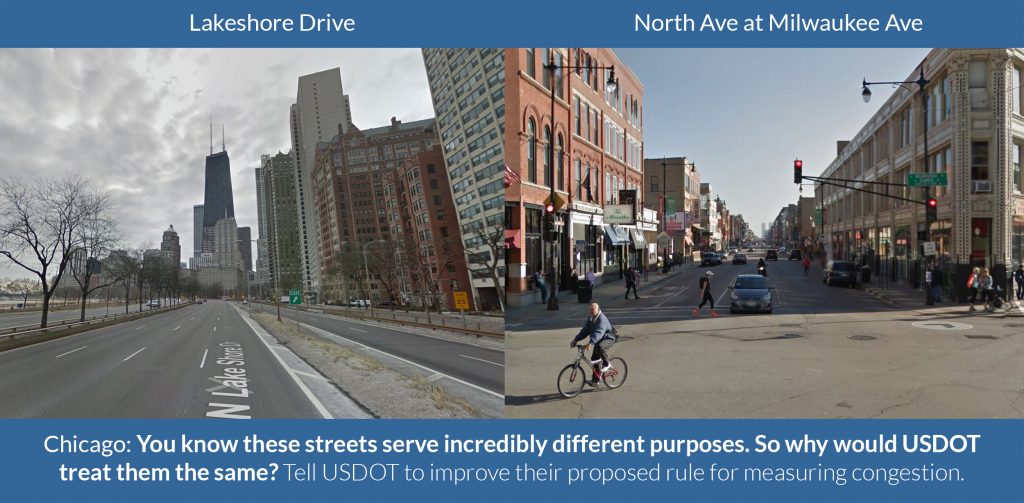
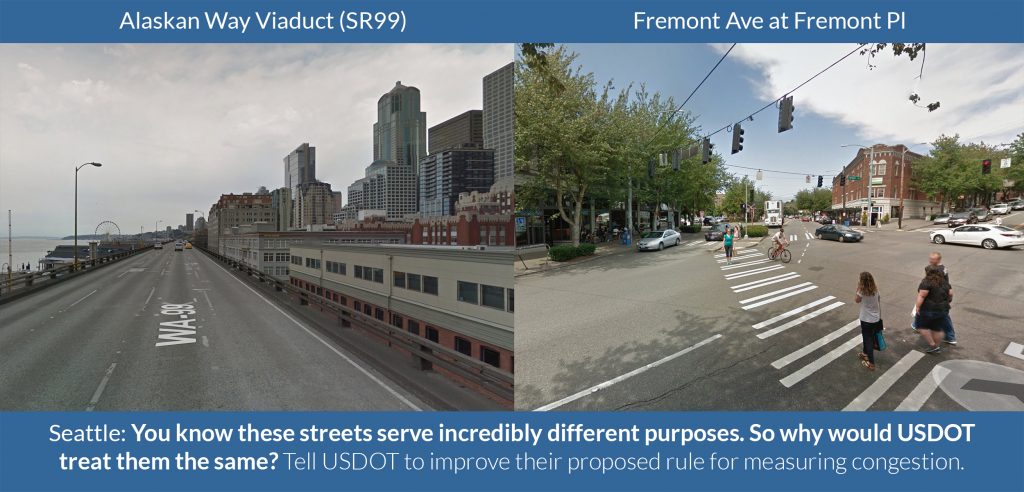
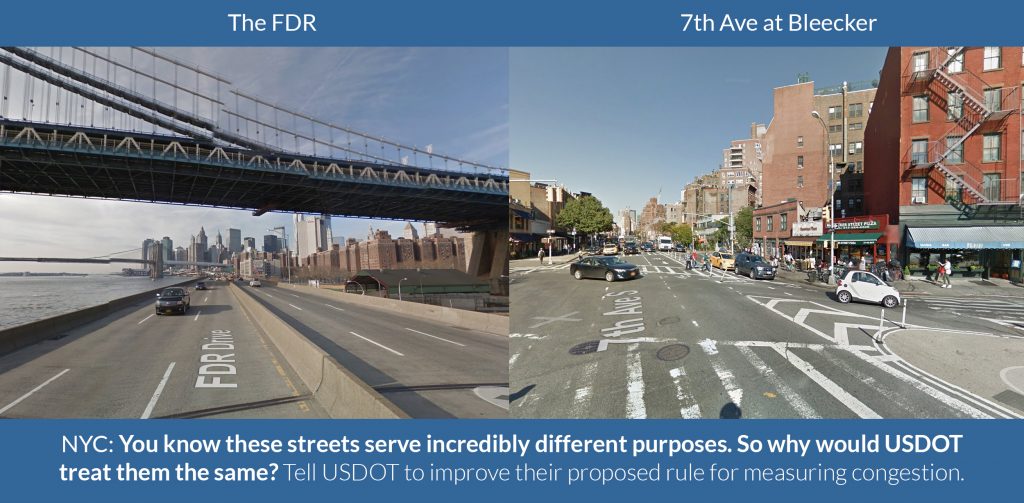
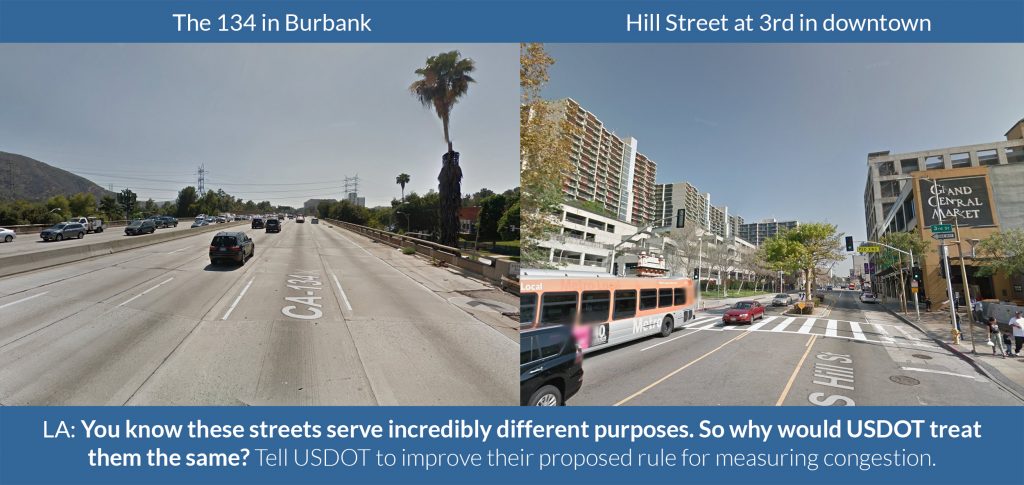
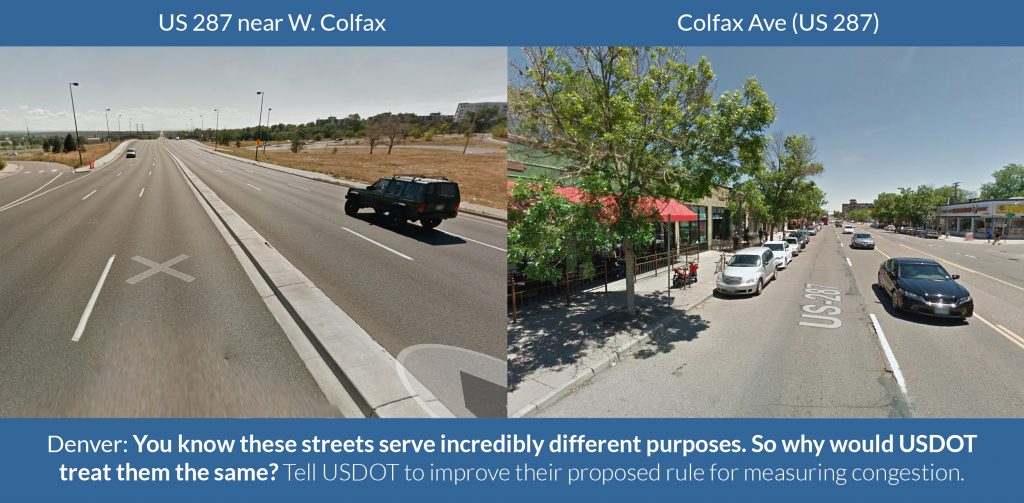
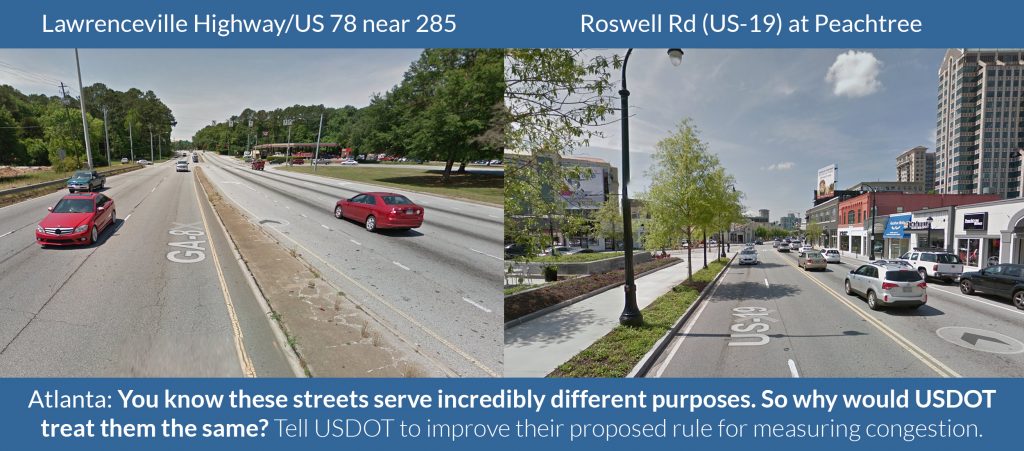
While the final rule is much improved, changes to the speed thresholds for the congestion measure may have some negative impacts on signalized downtown roads with low speed limits.

Background

On the same day that FHWA released this final rule on system performance and congestion, FHWA also released its final rule establishing regulations to assess pavement and bridge conditions. (See T4America summary here). These final rules are the last of several regulations issued to implement the performance management framework established by the recent national transportation authorizations bills, known as MAP-21 and the FAST Act.

In addition to these two rules, FHWA published rules on safety performance measures and the integration of performance management into the Highway Safety Improvement Program (HSIP) in March 2016 and published a rule on asset management plans in October 2016. In May 2016, both FHWA and FTA published a joint rule implementing changes to the planning process.

Together these rulemakings establish regulations for state DOTs and MPOs to evaluate and report on surface transportation performance across the nation.

Final measures

In the draft rule, 7 of the 8 proposed measures were based on vehicle travel time data. Now, only four of the final measures are derived from vehicle travel times, three of which are weighted to reflect all people traveling on the system.

The seven measures established in the final rule include:

  • Three measures of system performance
    • Percentage of reliable person-miles traveled on the Interstate
    • Percentage of reliable person-miles traveled on the non-Interstate NHS
    • Percent change in CO2 emissions from 2017, generated by on-road mobile sources on the NHS
  • A measure for freight movement on the Interstate system
    • Average truck travel time reliability index (TTTR)
  • Three measures to assess the CMAQ program, including two measures on traffic congestion
    • Total emission reductions for applicable criteria pollutants, for non-attainment and maintenance areas
    • Annual hours of peak hour excessive delay per capita
    • Percent of non-single occupancy vehicle (SOV) travel, including travel avoided by telecommuting

Timeline and enforcement

State DOTs will establish their first statewide targets one year after the effective date of this rule, February 17, 2017. MPOs have up to 180 days after state DOTs establish their targets to establish their own targets.

State DOTs must establish both 2-year and 4-year targets. The MPOs are subject only to a 4-year target-setting requirement. MPOs must either: (a) agree to plan and program projects so that the projects contribute toward the accomplishment of the relevant state DOT target for the performance measure, or (b) commit to a quantifiable 4-year target for the performance measure for the MPA. FHWA will assess every 2 years to determine if a state DOT has made significant progress toward achieving their targets.

If States/MPOs fail to meet their targets after 4 years, they have to set new ones for the next 2- and 4-year performance period. If they fail again, there is no real consequence.

Under the new administration, the White House ordered a freeze on the regulatory process. For regulations that have been finished but have not taken effect, the order calls for temporarily postponing their effective date for 60 days or possibly longer. This order could delay the effective date of this rule.

System performance

In the NPRM, FHWA proposed calculating performance on the interstate and non-interstate system by using two metrics: (1) Level of travel time reliability (LOTTR), and (2) Peak hour travel time ratio (PHTTR).

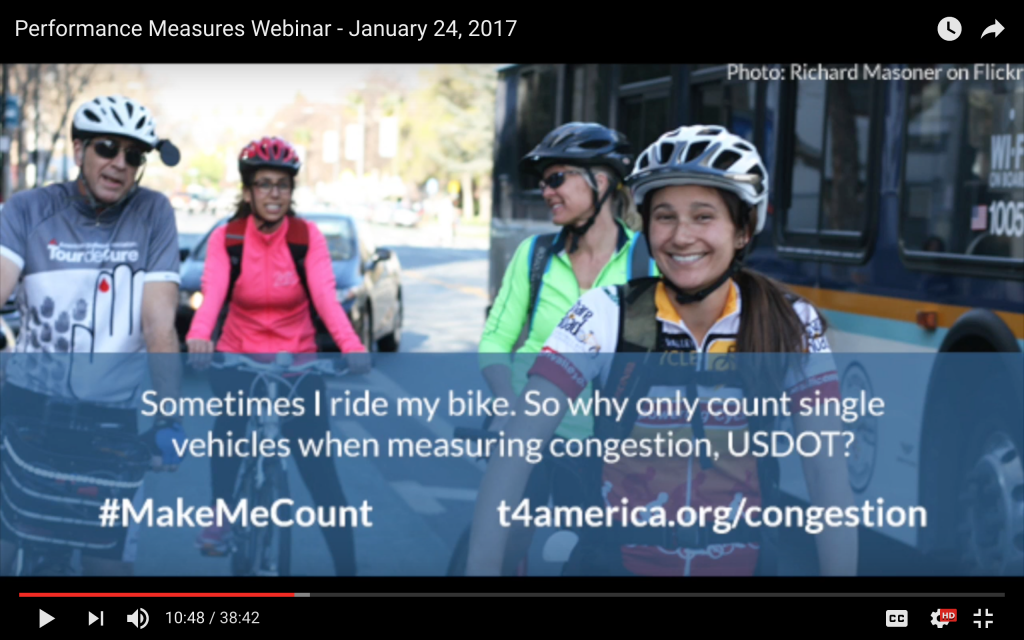
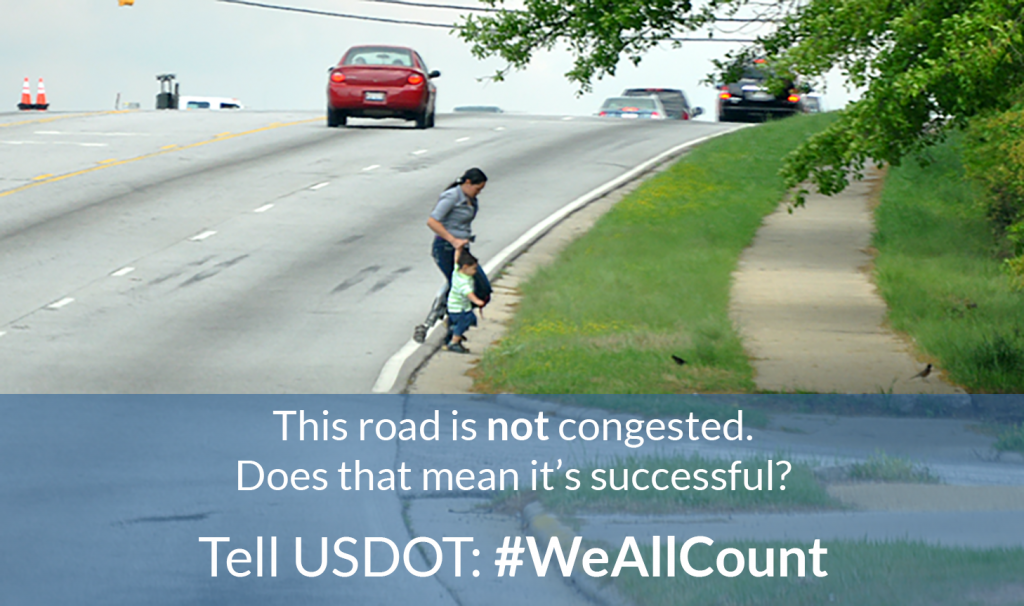
T4America and others expressed concern about the PHTTR measure as a poor measure of performance because it assumes the goal is for roadways to operate in free flow conditions at all times of day – a prohibitively expensive and infeasible goal that can undermine local economic development and multimodal travel. There was already another congestion measure under the CMAQ program and a different reliability measure looking at how consistent travel was from one day to the next. Due to this, we recommended that this measure be vacated, which FHWA did in the final rule..

The final rule also changes the weighting of the travel time reliability measures from system miles to person-miles traveled using overall occupancy factors from national surveys. This prioritizes roadways that move more people through carpooling and transit over roads that only move SOVs.

New CO2 emissions measure

The final rule adds a new emissions measure – percent change in tailpipe CO2 emissions on the NHS from calendar year 2017. This measure applies to the NHS in all states and metropolitan planning areas. All state DOTs and MPOs that have NHS mileage in their state geographic boundaries and MPAs will be required to establish targets and report on progress.

State DOTs will calculate the measure by multiplying motor fuel sales volumes by the FHWA-supplied emissions factors of CO2 per gallon of fuel and percentage VMT on the NHS.

Freight movement on the interstate

The draft rule proposed two measures of freight movement on the interstate: (1) Truck Travel Time Reliability (TTTR), and (2) percent of the interstate system mileage uncongested. T4A and our partners were concerned that the TTTR measure would prioritize freight movement over the movement of people. In response, FHWA removed the TTTR measure from the final rule.

FHWA also changed the form of this measure from one based on the percent of the system providing for reliable travel to an overall average truck reliability index for the Interstate. This change removes the hard threshold in the definition of reliable travel for trucks and recognizes incremental improvements that could be made to improve reliability.

CMAQ program

Three measures are established for the CMAQ program, including total emissions reduction measure and two traffic congestion measures.

Traffic congestion

The NPRM proposed measuring traffic congestion under the CMAQ program by looking at annual hours of excessive delay per capita. As mentioned above, a separate peak hour travel time reliability (PHTTR) measure was also proposed for measuring system performance on the interstate and non-interstate systems. The PHTTR measured percent of the interstate system in large urbanized areas over 1 million in population where peak hour travel times meet expectations. These two measures merge in the final rule creating the Peak Hour Excessive Delay (PHED) measure.

In response to comments, a new multimodal measure – percent of non-SOV travel – was also added in the final rule.

APPLICABILITY

Both the PHED and the multimodal measure adhere to the same applicability requirements. As proposed, the CMAQ congestion measure applied to areas in nonattainment with a population over 1 million. The final rule expands applicability to also include areas with a population over 200,000.

The applicability of both CMAQ traffic congestion measures will be phased in, beginning with urbanized areas with a population over 1 million that contain any part of nonattainment or maintenance areas for one or more air pollutants in the first performance period (2018). It will be expanded to urbanized areas with a population over 200,000 that contain any part of nonattainment or maintenance areas for one or more air pollutants beginning in the second performance period (2022).

The final rule also moves up the date of measure applicability determination to one year earlier than initially proposed. FHWA will determine measure applicability based on the most recent available data on October 1, 2017.

PHED – SPEED THRESHOLD

As proposed in the NPRM, the traffic congestion measure would have established a 35 mph threshold for freeways and a 15 mph threshold for other NHS roadways. In the final rule, FHWA responded to concerns about these static speed thresholds by setting the excessive delay threshold to 60 percent of posted speed limit, with a minimum limit of 20 mph. This may be a slight improvement for measuring excessive delay for expressways, but this same threshold will also apply to non-expressway facilities. Particularly when applied to signalize urban roads marked at 25mph, vehicle speeds might fall below 60% of the speed limit even during free-flow conditions.

In the final rule, FHWA encourages state DOTs and MPOs to share their strategies using volume limiting techniques to address concern when extremely slow speeds exist. FHWA plans to make provisions within HPMS to capture posted speed limit data by adding a field that can be populated for the full extent of the NHS.

PHED – PEOPLE-CENTRIC CHANGES

FHWA agreed with comments that the measure should represent the cumulative delay of all people using the NHS and not just the delay experienced by vehicles. As a result, the PHED measure requires the use of average vehicle occupancy (AVO) factors for cars, buses, and trucks and hourly traffic volumes to calculate person-hours of excessive delay. To support this approach, FHWA will establish AVO factors for applicable urbanized areas using the National Transit Database for buses and national surveys, such as the American Community Survey, for cars. State DOTs and MPOs have the flexibility of choosing to use these AVO factors or substituting more specific AVO data that they may have.

In response to comments, including comments from T4A, the final rule requires the use of annual population estimates using U.S. Census estimates (i.e. most recent ACS 5-year estimates) as opposed to the decennial census populations to normalize the excessive delay measure. The most recent annual population estimate will be used each time the PHED per capita measure is calculated.

PERCENT OF NON-SOV TRAVEL 

This measure includes modes that are in the ACS Journey to Work data, which includes travel avoided by teleworking. State DOTs and MPOs have three options for calculating modal share:

  1. use the ACS Journey to Work mode share data
  2. use locally specific surveys, or
  3. use volume counts for each mode.

FHWA encourages state DOTs and MPOs to report data not currently available in national sources, such as pedestrian or bicycle counts. For state DOTs and MPOs that chose to use count data, FHWA encourages this data to be voluntarily submitted to FHWA via national sources or databases (such as TMAS, NTD, or GTFS-RT).

On-road mobile source emissions

APPLICABILITY

While FHWA acknowledged T4A’s comments, FHWA did not agree that this emissions measure should apply more broadly to include all states or regions that receive CMAQ funds, or to consider all capital and operational opportunities to reduce emissions, not just those that receive CMAQ funding.

The measure is applicable to all states and MPOs with projects financed with funds from the CMAQ program, apportioned to state DOTs for areas designated as non-attainment or maintenance for ozone, carbon monoxide, or particulate matter. FHWA clarified in the final rule that the baseline non-attainment and maintenance area designations should be based on area status as of October 1, 2017.

FHWA narrowed the definition of ‘maintenance area’ to exclude any areas that have completed their 20-year maintenance plan for an applicable pollutant. States and MPOs can also request exclusion from this requirement at the midpoint of the performance period, if their designation changes (i.e. the 20-year maintenance plan is achieved, or the area is no longer designated as non-attainment or maintenance).

While state DOTs and MPOs can still use CMAQ dollars to fund projects where is it not possible or easy to quantify the emissions benefit, these projects will not be accounted for in this performance measure.

METRIC & TARGET ADJUSTMENT

The final rule removes the conversion from kilograms per day emissions data to tons per year data. The final rule calculates total emission reduction as cumulative reductions in emissions over 2 and 4 federal fiscal years.

As in the proposed rule, the final rule allows states or MPOs that believe they would not be able to meet a target due to a change in models to adjust the target at the performance period’s mid-point or explain in their final performance report why they were unable to meet their targets due to model-based emissions estimate.

TIMELINE

Consistent with CMAQ Program Guidance, state DOTs must enter their CMAQ project information for the previous fiscal year into the CMAQ Public Access System by the March 1 deadline. In this rule, FHWA adds a new July 1 deadline, for when all information must be in the CMAQ Public Access System. This due date will apply on July 1 after the final rule is effective.

States and MPOs must use projects in the 4 years prior to the first performance year as a basis for establishing a target for the first performance period. The projects entered into the CMAQ Public Access System during the 2-year and 4-year performance period will be taken as is to calculate the measure.

Additional measures

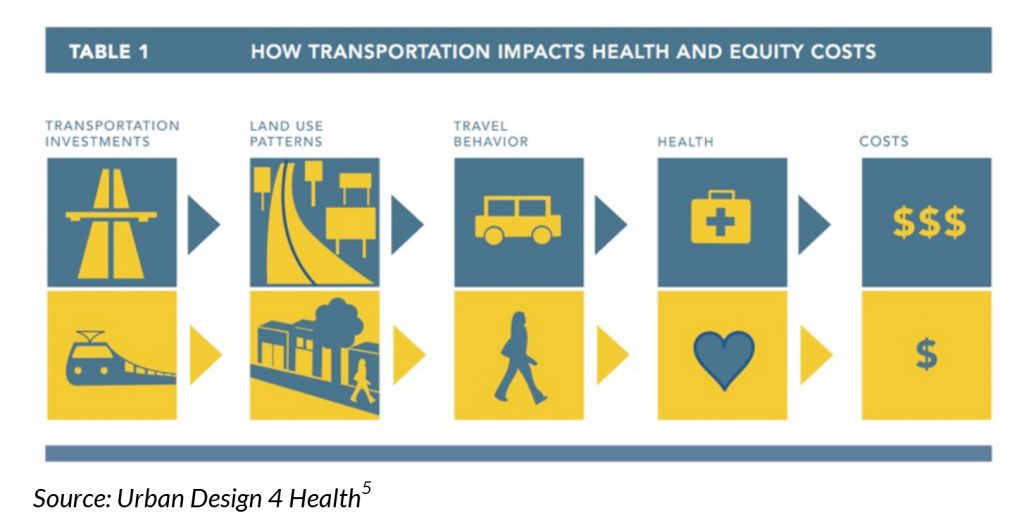
FHWA notes that state DOTs and MPOs may voluntarily report additional measures beyond their baseline requirement. Additional measures, or variations, could include metrics for per capita emissions, VMT-based estimates, or other useful indicators. Some of the priority outcomes not addressed by the Congressionally mandated measures promulgated by this rule are jobs access, freight movement off the Interstate, public health, stormwater runoff, and household transportation cost.

Review & analysis

FHWA will review this rule after the first performance period to assess effectiveness of the requirements and identify any necessary changes. FHWA also plans to revisit the reliability and congestion measures after the completion of its multimodal research study in Fall 2018.

USDOT made significant improvements in this final rule. However, the ability to set negative targets (e.g., a target of more fatalities) remains an area of concern as does the lack of real accountability for failing to meet any of the self-set targets. This is a flaw in the underlying legislation and not anything FHWA could have addressed in the rulemaking.

Furthermore, the progress made under this rule could be rolled back, if the new Congress overturns this rule under the Congressional Review Act (CRA). At a minimum, the effective date of this rule may be delayed for 60 days. T4America continues to monitor this rule and will provide updates as necessary.

NOTICE OF FINAL RULEMAKING: Assessing pavement and bridge condition for the national highway performance program

DATE EFFECTIVE: FEBRUARY 17, 2017

[FEDERAL REGISTER NOTICE, HERE]

Overview

This rule establishes measures for state departments of transportation (DOTs) to evaluate bridge and pavement condition. These measures are intended to direct states to spend federal-aid funds from the National Highway Performance Program (NHPP) to achieve the performance targets in states’ asset management plans.

Background

On the same day that FHWA released this final rule regarding pavement and bridge conditions, FHWA also released its final rule establishing regulations to assess performance of the NHS and Interstate System, freight movement on the Interstate System, and congestion and mobile source emissions. (See T4America summary here). These final rules are the last of several regulations issued to implement the performance management framework established by the recent national transportation authorizations bills, known as MAP-21 and the FAST Act.

In addition to these two rules, FHWA published rules on safety performance measures and the integration of performance management into the Highway Safety Improvement Program (HSIP) in March 2016 and published a rule on asset management plans in October 2016. In May 2016, both FHWA and FTA published a joint rule implementing changes to the planning process.

Together these rulemakings establish regulations for state DOTs and MPOs to evaluate and report on surface transportation performance across the nation.

Summary of Requirements

State DOTs and MPOs must establish targets for each of the following performance measures:

  • Percentage of pavements on the Interstate System in good condition;
  • Percentage of pavements on the Interstate System in poor condition;
  • Percentage of pavements on the NHS (excluding the Interstate System) in good condition;
  • Percentage of pavements on the NHS (excluding the Interstate System) in poor condition;
  • Percentage of NHS bridges classified as in good condition; and
  • Percentage of NHS bridges classified as in poor condition.

“Good” and “poor” pavement ratings are based on quantitative measures of roughness, cracking, rutting and misalignment of pavement surfaces. Since 2010, most state DOTs have reported roughness, cracking, rutting, and faulting data annually to FHWA through the Highway Performance Monitoring System. Ratings for bridge conditions are based on measures submitted to the National Bridge Inventory (NBI). State DOTs have been required to submit NBI reports to FHWA since 1978. Bridge ratings are based on the lowest component (e.g. deck, superstructure, substructure) rating.

Process

State DOTs must set 2- and 4-year targets for a 4-year performance period for the condition of highways and bridges. State DOTs will establish their first statewide targets in 2018. Each state DOT will submit its established targets in a baseline report at the beginning of the performance period and report progress at the midpoint and end of the performance period. DOTs will be allowed to adjust their 4-year target at the midpoint of the performance period.

MPOs will establish targets by either supporting a state DOT’s statewide target, or defining a target unique to the metropolitan area each time state DOTs establish a target. The MPOs have up to 180 days after state DOTs establish their pavement and bridge condition targets to establish their own targets. MPOs are not required to provide separate reporting to FHWA. However, state DOTs and MPOs must develop a process for coordinating their targets, which will be included in the MPOs’ metropolitan planning agreements or documented in another, mutually determined manner.

Targets and measurement apply to all highways and bridges on the NHS, regardless of ownership. MPO targets will apply to the extent of the metropolitan planning area; state targets apply to the entire state.

State DOTs and MPOs set their own targets; there is no provision in statute for FHWA to review or approve the targets these agencies set.

State DOTs may set additional targets for portions (e.g. urbanized or non-urbanized areas) of the state.

State DOTs must submit the following reports to FHWA:

  • Baseline performance reports, due October 1, 2018 and every four years thereafter, will include baseline conditions and 2- and 4-year performance targets.
  • Mid performance period progress reports must be submitted three years into the four-year performance period (to address the first two years of the period). This report will include the actual condition, progress toward performance targets, target adjustments, any extenuating circumstances that prevent the state from achieving its targets, and a description of the actions to be taken to meet the targets.
  • Full performance period progress reports, due one year following the end of the referenced period, will include actual condition, four-year progress toward targets, any extenuating circumstances that prevent the state from achieving its targets, and a description of the actions to be taken to meet the targets

The report timeline is summarized in the Figure 1 below.

MPOs must report their targets, baseline conditions, and progress toward targets to their states’ DOTs in a mutually agreed upon manner.

FHWA will determine states’ progress toward their targets after receipt of the mid- and full-performance period progress reports. FHWA will determine that a State DOT has made significant progress toward the achievement of each 2-year or 4-year NHPP target if either:

  • The actual condition/performance level is better than the baseline condition/performance; or
  • The actual condition/performance level is equal to or better than the established target.

State DOTs that fail to meet or make significant progress toward meeting pavement and bridge condition performance targets in a biennial performance reporting period will be required to document the actions they will undertake to achieve their targets in their next biennial performance report.

Additionally, this rule sets minimum standards for Interstate highway pavement condition and bridge condition. These thresholds are not more than 5 percent of Interstate pavement in poor condition and not more than 10 percent of bridge deck area rated structurally deficient. FHWA will annually determine if these conditions are met.

If a minimum pavement condition on the Interstate is not met the state DOT must set aside an amount equal to the state’s 2009 federal apportionment for the pre-MAP-21 Interstate Maintenance program. However, in some cases this amount of funding may be less than the state is already spending on Interstate maintenance and less that is necessary to fix the problem.

If the minimum bridge condition is found to have not been met for the previous three year period the state DOT must set aside and amount equal to the state’s 2009 federal apportionment for the pre-MAP-21 bridge maintenance program. This set-aside requirement remains in effect for each subsequent year until less than 10 percent of the total deck area of bridges in the state on the NHS is classified as structurally deficient. However, in some cases this amount of funding may be less than the state is already spending on bridge repairs and less that is necessary to fix the problem.

Changes from the proposed rule

Two changes were made to comport with new statutory provisions from the FAST Act.

The proposed rule required a state DOT to document how it would meet its performance targets if it failed to meet these targets over two, consecutive biennial reports. The final rule requires a report on corrective action if a state DOT does not make significant progress in a single biennial performance report.

Similarly, under the final rule, FHWA will impose a requirement for additional repair spending if the state’s Interstate pavement condition has fallen below the minimum condition level for the most recent year (instead of most recent 2 years).

The final rule makes several technical adjustments to the way particular measures are calculated and revises certain thresholds.

T4America critiqued the provision of this rule that allows state DOTs to adjust their 4-year performance targets when they submit their two-year, mid-period progress report. Especially considering that states already set their own targets, allowing states to change their targets halfway through the performance period when they see their results lagging undermines the accountability of performance management system. However, several DOTs commented requesting more flexibility to revise their targets. In the final rule FHWA did not change the provision and allows for state DOTs to reset their targets in the mid-period report. The final rule additionally adds a provision that state DOTs must coordinate with MPOs before adjusting performance targets.

T4America also urged changes to the rule to assign state DOTs and MPOs equal responsibilities in setting targets. This final rule, however, makes requirements primarily of states while encouraging coordination with MPOs.

Review

FHWA will review this rule after the first performance period to assess the effectiveness of the requirements to identify any necessary changes.

Unpacking the final suite of new USDOT performance measures [video]

The new requirements released last week by USDOT for how states and metro areas will have to measure traffic congestion were just part of a larger package of all-new performance measures. Catch up on what you need to know about them with our detailed webinar unpacking all of it.

Many thanks to our Beth Osborne for sharing her knowledge and wisdom about performance measures with us on this helpful session. FHWA was unable to participate due to the regulatory freeze now in place preventing federal agencies from communicating further about any new regulations in process or not yet completely finalized, but we were able to roll on ahead. (2:20)

The 2012 transportation law (MAP-21) required transportation agencies to begin using a new system of performance measures to govern how federal dollars are spent. USDOT’s final rule for measuring traffic congestion was just one part of a much larger package of new performance measures, including measures for safety, the state of repair, congestion, air emissions and other aspects of our transportation system. (4:00)

On this webinar, we walked through the last of three final rules that cover road, bridge and pavement condition, and overall system performance. We discussed what’s missing in the new measures (8:00), what changes we asked for along the way (10:30), what comprises the final package of rules (15:20), the changes made to the final package (18:05), the dates that states and metro areas will need to be aware of over the next year (18:50), some other helpful resources from T4America and others (20:20) and answered a handful of really smart questions from those who participated (24:00).

More about performance measures

Maryland’s governor is fighting a more objective process for choosing transportation projects

While other states and regions across the country are using new tools to evaluate potential transportation projects and pick the ones that offer the best return for taxpayer money, Maryland Governor Hogan and his administration are staunchly opposing similar new policies that add accountability and transparency to that process.

Many Americans find the byzantine nature of transportation decisions confusing, making them less willing to hand over more of their hard-earned tax dollars to increase investments in transportation — but who can blame them?

The public wants to know the answers to questions like: “Will these dollars give us better, safe, reliable, affordable access to necessities like jobs, education, health care, and groceries?” Measuring what transportation dollars are buying, in a clear way that matters to the public, is critical for restoring this trust — as well as for getting the most bang for the buck.

This was why Maryland legislators in 2016 crafted a new law to measure and score transportation projects based on state goals, helping to program (i.e. spend) scarce transportation dollars more objectively. The legislation in question requires the state department of transportation to objectively evaluate potential projects based on their impacts in categories like economic development, safety, community vitality, and accessibility.

The Governor vetoed the bill, but the legislature overrode that veto and passed it in 2016. And now, as Maryland starts their 2017 legislative session, Governor Larry Hogan (R) has declared his number one legislative priority to be the repeal of this legislation. Last week a repeal bill was introduced.

Marylanders: Tell your state reps to defend transparency and accountability in transportation projects.

The governor is demanding a repeal of the law that created this new objective scoring system so he can preserve the opaque, politically driven process where projects are picked based on horse trades and political influence, not on need or expected benefits.

TAKE ACTION

In attacking what he calls the “road kill bill” and warning of “catastrophic” consequences, Gov. Hogan has exaggerated and incorrectly stated the provisions of the law. While the Governor said the law would “absolutely be responsible for the elimination of nearly all of the most important transportation priorities in every single jurisdiction all across the state,” the law explicitly gives the administration the power to fund any necessary project.

Del. Brooke Lierman (D-Baltimore, pictured below), who championed the project scoring legislation last year, was astonished by the Governor’s sweeping opposition.“It’s just a score, and that shows to us, the taxpayers, how we’re spending our money in a transparent way,” she told the Baltimore Sun. “I don’t know why the governor is so opposed to transparency in transportation funding.”

Delegate Brooke Lierman, right, one of the sponsors of the original legislation, explaining the mechanics of the bill to others at our Capital Ideas conference.

In recent years, several other states under Democrat or Republican control alike, have adopted similar scoring systems to clearly evaluate projects and communicate to taxpayers that the state is making sound investments. For example, in the past year Virginia and Massachusetts have each employed new project scores to build their state transportation plans.

Yet rather than follow these well-functioning models, the administration released a clumsy set of measures to implement the legislation.

Virginia’s DOT went all-in on the new process their legislature created, producing a new website and a 90-page step-by step guide to their process. In contrast, the Maryland DOT’s regulations run just a page and a half and offer no explanation for the basis for scores and weights. While Gov. Hogan has erroneously claimed that the new law would require that state to cancel dozens of planned projects, under the law the scoring process is only advisory — it just provides a new way for lawmakers and citizens alike to see which projects are being advanced and compare the relative merits of each.

Maryland’s taxpayers deserve transparent and objective scores that would let them understand state spending and need. Instead they have gotten a cynical, straw man argument, in which the governor has painted a sensible, good-governance reform as the “road kill bill.”

The Maryland General Assembly should not repeal this important new policy and the administration should use the flexibility in the law to develop a scoring process that matches the state’s need. We’ll be keeping our eyes on the developments down the road in Annapolis.

Learn more about USDOT’s final congestion rule and the rest of the final performance measures [webinar]

The new requirements released last week by USDOT for how states and metro areas will have to measure traffic congestion were just part of a larger package of new performance measures. Join us next week to unpack the congestion rule and the rest of the suite of new measures. 

Updated 1/26/17: Thanks to everyone who was able to join us on the webinar. Here’s the archived recording if you missed it or want to revisit. -Ed.

The 2012 transportation law (MAP-21) required transportation agencies to begin using a new system of performance measures to govern how federal dollars are spent. And it was indeed big news last week when USDOT — responding to thousands of your comments we submitted — backed away from most of the outdated measures of traffic congestion that were proposed. But this was just one part of a much larger package of new performance measures and with last week’s release, USDOT has now finalized all of the new measures for safety, the state of repair, congestion, air emissions and other aspects of our transportation system.

Join us next Tuesday on January 24th at 10:00 a.m. EST as we walk through the second two (of three total) final rules that cover road, bridge and pavement condition, and overall system performance (the latter is what includes the traffic congestion measures.)

T4America experts will be on hand to unpack these final rules, discuss what states and metro areas need to know about this crucial first step toward more performance-based and data-driven decision-making when it comes to transportation investments.

We’ll also be announcing a new opportunity for technical assistance on performance measures, as well as some survey results on the state of the practice at metropolitan planning organizations across the country. Be the first to hear about both.

More about performance measures

How do we justify transportation expenditures? To many people, the perception is that project decisions are made in a murky, mysterious process, or, even worse, through a political process where only the projects with the most connections get funded. Further, it is not clear to the average person what all the spending gets them. With public confidence in government at low levels, it’s more important than ever to quantify the public benefits of transportation investment and let voters know what their money is going to buy — especially when attempts are being made to raise new money for transportation to fill the gap.

Transitioning to a more performance-based system of transportation investment was one of the key reforms of MAP-21 and these newly finalized measures could represent the beginning of a sea change in how funding decisions are made and our transportation system performs.

Read our 2015 report to learn more about performance measures

Trickle-up performance measures

While working to enhance its performance-based planning framework, Metro, the metropolitan planning organization for the Portland, Oregon region, can draw from the experience of local jurisdictions within its own region — bringing unanticipated benefits through “trickle-up” learning.

This is the second of a series of posts on the issues and challenges of performance-based planning in the Portland region.

When Metro kicked off the process of developing its long-range transportation plan governing the next ten years of spending it was clear that performance measures would be a focus, both because of the new requirements created by the 2012 federal transportation law (MAP-21) and a growing public interest in making smarter choices about transportation investments.

Metro convened a workgroup of stakeholders to provide guidance on performance measures. To get things started, Metro hosted a workshop in January of 2016, which included presentations on the performance measure work of two local jurisdictions: City of Portland and Washington County.

The experience of each of these jurisdictions offered up lessons that have informed the workgroup’s efforts to identify performance measures and develop a framework to inform Metro’s next long-range plan.

As part of its transportation plan, Portland has used performance-based criteria as a way to prioritize investment, and has been careful to ensure that those criteria reflect the city’s values. Criteria were derived from numerous sources that incorporate citizen input. The seven criteria are “cross-modal”; they evaluate various concerns and support a balance among modes.

Portland’s evaluation criteria

In 2014, Washington County published Multimodal Performance Measures and Standards, prepared by Kittleson & Associates. The report strives to identify performance measures that are relevant to non-automobile modes of travel. While the suite of performance measures identified in this study are useful fodder for Metro’s workgroup, some of the greatest value is the lessons learned in the process, and the opportunity to adapt some of the study’s approaches to evaluating the performance measures themselves.

While the study lists five lessons learned, the first two are most of interest:

  • Different measures are best for different planning applications.
  • Different measures may be needed to assess the same goal.

These two lessons, along with the use of matrices to visually compare proposed measures, are playing the biggest role in informing the work of Metro’s performance measures workgroup.

Performance Measures, Graphic, Transportation Planning, Grid, Chart, Corridor Planning, Development, Crash, Pedestrian, Mode Share, Travel Time, Portland, Oregon

Washington County, Oregon developed matrices to identify how proposed performance measures could be applied.

Taken together, these lessons led the workgroup to ask for matrices to illustrate the role of performance measures under consideration for Metro’s long-range plan. Metro is using two types of matrices to answer two questions. First, what is the relationship between the proposed performance measures and the region’s goals. Second, at what stage of planning can each performance measure be applied?

For example, Metro is using vehicle miles traveled as a performance measure in several stages of planning. It’s important to understand how this measure relates to several of the regions’ goals including efficiency of the transportation system, reducing household transportation costs, reducing greenhouse gas emissions and improving safety. A matrix comparing proposed measures with the region’s goals helps workgroup members to visualize those relationships and identify redundant measures.

RTP, Evaluation System, Matrix, Graphic, Chart, Portland, Oregon, Measures, Evaluation, Travel, Region, Efficient, RTP Goals

Metro staff developed a matrix that communicates how each proposed performance measure addresses the region’s goals.

Likewise developing a matrix to look at how measures can be applied is also helpful. For example, crash rate is something that cannot be predicted in Metro’s travel model. So while safety is a major goal for most transportation agencies, a proxy may be needed to inform selection of a preferred scenario or project prioritization. Metro is considering a measure they are calling “VMT exposure” which is the amount of traffic on surface streets. While this isn’t an exact measure of safety by any means, it is strongly correlated and can be easily forecast in a transportation model. Crash rate will be used as a monitoring measure to determine if the region’s investment strategy is working to reduce crashes in hindsight.

Besides the ideas on how to evaluate performance measures, there is an additional benefit to learning from local jurisdictions: consistency between local measures and regional measures. Getting everyone on the same page to coordinate regional investments helps ensure that all dollars are going to accomplish goals that are shared across the region. Regional performance measures that reflect those bubbling up from local jurisdictions will help local jurisdictions like Portland and Washington County that are already ahead of the game develop local plans that reflect their own local values while still being consistent with the regional plan.

USDOT rewrites congestion rule in response to outpouring of feedback

At long last, USDOT has finalized new requirements for how states and metro areas will have to measure traffic congestion and in the final rule — responding to the outpouring of comments they received — they backed away from most of the outdated measures of congestion that were proposed.

Updated 1/26/17: See the bottom of this post for a video of our webinar explaining this rule and the rest of the final package of performance measures. – Ed.

Wait, what congestion measures? First, let’s take a moment to catch up on what’s happening here, since it’s been months since this was in the news.

For two years, USDOT has been working to establish a new system of performance measures to govern how federal dollars are spent and hold states and metro areas accountable for making progress on important goals, including how states and cities would have to measure (and address) traffic congestion. (Why does how we measure congestion matter? Read some background here.)

As first written, USDOT’s proposed measures would, as we said back in early 2016, “induce sprawl, harm the economic potential of our main streets by treating them like highways, punish cities investing in public transportation, completely ignore people walking, biking, carpooling or telecommuting, and push local communities of all sizes to waste billions of dollars in vain attempts to build their way out of congestion.”

So back in August 2016, we delivered letters from nearly 5,000 individuals and 150 organizations — including dozens of local chambers of commerce and elected officials — opposing USDOT’s flawed proposal and urging them to rethink their approach.

Here’s what 5,000 letters looks like next to a terrific book about Complete Streets for scale purposes since USDOT allows digital submissions.

We’ll be reviewing this newly-released 300-plus page measure in closer detail in the days to come, but our first take upon reviewing it is that FHWA heard the extensive feedback on a complex rule and responded positively to most of the requests that we made.

“Tens of thousands of commenters, through campaigns from T4America, the American Heart Association, and others, raised concerns about the vehicle-focused nature of the eight measures proposed in the NPRM,” FHWA wrote in their comments accompanying the new rule.

The changes are complicated and difficult to quickly enumerate, but four changes are worth highlighting quickly here.

First, we complained that FHWA’s singular focus on delay “paints an incredibly one-dimensional picture of congestion. Focusing on average delay by simply measuring the difference between rush hour speeds compared to free-flow 3 a.m. traffic fails to count everyone else commuting by other modes, rewards places with fast travel speeds at the expense of places with shorter commutes and less time spent behind the wheel overall, and completely ignores how many people are actually moving through the corridor.”

In response, FHWA dumped this peak travel reliability measure, more commonly expressed through the Texas Transportation Institute’s travel time index (TTI), which mostly is a measure of the difference between speeds in the middle of the night and rush hour. This peak travel time measure is gone.

Secondly, they added a “person-hours” measure of delay, which will consider how many people are using the road instead of just how many vehicles are delayed. This was one of our primary critiques of the draft rule, because simple vehicle delay is blind to how many people a corridor is actually moving — it only looks at the number of vehicles. If one corridor moves three times the amount of people as another corridor because of a carpool requirement or a lane dedicated to high-capacity transit, it shouldn’t score the same for congestion just because the travel speed or average delay is the same.

This is a significant change. This means that a congested road that’s full of single-occupant vehicles will never be viewed the same as a corridor that is congested but also multimodal or otherwise carrying more people.

Thirdly, and responding clearly to feedback, FHWA added a new carbon dioxide emissions measure to track the percent change in CO2 emissions generated by on-road mobile sources on most bigger roadways. (Specifically roads on the National Highway System, which, as this graphic reminds us, aren’t always just highways.)

Fourth and lastly, on the topic of multimodal corridors, “…after reviewing these comments, FHWA has decided to include a new multimodal measure — the portion of non-single occupant vehicle travel.”

How did FHWA explain their reasoning to add a measure requiring states and metro areas to set a target for moving people via modes other than single-occupant vehicles?

“Because transportation in urbanized areas is inherently multimodal, it is important to account as much as possible for the options that are available to travelers in those urbanized areas.”

How we measure congestion does matter. It is important to look at congestion and its connection to economic activity. This post from a department within FHWA on Twitter today highlights this connection and it isn’t what most elected leaders and transportation officials believe. Congestion is bad for economic success, right?

Especially after the collapse of the recent Bakken-fueled oil boom of the last few years there, do you think that North Dakota’s leaders would trade ten minutes on their average commute times for ten percent of New York State’s GDP? Does the lack of congestion equal economic success?

This final performance measure from FHWA and USDOT would suggest otherwise.  They are to be applauded, and it wouldn’t have happened without your support. By FHWA’s own admission, the letters that you and thousands of others sent were responsible for pushing FHWA on these critical points.

Stay tuned for more, and sign up for email from T4America to get this kind of news straight to your inbox, including news about a detailed webinar about the new rules happening soon.

Updated: Here’s the video of our webinar about the new performance measures. Read this post for more information.

Politics of performance-based project prioritization in Portland

Leaders and advocates in the state of Oregon and in the Portland metropolitan region have been discussing how to use performance measures to inform smarter investment decisions and build public trust in how transportation dollars are spent. As the Portland-based representative for Transportation for America, I’ve been deeply engaged in these discussions, including serving on a work group for Metro, Portland’s metropolitan planning organization, providing guidance on performance measures in the next long range transportation plan, and working with state leaders on legislation to integrate performance-based decision making into the Oregon DOT’s programs.

This is the first of a series of posts on the issues and challenges of performance-based planning in the Portland region.

Many staffers working on Metro’s long-range transportation plan — referred to locally as the Regional Transportation Plan (RTP) — had the opportunity to attend a two-day symposium at Portland State University focused largely on performance-based project prioritization. Robert Liberty, director of the Urban Sustainability Accelerator at Portland State University, organized the symposium entitled New Thinking for a New Era: A Symposium on Transportation Investment Decision-making. Attendees included staff from MPOs around the country and experts at the cutting edge of performance-based planning.

Participating with T4A director James Corless and SGA senior policy advisor Lynn Peterson, we heard about a range of new policy developments and technical tools from:

  • Chris Ganson, California Governor Edmund G. Brown’s office, on the implementation of vehicle miles traveled (VMT) as a primary measure of environmental impact (instead of level of service (LOS)).
  • Eric Sundquist, Managing Director of State Smart Transportation Initiative (SSTI), on accessibility performance measures and the Sugar Access tool developed by Citilabs, and the implementation of Virginia DOT’s ‘Smart Scale’ project prioritization.
  • Sam Seskin, recently retired from CH2M HILL, on the development of Oregon’s MOSAIC
  • Steve Heminger, Executive Director of the Metropolitan Transportation Commission (the MPO for the San Francisco Bay Area) on their approach to performance-based project prioritization.

Of particular interest were the lessons learned on the politics of integrating performance-based project prioritization into the MPO planning process. A recurring theme was the need to give decision-makers the space and time to get comfortable with a new approach. It can be a challenge to sell elected officials or skeptical board members on a performance-based project prioritization that allows a process imbued with the region’s values to elevate the best projects — rather than a process where the most influential or persuasive voice gets their project funded.

There were a few recommendations for putting elected officials at ease in the early stages of developing a prioritization process:

  • Develop a prioritization system in a way that does not initially put projects at risk of being removed from funding consideration. Local projects are precious to local officials, and they will initially do everything to protect them — even at the expense of the long-term regional gains and smarter investments.
  • Limit the array of projects that will be subject to prioritization. For example, if a project is close to construction, consider it a done deal. Expend effort on analyzing more expensive projects rather than cheaper ones, and focus on capacity expansion projects as opposed to maintenance and operations.
  • Consider if projects need numerical rankings. MTC categorizes projects as high priority, medium and underperforming and uses those categorizations to inform subsequent decision-making.

While these are all ideas to consider, it became clear at the symposium that local context matters. In the Puget Sound region, Councilmember Balducci shared the story of opposition to a specific proposed road through pristine land that helped initiate Puget Sound Regional Council’s (PSRC) project prioritization process. In addition, PSRC developed its process in a time of plentiful funding, and so it was ready to apply when scarcity arose and the MPO needed to cut projects from its constrained list.

MTC has gone through an iterative process that has added rigor over the course of 15 years. At a time when there was controversy over some particular measures, support for the overall approach was strong, and so they continue to expand the program. Originally applied only to projects that expand the system, they have begun evaluating state-of-good-repair projects for prioritization as well.

As Metro considers using performance-based prioritization in its investment decisions, these stories could help inform how to bring skeptical decision-makers on board. It’s challenging for local leaders to switch from the political wrangling they’re accustomed to, to a rational approach that elevates the best projects based on their merits. However, when they emerge on the other side with smarter investment decisions, the ability to communicate decisions more transparently, and as a result, greater public trust and greater ability to raise more transportation revenue, there is no compelling reason to go back.

Going deep with regional leaders on using performance measurement

We wrapped up an in-person workshop today with seven local groups of metropolitan leaders, learning how performance measures and a data-driven approach to assessing the costs and benefits of transportation spending can lead to better decisions and a smarter transportation network.

Transportation Leadership academy boston 1 Transportation Leadership academy boston 2 Transportation Leadership academy boston 3

Throughout yesterday and today in Boston, MA, a team of T4America staff have been joined by some notable experts with on-the-ground experience to dive deep into the topic of performance measures with metropolitan leaders from seven regions across the country. It’s part of our yearlong Transportation Leadership Academy focused on performance measures.

What’s performance measurement? More carefully measuring and quantifying the multiple benefits of transportation spending decisions to ensure that every dollar is aligned with the public’s goals and brings the greatest return possible for citizens.

If you’ve been following along, we’ve been writing regularly about how the transportation law that Congress passed in 2012 (MAP-21) created a new system for states and metropolitan planning organizations (MPOs) to measure the performance of their investments against federally-required measures.

This year’s iteration of our Transportation Leadership Academy is focused on providing these local leaders with tools and support to incorporate this new system into their processes of creating plans, selecting projects, and measuring the effectiveness of each transportation dollar that gets spent. This program, created in partnership with the Federal Highway Administration (FHWA), is educating these seven teams made up of local business, civic, elected leaders, and transportation professionals.

Though the academy is focused on working with regional leaders, a few states also have experience with performance measures. In Massachusetts, as part of a 2013 deal to raise new revenue for transportation, the legislature required the DOT to develop and use performance-based criteria in the state’s transportation investment decisions. Stephanie Pollack, the head of MassDOT, shared her experience with this week’s attendees and why it makes sense to assess transportation projects together and against one another, rather than just sone-by-one.

“Transportation works as a network and fails as a network,” she said. “So why do people think we can fix the network project by project by project? I’m most interested in what is the best suite of projects.” She went on to describe why data matters, but only if you measure the right things. “You should be asking people what matters to them and measure that. If you don’t, you are telling your customers that what matters to them is unimportant. …Data is only useful if it helps you tell a story or make better decisions.”

There are other metro areas that have been using performance measures for years and have valuable experience to share.

The MPO for the Bay Area, the Metropolitan Transportation Commission (MTC), has done more than most metro areas when it comes to using data and sophisticated modeling to aid and assess their decision-making. Participants got to hear the Hon. Steve Kinsey discuss MTC’s deep experience using cost-benefit analysis and their quantitative approach to performance measures.

And Robin Rather, a strategic communications veteran who has done deep research into the topic, explained how the messages and language matter, i.e., making the case for performance measures in economic terms is one of the most effective ways to get skeptical MPO board members or the public to buy-in to the idea.

This second academy workshop wraps up early this afternoon, marking the end of the academy’s in-person gatherings. Training will continue via other forms through the rest of the year, and we’ll be following up with some thoughts on the academy and sharing the perspectives of some of the participants. Stay tuned.

Measuring what we value: Prioritizing public health to build prosperous regions

A new package of case studies released today by T4America, in partnership with the American Public Health Association, showcases a range of strategies that metro area planning agencies can use to strengthen the local economy, improve public health outcomes for all of their residents, promote social equity and better protect the environment.

CDC APHA health case studies

Today, we’re launching Measuring what we value: Prioritizing public health to build prosperous regions, four short case studies that extend our previous work on data-driven decision-making for choosing transportation projects.

Download the four case studies below.

A growing number of the metro leaders, elected officials and citizens we talk to are asking questions like: can the people in neighborhoods more likely to be unhealthy easily get out for a walk or bike ride without having to traverse dangerous streets? Do our regional planners effectively consider the impacts on regional air quality as we choose which projects to build? Is the area putting forward the most competitive possible projects to win limited state or federal funding for walking and biking?

A handful of metro areas have found smart, data-driven ways to better conceive, select and build the transportation projects that can help address these looming questions. We’re happy to share with you four of those stories from metro areas big and small: Sacramento, CA; Broward County, FL; Nashville, TN and Greensboro, NC.

Download each one below.


SACRAMENTO, CA
Promoting health and economic prosperity through data-driven decision-making

Citrus Heights community center groundbreakingUsing a lens of improved economic performance by improving public health, the Sacramento Area Council of Governments (SACOG) adopted several health- and social equity-related performance measures into a rigorous, data-driven process for choosing transportation projects, resulting in more projects that make it safer and more convenient to walk or bicycle.

Download the Sacramento case study. (pdf)

BROWARD COUNTY, FL
Healthy, safe & prosperous by design: Building complete streets

Prompted by a need for safer streets, the Broward Metropolitan Planning Organization (MPO) spearheaded an effort to build regional consensus and political support for planning, designing and building more complete streets projects. As a result, 16 of the MPO’s 31 jurisdictions have adopted Complete Streets resolutions or guidelines, and the MPO increased funding for active transportation projects, with 90 individual bicycle and pedestrian projects totaling $120 million awarded funding since 2012.

Download the Broward case study. (pdf)

NASHVILLE, TN
Prioritizing public health benefits through better project evaluation

Nashville missing sidewalksBacked by data from comprehensive health studies and growing public demand to make biking and walking safer and more convenient throughout the region, the Nashville Area Metropolitan Planning Organization (MPO) designed a new scoring and selection process to prioritize transportation projects that can bring health benefits. The MPO’s new approach substantially increased the amount of funding in the their long-term transportation budget dedicated to making it safer and more attractive to walk or ride a bicycle, making strides toward improving the health of the region’s residents.

Download the Nashville case study. (pdf)

GREENSBORO, NC
Healthy competition: Using data and modeling tools to win funding for active transportation projects

Greensboro sidewalks Guilford CollegeTo make walking and biking safer, more equitable and more convenient in Greensboro, North Carolina, the Greensboro Metropolitan Planning Organization (MPO) developed a rigorous evaluation and data-driven selection process to analyze and select the best possible bicycle and pedestrian projects for the metro area’s available funds, and to help the region better compete for the limited, competitive funding controlled by the state.

Download the Greensboro case study. (pdf)


The development of these case studies was made possible through a contract between the American Public Health Association and Transportation for America funded through cooperative agreement 5U38OT000131-03 between the Centers for Disease Control and Prevention and the American Public Health Association.  The contents of this document are solely the responsibility of the authors and do not necessarily represent the official views of the American Public Health Association or the Centers for Disease Control and Prevention.

Proposed federal rules for measuring and addressing congestion in states and metro areas generate widespread opposition

press release

Nearly 150 organizations — including dozens of local chambers of commerce and elected officials — and nearly 5,000 individuals spoke out in opposition to a flawed proposal from USDOT.

WASHINGTON, DC — Led by Smart Growth America (SGA), Transportation for America and the National Complete Streets Coalition, a broad coalition of business groups, local elected leaders, national and local organizations and thousands of individuals filed formal comments last week urging USDOT not to incentivize transportation projects that would punish cities investing in public transportation, treat main streets like highways, ignore the needs of people walking or biking, and push local communities of all sizes to waste billions of dollars in vain attempts to build their way out of congestion.

The comments were in response to a proposal from USDOT that will, when finalized in 2017, govern how states and metro areas are required to measure and address congestion and other metrics like freight movement and emissions, on a large share of our nation’s roadways. The 120-day public comment period closed on Saturday, August 20th. (The letter from the full coalition is here, a separate letter signed by 21 chambers of commerce is here, and the comments submitted by individuals are here.)

For two years, as required by 2012’s MAP-21 transportation authorization, USDOT has been working to establish a new system of performance measures to help govern how federal dollars are spent and hold states and metro areas accountable for making progress on important goals — a welcome shift toward measuring what our transportation spending actually accomplishes.

But this proposed rule would lead to negative outcomes in communities and billions of dollars wasted due to its singular focus on moving single-occupancy vehicles as fast as possible while failing to count the benefits of carpooling, public transportation, telecommuting, bicycling or walking. (T4America outlined the problems with the rule in detail here.)

“There’s a direct connection between how we decide to measure congestion and the ‘solutions’ that we decide to invest in,” said James Corless, director of Transportation for America (T4America). “And by prioritizing vehicles over people and completely ignoring a diversity of transportation options, this proposed rule would fail the communities that our transportation investments are intended to serve.”

To develop a stronger alternative measure to submit to USDOT, SGA convened a working group of more than 30 local elected officials, state DOTs, metropolitan planning organizations (MPOs) and transit agencies, and national and state trade groups and advocacy organizations.

This work was supported by numerous state DOTs, MPOs, transit agencies and advocacy organizations; Oregon Metro (Portland) and Indy MPO; Trimet; Metro Atlanta Chamber and Indy Chamber; and the Transportation Equity Caucus, League of American Bicyclists, Safe Routes to School National Partnership, People for Bikes, PolicyLink, the Leadership Conference on Civil and Human Rights, Center for Neighborhood Technology and many others.

The coalition specifically requested the following changes to the final rule:

  • Focus on the movement of people instead of only vehicles — the rule would treat a bus full of commuters the same as a single vehicle carrying one person;
  • Remove the duplicative vehicle speed measures that provide marginal benefit;
  • Provide a timeline for USDOT to implement an accessibility performance measure;
  • Measure greenhouse gases (GHG) from the transportation sector, which represents the largest GHG emissions sector in the country; and
  • Improve data sets to incorporate accurate roadway volumes, strategies to develop and implement safe and accessible multimodal networks, accessibility, and trip origin and destination.

In addition, a congressional delegation led by Senators Carper and Menendez in the Senate and Representative Blumenauer in the House also sent letters to USDOT Secretary Foxx requesting that USDOT assess the movement of people, rather than vehicles, as a better measure of congestion and also reward the improvements that can come from transit, toll lanes, or encouraging travelers to choose other options like walking or biking.

We are hopeful that the Obama Administration will heed our call and change this rule to encourage a more holistic approach for measuring traffic congestion that counts everyone and supports the ambitious plans of local, metro and state leaders to make smart transportation investments to better connect all people to opportunity.

For immediate release
Contact: Steve Davis
steve.davis@t4america.org
202-971-3902

Transportation for America (www.t4america.org) and the National Complete Streets Campaign (www.completestreets.org) are programs of Smart Growth America (www.smartgrowthamerica.org).

Time is running out to tell USDOT to measure more than just vehicles

These two streets in Nashville, Tennessee are very different and have different functions. Why does the U.S. Department of Transportation want to measure their success the same way? 

Nashville congestion comparison 2

One is intended to move goods and people, largely in vehicles, quickly between two points. The other moves people — in cars, in buses, on bikes, on foot — while also creating a framework to produce lasting value, economic activity, and a sense of place.

It doesn’t make sense to measure the success of these streets the same way. Yet that’s exactly what USDOT is proposing with new rules for how states and metro areas would have to measure and address congestion — prioritizing vehicle speed above almost all other criteria.

The most successful city streets have to use limited space to move people efficiently, whether walking, biking, taking transit or driving. Yet this congestion rule as it is currently written would count only vehicles.

A street that moves a lot of people should never be considered unsuccessful, even if it doesn’t necessarily move a lot of cars.

The proposed rule would make driving fast the ultimate goal of our transportation system, regardless of what type of road or street you’re on. Should driving fast be the highest priority on main streets where people go to shop or sit and eat at an outdoor café? Should moving cars quickly be the top priority in residential neighborhoods where children might be biking or walking?

A street that creates value, economic prosperity and a sense of place should never be considered unsuccessful, even if it doesn’t necessarily move a lot of cars.

We have a chance to change this rule, but time is running out. Public comments on the rule close this week, and now is a crucial time to speak out.

Tell USDOT to improve their proposed rule and send a letter today.


You can view or share examples from a handful of other cities below.

SF congestion comparison 2 Charlotte congestion comparison 2 DC Congestion Comparison 2 Chicago congestion comparison Seattle congestion comparison 2 Portland congestion comparison 2 NYC congestion comparison LA congestion comparison 2 Denver congestion comparison 2 Atlanta congestion comparison


What would a better measure of congestion look like? Unpacking an alternative

USDOT’s draft rule that will govern how states and metro areas will have to measure and address congestion would define “success” in incredibly outdated ways. In a webinar earlier this week, we discussed better ways to measure congestion and a proposal we’re sending to USDOT.

Nearly 3,000 of you have already sent letters to USDOT telling them that their draft rule takes the wrong approach. But is there an alternate proposal that could get traction with USDOT as they modify the proposal based on the feedback they receive?

congestion-webinar-feature-slideIn a webinar on Wednesday, July, 13th, our policy team discussed alternative measures for congestion and unpacked the proposal that we’re submitting to USDOT for their consideration, which was developed in collaboration with a handful of MPOs, transit agencies, state DOTs, and advocates throughout the country.

Click the image at right (or here) to view the presentation from the webinar and hear more about the proposal we are submitting to USDOT this week. Update: For those of you who are more technically inclined, you may download our full 12-page proposal (pdf) that we submitted to USDOT on July 14th.

Deciding how to evaluate which projects are “successful” will influence which transportation projects are selected and built for years to come. And the problem with using old measures for assessing traffic congestion is that it leads directly to old “solutions,” like prioritizing fast driving speeds above all other modes of transportation and their associated benefits. We’ve been illustrating this with some simple graphics that show what results when “moving cars fast” becomes the prime or only consideration:

Congestion We All Count

Have you sent your letter yet? There’s still time.

Success is about a lot more than moving cars fast. Tell USDOT to improve their proposed rule. Sign an individual letter that we will deliver on your behalf to USDOT.

Join us for the release of Planning for a Healthier Future

2016_0504 Kresge Calthrope PM Report
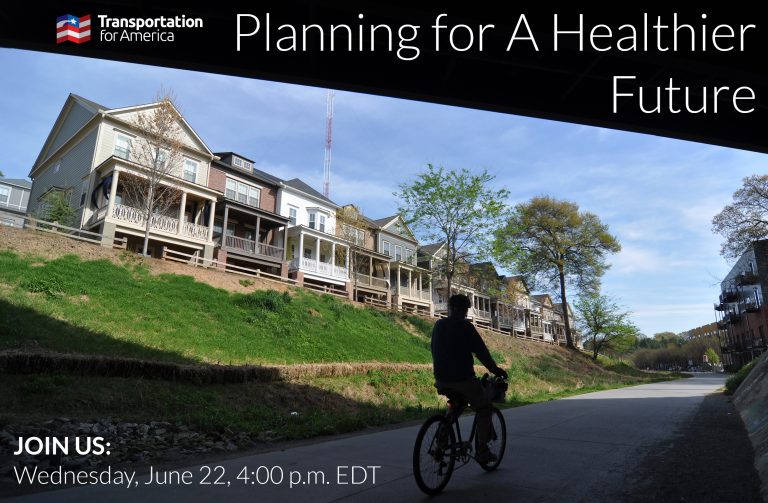
Thanks to 2012’s MAP-21 legislation, all metro areas and states will soon be using a limited array of performance measures. While the in-progress federal requirements will cover a limited range of measures, T4America is releasing a new resource next week to help metro areas find ways to use performance measures to improve public health, address social equity concerns, and advance environmental quality.

Join us next week on Wednesday, June 22 at 4:00 p.m. EDT for a special online discussion about the new report, including firsthand experience from some of the metro regions that participated in a related two-year collaborative — more about that below. Sign up and be the first to get a copy of the Planning for a Healthier Future report in your inbox next Wednesday.

REGISTER NOW


While the federal performance measures currently being developed will cover limited metrics like safety, condition of roads and bridges, or how to measure congestion, this report lays out additional measures that enable MPOs and regions to understand the health impacts of transportation and land use decisions within three other dimensions: physical activity, traffic safety, and exposure to air pollution.

This report is the result of our two-year Planning for a Healthier Future collaborative with teams from the regions of Seattle, WA, Portland, OR, San Diego, CA and Nashville, TN. These four regions are actively working to improve health, increase access to opportunity for vulnerable populations, protect the environment and promote economic competitiveness by developing and implementing transportation performance measures for their respective metropolitan planning organizations (MPOs)

Performance measures and health?

urban design for health transportation impacts health

Cities and regions around the country face important choices about how and where they want to grow, how to connect people to economic prosperity and how to use limited resources to promote healthy communities and provide a great quality of life for all of their residents.

Performance-based planning allows stakeholders and decision-makers to understand how a given investment, policy, or decision “performs” across certain measures over time — providing more clarity and transparency on exactly what state or regional transportation dollars are accomplishing. As a result of the transportation projects that get built, is the air cleaner? Do more people have access to opportunity? Is environmental quality made better or worse? Are the impacts on people’s health — especially vulnerable populations — positive or negative?

This detailed report summarizes current best practices in the development of health, equity and environmental measures that can be used to evaluate the performance of transportation investments at a regional scale. It aims to explore and test a variety of different data-driven measures that can evaluate packages of transportation investments — such as those frequently bundled together by MPOs in transportation plans.

Join us next week to learn more and get your copy!

REGISTER NOW

Kresge Calthorpe report logos

House transportation spending bill takes unprecedented steps to increase access to opportunity for all Americans

press release

Transportation for America, PolicyLink, and The Leadership Conference for Civil and Human Rights applaud the House Appropriations Committee for directing the U.S. Department of Transportation (USDOT) to measure how transportation investments will connect all Americans to opportunity and essential daily needs such as jobs, schools, healthcare, food and others.

For immediate release
May 26, 2016

Our organizations thank Representatives Waters, Carson, Ellison, Grijalva, and Quigley for their leadership in including this important provision in the 2017 House Transportation, Housing and Urban Development (THUD) Appropriations report that passed the House Appropriations Committee yesterday.

“Connecting people to opportunities is one of the primary reasons we build transportation infrastructure, plain and simple,” said Transportation for America Director James Corless. “It’s incredibly encouraging to see the House Appropriations Committee recognize the fact that transportation isn’t an end in itself. To determine if we’re building the right things in the right places, it’s critical that we measure — and improve — the access people have to opportunities. Jobs, healthcare, schools, grocery stores full of healthy food — it’s critical that the streets and transit systems we invest in give as many people as possible more affordable access to all of these things.”

“Each day, millions of Americans — particularly low-income communities and communities of color — struggle to access the resources they need to thrive, simply because they have no transportation to get them where they need to go,” said PolicyLink President and CEO, Angela Glover Blackwell. “By calling on USDOT to work with communities to measure how well we are connecting people to opportunity, Congressional leaders have taken a key step toward equipping local leaders with the equity-focused data they need to reimagine and build a more just transportation system.”

“We are encouraged that the House Appropriations Committee has acknowledged the importance of measuring how our transportation investments stack up in terms of connecting our communities to opportunity, and the Department of Transportation must take up the charge to establish an accessibility performance measure without delay,” said Nancy Zirkin, Executive Vice President of The Leadership Conference on Civil and Human Rights. “Without access to transportation, our communities lack the ability to connect to all of the things that they need to sustain their families, including jobs, child care, and affordable housing. With access to transportation, our communities have a world of opportunity opened up to them. The Department of Transportation should leave no stone unturned in ensuring that dollars spent on transportation are being used in the smartest way possible to connect our communities to opportunity.”

The report accompanying this bill encourages the Secretary of Transportation, in coordination with the Federal Highway Administration and the Federal Transit Administration, “to establish an accessibility performance measure to be available to states, metropolitan planning organizations, and transit agencies to assess the degree to which the transportation system, including public transportation, provides multimodal connections to economic opportunities, including job concentration areas, health care services, child care services, and education and workforce training services, particularly for disadvantaged populations.”

USDOT is in the middle of an ongoing process to establish a new series of performance measures for transportation spending — resulting in a new system that will require states and metro areas to measure the impact of their transportation dollars. But the measures developed so far have been limited to metrics like road and bridge conditions, safety and congestion, among others — failing to consider whether or not investments give all people better access to what they need each day.

Do the projects proposed by state and local transportation agencies divide communities or knit them back together? This new accessibility measure will direct USDOT to find ways to measure the answer to questions like that.

The House THUD Appropriations bill, in its current form, also provides robust funding for the Federal Transit Administration’s capital investment program and has strong funding for the important TIGER multimodal discretionary grant program. Both of these programs are essential to helping communities throughout the country build cost-effective multimodal transportation systems that can help connect all residents to opportunity.

Our organizations look forward to working with House leadership as the bill moves forward to ensure USDOT, states and local leaders have the resources needed to successfully build and measure our transportation investments to ensure that all Americans have access to basic needs and economic opportunities.

For more information, contact:
Steve Davis
Director of Communications
202-971-3902
steve.davis@t4america.org

Ask USDOT to #MakeMeCount this Bike to Work Day

This Friday, thousands of people across the country will put on their helmets and take to the streets for National Bike to Work Day, an annual event promoting active commuting options and safer streets. 

CiGfqFXUgAArtpOWill you be joining the event this week? If so, make your ride even more impactful by telling USDOT to #MakeMeCount and look at people, not just vehicles, when it comes to measuring how well a street works.

More and more Americans are choosing to bike — as well as walk, take transit, or share a ride — to work each day. Yet a recent USDOT proposal for measuring traffic congestion would ignore all these people when evaluating whether a street is working well or not.

If you bike to work this week, snap a photo and share it on Twitter or Facebook with the following text:

Hey @USDOT, I biked to work today! #MakeMeCount when measuring congestion. http://bit.ly/make-me-count #BTWD2016
Twitterlogo

USDOT’s proposed rule would make driving fast the ultimate goal of our transportation system—regardless of what type of street you’re on. That means driving fast could take precedence along streets where children are walking or commuters are biking, as so many people will be doing this week.

Don’t plan to bike this week but still support streets that work for everyone? Sign the petition to USDOT and then help spread the work with our gallery of shareable images.

I’ll be asking USDOT to #MakeMeCount this Friday. I hope you’ll join me.

Join us as we break down FHWA’s most recent rulemaking on measuring traffic congestion

Do you want a transportation system that makes you count? Join Transportation for America for a free, public webinar on Wednesday, April 27 at 1:00 p.m. EST to discuss the recently announced Federal Highway Administration (FHWA) national transportation performance rulemaking on measuring traffic congestion and its implications for communities nationwide.

For the first time, USDOT has released new requirements for how states and metro areas will have to measure traffic congestion. However, the rule as proposed doubles down USDOT’s focus of prioritizing single occupancy vehicles over multi-modal solutions and completely discounts non-vehicular users. How we measure congestion matters, and this rule applies to the lives of all who use our transportation system.

Joe McAndrew, T4’s Policy Director, will cover what’s in FHWA’s performance rulemaking, a few high-level first principles to guide change, and how civic, business and elected groups can impact the outcome of this rulemaking.

Register for Webinar

There’s a direct connection between how we decide to measure congestion and how we choose to address it. If we focus, as this rule does, on keeping traffic moving at a high rate of speed at all times of day on all types of roads and streets, then the result is easy to predict: our solutions will prioritize the investments that make that possible, regardless of cost vs. benefits or the potential impacts on the communities those roads pass through.

Sign up for Wednesday’s discussion, and in the meantime, here are ten things you should know about this new rule and what you can do about it.

Ten things to know about USDOT’s new proposal for measuring traffic congestion

For the first time, USDOT has released new requirements for how states and metro areas will have to measure traffic congestion. While the new rule marks a continued, necessary shift to assessing what our federal transportation dollars actually accomplish, this proposal as introduced doubles down on outdated measures of congestion that will push local communities to spend billions of dollars in vain attempts to build their way out of it.

For two years, USDOT has been working to establish a new system of performance measures to help govern how federal dollars are spent and hold states and metro areas accountable for making progress on important goals. This proposal for congestion (and several other measures focused on “system performance”) is the last of three sets of new Federal Highway Administration (FHWA) rules that will be finalized in early 2017.

Though this represents an incredibly important and necessary shift toward measuring what our transportation spending actually accomplishes, using the wrong measure for congestion will help advance projects that divide communities, cut people off from opportunity, and cost billions of dollars (we don’t have) in the name of solving “congestion” by trying in vain to keep traffic moving.

As we laid out in our post on congestion last week, how we measure congestion matters.

There’s a direct connection between how we decide to measure it and how we choose to address it. If we focus, as this rule does, on keeping traffic moving at a high rate of speed at all times of day on all types of roads and streets, then the result is easy to predict: our solutions will prioritize the investments that make that possible, regardless of cost vs. benefits or the potential impacts on the communities those roads pass through.

Here are ten things you need to know about this new rule from USDOT and what you can do about it


#1 The rule undermines Secretary Foxx’s unprecedented effort to connect communities and use transportation to give people greater opportunities

Transportation Secretary Anthony Foxx recently launched a campaign based on the stunning admission that federal policy had long incentivized poorly designed highways that isolated communities and cut people off from jobs and opportunities.

Springing out of powerful personal examples he saw firsthand growing up in Charlotte when new freeways were built “to carry people through my neighborhood, but never to my neighborhood,” he expressed his firm commitment to ensuring that our transportation investments connect more people to opportunity and knit communities together — rather than divide them.

crestdale drive charlotte interstates congestion rule

Where the streets around Secretary Foxx’s childhood neighborhood dead-end into Interstates 77 and 85 in Charlotte, NC

It’s an inspiring effort, but as he said, “These principles sound very easy, but they’re really hard and they’re also very necessary if we’re going to make transportation work for everybody.”  This rule produced by FHWA illustrates the uphill battle against the institutional inertia for the old way of doing things.

This proposal also undercuts the Secretary’s ongoing Mayors’ Challenge for Safer People and Safer Streets intended to “help communities create safer, better connected bicycling and walking networks,” explicit requirements from Congress to design streets safe for all users, and the nearly 900 communities that have passed complete streets policies to do the same.

“We’re trying to be more attuned, but it’s not a situation where the federal government is solely in control. We can’t tell a state what project to do. They have to make those determinations,” Sec. Foxx noted.

Indeed, states and metro areas will still be making the bulk of the decisions. Yet through this rule and other guidance, USDOT can absolutely usher in a new paradigm by steering states and metro areas to a more holistic approach for measuring traffic congestion that counts all people in a community by counting all modes of transportation. And we will need your help to hold USDOT’s feet to the fire to make this change happen.

#2 Focusing on delay is simply the wrong measure for addressing congestion

USDOT plans to measure vehicle speed and delay seven different ways, while ignoring people carpooling, taking transit, walking & biking or skipping the trip entirely.

A host of people and groups from all across the map, including T4America, have already explained in detail how a singular focus on delay for drivers paints an incredibly one-dimensional picture of congestion. Focusing on average delay by simply measuring the difference between rush hour speeds compared to free-flow 3 a.m. traffic fails to count everyone else commuting by other modes, rewards places with fast travel speeds at the expense of places with shorter commutes and less time spent behind the wheel overall, and completely ignores how many people are actually moving through the corridor.

This measure treats a corridor filled with buses or carpoolers the same as a corridor filled with single-occupancy vehicles. It ignores millions of people who opt out of congestion entirely by taking transit, telecommuting, walking or biking, and even penalizes places where people get to take shorter trips. While USDOT’s proposal to measure delay per capita at least begins to recognize that not everyone in a region is stuck in traffic on the highway, it still fails to measure how many people are moving through a corridor.

Shouldn’t the actual impact on real people be the core principle of anything we measure? Any traffic congestion measure should lead us to solutions that increase access to opportunity for everyone — regardless of how they travel each day.

#3 You can’t manage what you don’t measure

In the pointed words of a USDOT official earlier this week, “you can’t manage what you don’t measure.” The really staggering thing is that FHWA knows they’re missing the boat on measuring other crucial things that paint a more accurate picture of delay. From their own words in the 425-page rule:

As with delay metrics, FHWA acknowledges that travel time indices do not capture system attributes in terms of shorter trips or better access to destinations and mode options, which may occur at the expense of greater delay.

True. So let’s find a better way than focusing narrowly on delay.

#4 USDOT should stick with reliability and dump delay

One of the few positives is that (in one of the measures), USDOT recognizes that predictability is incredibly important. The rule includes a people-centric metric of “reliability” — whether a trip on a corridor takes the same amount of time from one day to the next. While completely eliminating rush hour congestion isn’t either possible or affordable, what many travelers are looking for is the basic assurance that their morning commute will take the same amount of time each day, allowing them to plan their trips with predictability.

But reliability for whom? Unfortunately, this rule only considers the reliability of those traveling by car, and will ignore whether or not your transit trip is hit or miss.

Though one of the other measures is labeled “reliability,” it’s just another measure of delay in sheep’s clothing: It defines “reliability” as trips taking the same amount of time at any time of the day – middle of the night or rush hour — an incredibly unlikely scenario.

#5 When it comes to congestion, this treats highways the same as main streets — and could do real harm to our most economically vibrant places

Take a look at these two sets of streets from Nashville and Charlotte. First: US 41/Clarksville Pike in northern Nashville, and then Broadway in downtown Nashville.

US 41 Nashville congestionNashville Broadway NHS congestion

And Brookshire Blvd/NC-16 headed south into Charlotte, and Tryon Street near downtown

NC 16 Charlotte congestionCharlotte Tryon Street NHS congestion

Are the needs of all of these streets the same? Do they all need to accomplish the same thing? Should we expect them to function the same way?

Partially because of a decision made all the way back in 2012 in MAP-21 to expand what’s known as the National Highway System to include nearly every four-lane (or larger) road — regardless of what kind of traffic it carries or where it passes through, this measure proposes to measure congestion roughly the same way on all of them.

Whether in a rural small town or a big city, the needs of our country’s main streets are radically different from the highways and interstates designed to connect disparate places. For a main street to function well, it has to serve everyone who needs to use it.

On a main street, that which looks like “vehicle delay” to a traffic engineer looks like economic activity and success to a local merchant or mayor on a main street.

#6 USDOT ignores the innovative things other states and metro areas are already doing

California has already moved to scrap level of service (LOS) as an evaluation criteria for transportation projects, one that has typically resulted in the same outcomes as this narrow congestion rule. As Angie Schmitt wrote in Streetsblog back in January:

Instead of assessing how a building or road project will affect traffic delay, California will measure how much traffic it generates, period. Car trips, not car delays, will be the thing to avoid. This is likely to have the opposite effect of LOS, leading to more efficient use of land and transportation infrastructure.

At the same time that USDOT is proposing to double down on 1960’s measures for traffic congestion, other metro areas across the country are setting ambitious new goals and accompanying performance measures for improving health, improving access to jobs for more people or expanding transit to connect more people to opportunity.

#7 We can’t wait to develop better measures until we have the “perfect” data

Throughout the rule’s 425 pages, USDOT continues to perpetuate the myth that they lack adequate data to measure other modes of transportation, ignoring sources like (their own!) National Transit Database, the U.S. Census American Community Survey, and cell phone network data among others. USDOT invested millions of taxpayer dollars after the passage of MAP-21 to procure the data necessary to develop these vehicle-only measures. If USDOT is spending our money to collect data then they must find ways to acquire the data needed to better measure the entire system and all of its users.

#8 It puts containers above commuters

By defining congestion on interstates as speeds below 35 mph for commuters but below just 50 mph for freight trucks, this rule strangely prioritizes the needs of freight movement at the expense of people. While the movement of freight is indeed incredibly important, it should be on a level playing field with the people picking up the majority of the tab for the system’s maintenance. (To say nothing of the difficulty of actually implementing different standards for various types of vehicles on the same roadway.)

This rule also sets an impossible standard for freight movement in urban settings. Freight bottlenecks obviously occur far more often in urban areas where demand is far greater. Does anyone think that it’s feasible or affordable to spend enough or build enough capacity so that trucks can travel at 50 mph through the middle of major cities during rush hour?

#9 It undercuts the goal of protecting and enhancing the environment

This rule does include more than just measures for traffic congestion, including a requirement to measure mobile source emissions (i.e. pollution from vehicles). Yet states and metro areas would only have to measure the impact of the few projects funded by the relatively tiny Congestion Mitigation and Air Quality (CMAQ) program, which is akin to not being required to reduce highway deaths on a road because that road was built with highway dollars instead of safety improvement dollars.

Though the rule makes a first-ever move to include language on measuring the contribution of the potential emissions impacts of transportation, it stops far short of actually including any requirements with teeth. As Joe Cortright wrote earlier this week:

Despite some hopes that the White House and environmentalists had prevailed on the USDOT to tackle transportation’s contribution to climate change as part of these performance measures, there’s nothing with any teeth here. Instead—in a 425 page proposed rule—there are just six pages (p. 101-106) addressing greenhouse gas emissions that read like a bad book report and a “dog-ate-my-homework” excuse for doing nothing now. Instead, DOT offers up a broad set of questions asking others for advice on how they might do something, in some future rulemaking, to address climate change.

#10 We still have a chance to improve this rule — but we’ll need your help to do it

The comment period for this rule isn’t open yet — it will open on Friday, April 22 and run for at least 90 days. Though USDOT has gone in the wrong direction on many of these measures, we know from our past experience on similar rules that they are absolutely listening for suggestions for improving this. They’re eager to hear how it can be improved.

There are three things you can do in the next week to help.

Not on our email list already? Sign up here.

Breaking news: USDOT releases draft rule for measuring congestion

A new federal proposal governing how states and metro areas will be required to measure congestion was just released early today. Our brief analysis finds that though there’s potential for improvement with how the rule is worded, it would still push local communities to waste time and money attempting to build their way out of congestion by using a measure of traffic congestion that’s narrow, limited and woefully out of date.

As we alluded to last week, thanks to new requirements in the 2012 transportation law (MAP-21), USDOT was preparing to release the last batch of new performance measures to help ensure federal dollars are spent to make progress on important, measurable goals. Though these new directions on measuring congestion (along with other important measures) won’t be officially released and open for comment until this Friday, this document posted by FHWA today is likely to be the final proposal for new performance measures.

We’re reading through the full 425-page rule now, and will have much more here on the blog soon (and in your email inboxes), including a way for you to send official comments to USDOT urging them to do better.

Do you want to be notified with the latest news on this front? Sign up for email from T4America today. 

In the meantime, if you missed our post last week explaining why it’s important how we choose to measure congestion, catch up with that here.