
While other cities try to replicate Houston’s successful bus network overhaul, Maryland’s plan for Baltimore falls short

At a time when other cities are redesigning their bus transit service and aggressively investing overall in public transportation to provide more consistent, predictable service to serve residents and employers, Baltimore — thanks to the state of Maryland — is attempting to get the most out of its bus system with only marginal new investment and changes in service that won’t do much to improve access to jobs, schools, or opportunity.

04.CathedralStreet.BaltimoreMD.30August2016

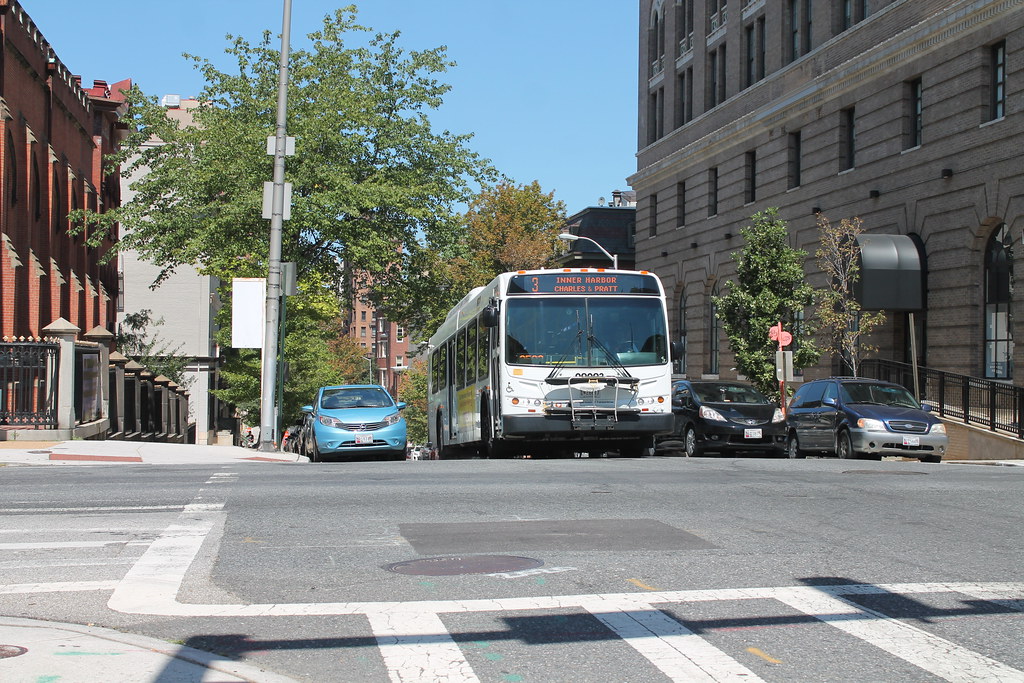
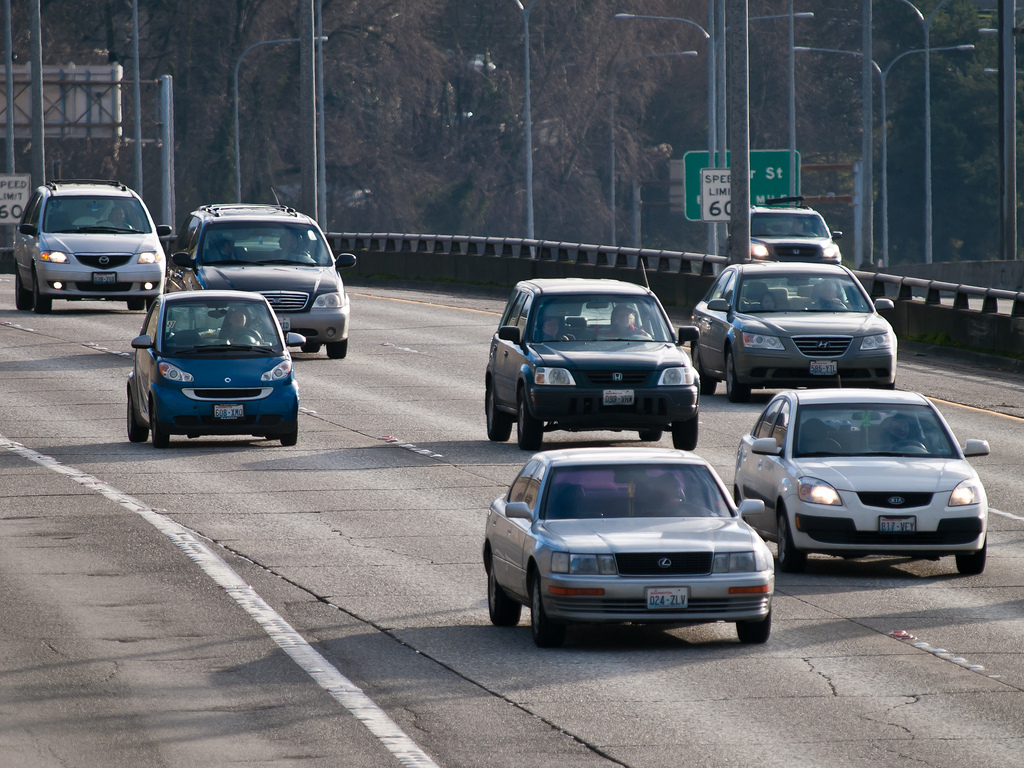
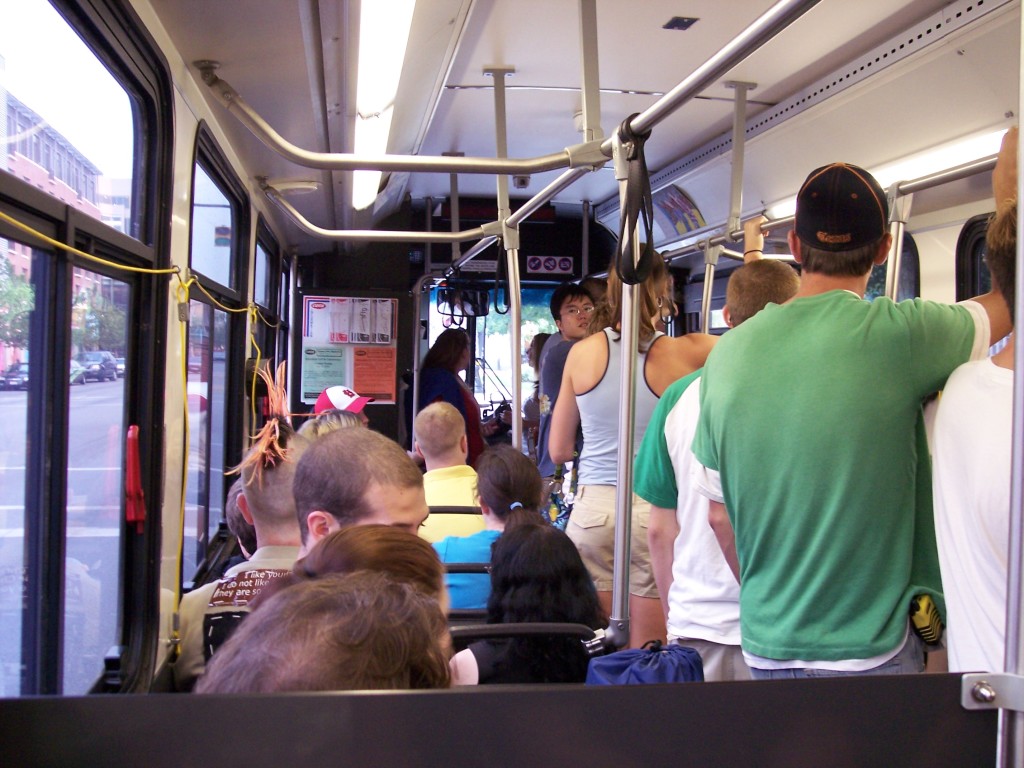
MTA Route 3 bus on Cathedral at West Franklin Street in Baltimore. Flickr photo by Elvert Barnes.

One of the most widely read transportation stories of the past few years is the dramatic transformation of Houston’s public transportation system, made possible by completely rebuilding their bus network and re-launching in 2015. As CityLab’s Laura Bliss wrote earlier this year:

The old hub-and-spoke system that had for decades funneled commuters downtown was straightened into a grid that cross-cuts the sprawling city, with fewer redundancies, more frequent service, and all-day, all-week service on heavily used lines.

For no substantial increases in operational costs, Houston was able to redesign their system to connect one million people and jobs with high-frequency all-day service. Paired with an expansion of light rail, it’s brought a significant increase in both ridership and the access that their residents have to jobs and opportunity.

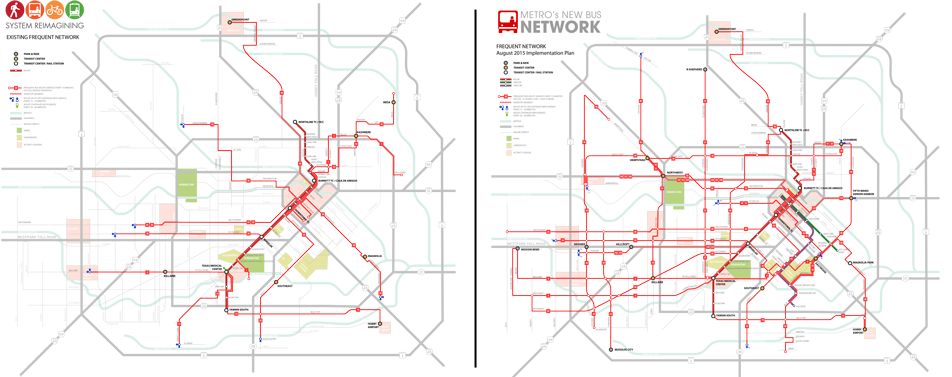
The map of Houston’s frequent bus service, before (and after) their 2015 network redesign.

Meanwhile, halfway across the country in the summer of 2015, another story was unfolding.

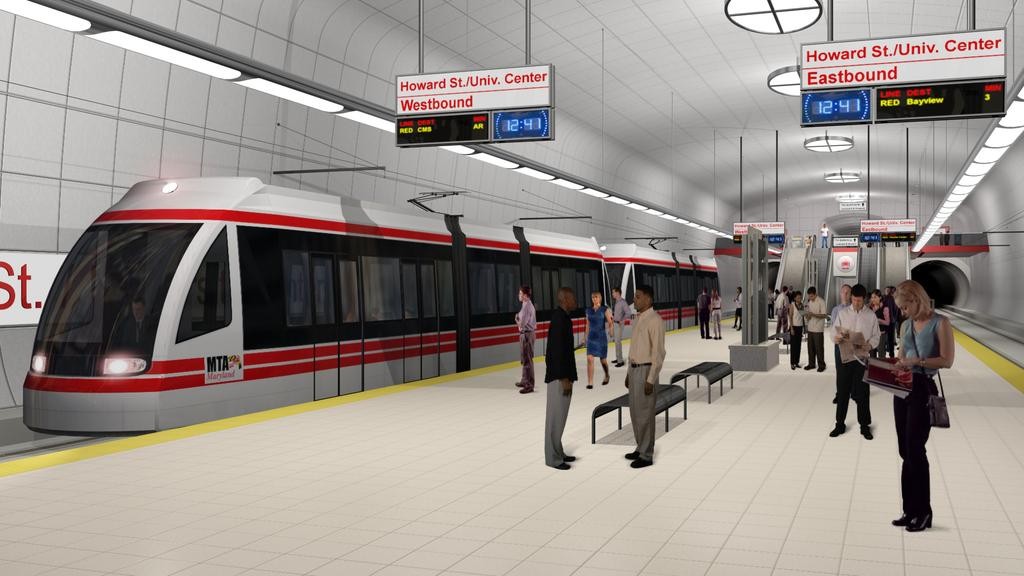
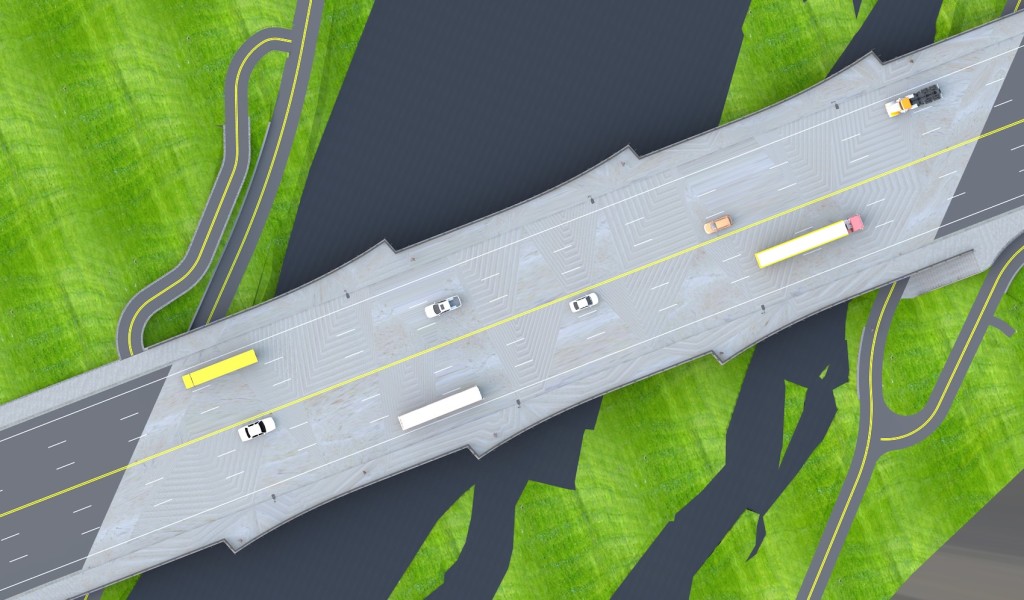
That summer, Maryland Governor Larry Hogan canceled Baltimore’s long anticipated Red Line rail project that would have created a powerful new high-capacity transit line through the city. It would have connected jobs at Bayview (Johns Hopkins Bayview, National Institutes of Health), Woodlawn (Social Security Administration, Centers for Medicare and Medicaid Services) and the downtown office core with scores of residential neighborhoods all along the line — including some of the West Baltimore neighborhoods that would benefit the most from the investment and connection to opportunity that a new transit line provides.

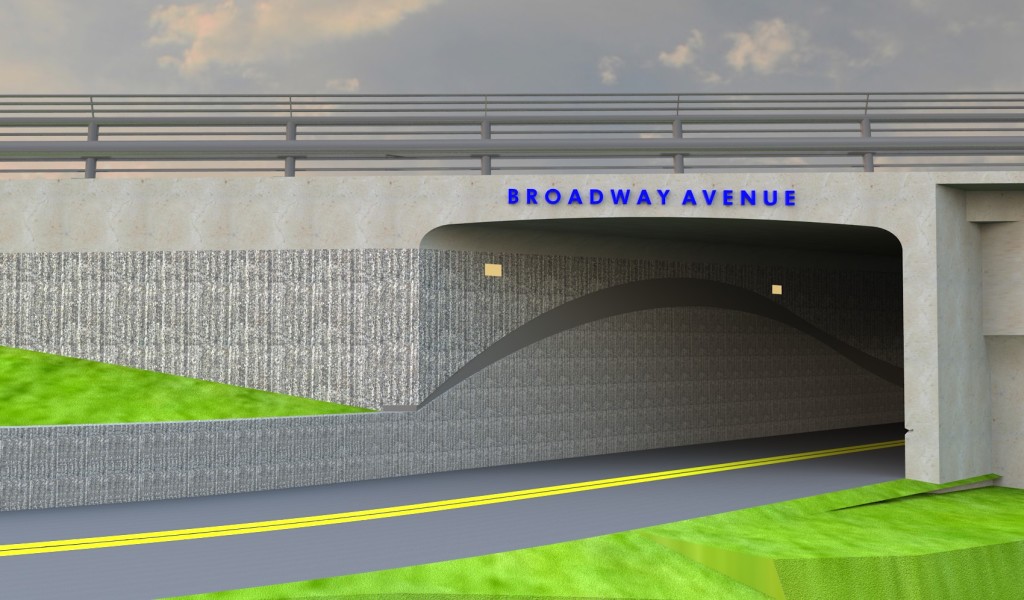
A rendering of a station on the proposed Red Line in Baltimore, canceled in 2015 by Governor Hogan.

With many in Baltimore still reeling, just a few months later, Gov. Hogan’s administration released BaltimoreLink, “a transformative new vision for the future of transit in Baltimore City.” It was billed as a $135 million investment to rework Baltimore’s transit service, but those numbers are a little deceiving, as you’ll see.

The city and region’s transit is planned and operated by the Maryland Transit Administration (MTA), a state agency. No Baltimore agencies are in the driver’s seat of their own transit system, and have surprisingly few avenues for oversight and accountability of the MTA-run system.

Assessing the state’s proposal

Back in the fall, T4America helped the Central Maryland Transportation Alliance (Transportation Alliance), a coalition that supports improving and expanding transportation options in the Baltimore region, perform a quantitative analysis on the plan to see if the numbers would bear out on the benefits the state was claiming. Would the plan improve access to jobs, schools, and healthy food?

After all, in principle, a major reworking of the bus system map to improve service was a goal long-sought by the advocates in Baltimore. Once the MTA launched the BaltimoreLink effort it became the goal of advocates to challenge the MTA to produce measurable improvements on key indicators.

On behalf of the Transportation Alliance, we performed an analysis of the change in accessibility under the new plan. Using Citilabs’ Sugar Access tool, we measured the change in access at the individual block level, looking at access to all jobs, as well as access to high-opportunity jobs and access from low-opportunity neighborhoods. We also looked at access to public middle and high schools and grocery stores.

So would it be truly transformative? Would it increase the number of jobs that are accessible to everyday Baltimore residents? Would it provide increased connections to opportunity for a wider range of people?

The short answer is no.

01a.MTA.Bus3.NB.BaltimoreMD.19October2016

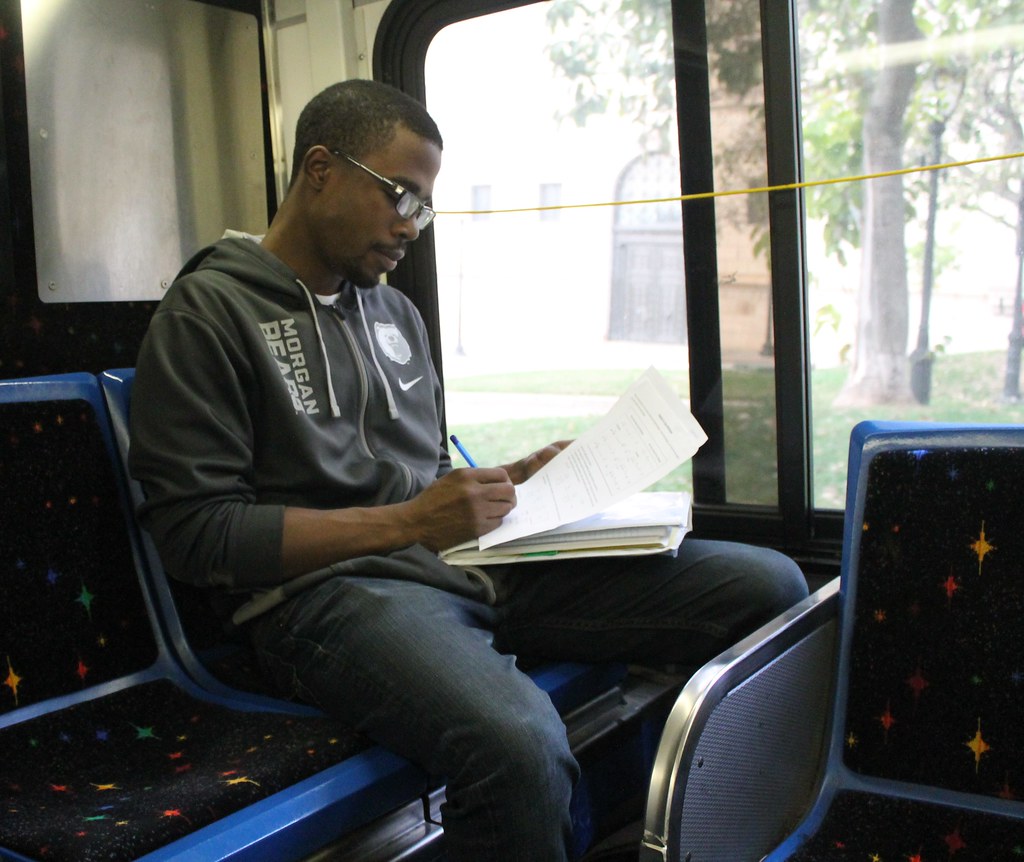
A man studying while on on MTA Route 3 bus on North Charles at Centre Street in Baltimore. Flickr photo by Elvert Barnes

The long answer is that the plan “represents a missed opportunity to address regional goals in connecting households to jobs, schools, and essential services through transit,” according to the Transportation Alliance’s terrific summary of the findings. The bottom line is that BaltimoreLink does not deliver the promised transformational improvements and in contrast to MTA’s claims, we found a sharp decrease in accessibility on weekends (Sunday morning peak) and a marginal increase on weekdays. Read more about the detailed findings in the Transportation Alliance’s executive summary. (pdf)

In response, the administration initially attacked the empirical study, the Transportation Alliance and other local transit supporters. MTA recently released a revised plan which the Transportation Alliance and other stakeholders are reviewing. The MTA will hold public hearings in January, finalize the plan in March and implement the changes in June 2017.

Redeploying routes more effectively would be only one part of any proper solution. The region also needs local oversight in transit planning and an ironclad pledge for coordination between the state and the city to get anywhere near the kinds of benefit that Houston was able to realize. As the Transportation Alliance’s summary goes on to note:

Unlike Houston, Baltimore is an older, dense city where right-of-way is much more limited. Much of BaltimoreLink’s success in terms of speed and reliability hinges on coordination of road space and traffic signals between MTA and the City of Baltimore’s Department of Transportation. [But] without dedicated bus lanes and traffic signal prioritization, the potential benefits of this project may not be realized. It is inaccurate to anticipate reliable, rapid, transit going through downtown without dedicated right-of-way.

Looking ahead

While Baltimore stands to benefit immensely from redesigning its network, the benefits will be limited if the MTA merely reallocates its current resources — the state of Maryland needs to increase their investment in transit to improve service and accessibility for residents.

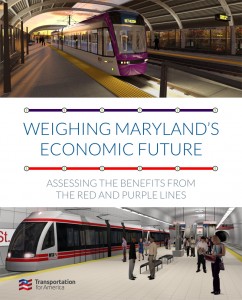
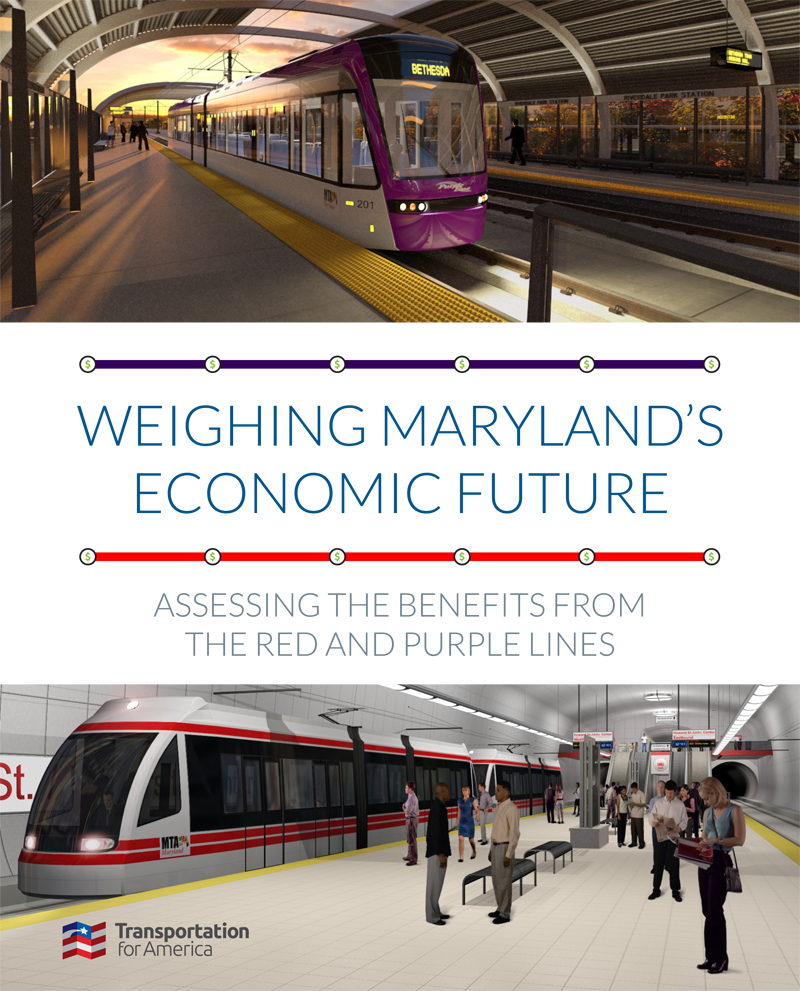
Click tor read our 2015 report analyzing the proposed economic benefits of the Red Line in Baltimore (and the approved Purple Line in the Washington, DC suburbs.)

In 2015, the city was on the cusp of going ahead with the Red Line, a brand new high-capacity rail transit line, which would have resulted in 83,000 more people living near high quality, frequent transit. Now, without that sizable (state and federal) investment represented by the Red Line, they’re on the receiving end of an alternate plan that represents just a 1.5 percent increase in MTA’s annual operating budget — about $70 million over six years; a plan that does little to separate transit riders from traffic congestion or tangibly improve access to jobs and opportunity.

That’s small potatoes, and the state needs to do better.

Maryland’s economic future is tied directly to the performance of their major metropolitan areas. Making smart investments that can increase access to opportunity for more people can help those places prosper, boosting the state’s overall economy in the meantime.

Houston it’s definitely not, but this story isn’t over yet.

What should the next administration do when it comes to transportation?

sga-transition-guide-coverOne of the biggest challenges for the incoming presidential administration is to make the economy work for individuals and families of all income levels. This short new guide of federal policy recommendations is designed to help the new administration accomplish just that.

As part of Smart Growth America, today we’re releasing Expanding the Economic Recovery to All Americans Through Smarter Growth, a short guide from SGA providing concrete recommendations that federal officials in the incoming administration can implement to help grow the middle class, connect more Americans to opportunity and expand opportunities for creating lasting wealth.

DOWNLOAD THE REPORT

This short document covers SGA’s specific policy recommendations within five broad strategies:

  1. Create more housing choices
  2. Connect Americans to opportunity by providing more transportation choices
  3. Empower local communities
  4. Invest in existing communities
  5. Make smarter, more cost-effective investments

T4America’s transportation policy recommendations within this document show how the incoming administration can connect Americans to opportunity by providing more transportation choices, empower and invest in local communities and make smarter, more cost-effective investments.

Indicators pointing to an economic recovery don’t matter if you still can’t get a job, your housing costs are escalating, or the opportunities are drying up where you live. While median household income has risen in recent years, it is still shy of where it was in 2007, adjusted for inflation. And among lower- and middle-income households, it has been slower to rebound. The contentious 2016 election has highlighted deep divisions and shown that there are wide disparities between who is experiencing recovery and who is missing out.

Though they are vital to Americans’ prosperity, the role of housing, transportation, and access to education and job opportunities have been largely missing from any national conversation about boosting wages, expanding the middle class or providing pathways out of poverty.

Smart growth is not a cure-all and the administration should lean hard on other economic, social and cultural solutions. But given the effects of housing and transportation costs on people’s pocketbooks, smart growth strategies — expanding economic prosperity, improving lives by improving the communities that we call home, and creating opportunities for people to have a high quality of life and build wealth — have to be part of the solution.

Join us for the release of Planning for a Healthier Future

2016_0504 Kresge Calthrope PM ReportThanks to 2012’s MAP-21 legislation, all metro areas and states will soon be using a limited array of performance measures. While the in-progress federal requirements will cover a limited range of measures, T4America is releasing a new resource next week to help metro areas find ways to use performance measures to improve public health, address social equity concerns, and advance environmental quality.

Join us next week on Wednesday, June 22 at 4:00 p.m. EDT for a special online discussion about the new report, including firsthand experience from some of the metro regions that participated in a related two-year collaborative — more about that below. Sign up and be the first to get a copy of the Planning for a Healthier Future report in your inbox next Wednesday.

REGISTER NOW


While the federal performance measures currently being developed will cover limited metrics like safety, condition of roads and bridges, or how to measure congestion, this report lays out additional measures that enable MPOs and regions to understand the health impacts of transportation and land use decisions within three other dimensions: physical activity, traffic safety, and exposure to air pollution.

This report is the result of our two-year Planning for a Healthier Future collaborative with teams from the regions of Seattle, WA, Portland, OR, San Diego, CA and Nashville, TN. These four regions are actively working to improve health, increase access to opportunity for vulnerable populations, protect the environment and promote economic competitiveness by developing and implementing transportation performance measures for their respective metropolitan planning organizations (MPOs)

Performance measures and health?

urban design for health transportation impacts health

Cities and regions around the country face important choices about how and where they want to grow, how to connect people to economic prosperity and how to use limited resources to promote healthy communities and provide a great quality of life for all of their residents.

Performance-based planning allows stakeholders and decision-makers to understand how a given investment, policy, or decision “performs” across certain measures over time — providing more clarity and transparency on exactly what state or regional transportation dollars are accomplishing. As a result of the transportation projects that get built, is the air cleaner? Do more people have access to opportunity? Is environmental quality made better or worse? Are the impacts on people’s health — especially vulnerable populations — positive or negative?

This detailed report summarizes current best practices in the development of health, equity and environmental measures that can be used to evaluate the performance of transportation investments at a regional scale. It aims to explore and test a variety of different data-driven measures that can evaluate packages of transportation investments — such as those frequently bundled together by MPOs in transportation plans.

Join us next week to learn more and get your copy!

REGISTER NOW

Kresge Calthorpe report logos

Watch last week’s creative placemaking online discussion

t4 creative placemaking thumb

As part of the kickoff for T4America’s brand new online interactive guide to creative placemaking in transportation, we hosted an online conversation on the topic last week. If you missed the webinar, you can catch up here.

Creative placemaking harnesses the power of arts and culture to allow for more genuine public engagement — particularly in low-income neighborhoods, communities of color and among immigrant populations — in the development of transportation projects.

T4America’s new online interactive guide, The Scenic Route: Getting Started with Creative Placemaking in Transportation, introduces the concept to transportation planners, public works agencies and local elected officials who are on the front lines of advancing transportation projects.

Watch last week’s archived webinar

Participants heard from James Corless, Director, Transportation for America; Erika Young, Director of Strategic Partnerships, Transportation for America; Duncan Hwang, Development & Communications Director, Asian Pacific American Network of Oregon (APANO); Luann Algoso, Community Engagement Manager, APANO; Laura Zabel, Executive Director, Springboard for the Arts; and Jun-Li Wang, Artist Community Organizer, Springboard for the Arts.

In the webinar, APANO shares some of the creative placemaking strategies employed to combat the pressure of displacement anticipated by a forthcoming high-capacity transit project in the Jade District of Portland, OR. Continuing the conversation, Springboard for the Arts discusses its grassroots efforts to advance the community’s vision for the Twin Cities’ Green Line light rail.

Watch the webinar, browse the guide, share it with others, and let us know what you think!

Creative Placemaking Screenshot

Twitter 65pxFacebook 65px

View the Guide

T4America launches a new online guide to creative placemaking in transportation

Today T4America is proud to launch a brand new online interactive guide, The Scenic Route: Getting Started with Creative Placemaking in Transportation. Creative placemaking is an emerging approach to planning and building transportation projects that taps local culture and to produce better projects through a better process.

Creative Placemaking Screenshot

https://t4america.org/creativeplacemaking

After checking out the new guide, be sure to share the news on Twitter and Facebook.

Twitter 65pxFacebook 65px

So what is creative placemaking?

Creative placemaking is a better process for planning and building transportation projects. It’s an approach that deeply engages the arts, culture, and creativity — especially from underrepresented communities — in planning and designing transportation projects so that the resulting communities better reflect and celebrate local culture, heritage and values.

Think of it this way: When anyone begins the process of a transportation project of any size, the first question usually (hopefully!) asked is, “What are we doing and why?”

In a creative placemaking approach, the next question to ask is, “How can the distinctiveness of this place and the people in it contribute to the success of what we’re doing? How can the arts and culture of this place be a part of the process and the final product?”

We wrote this guide to introduce the concept to transportation planners, public works agencies and local elected officials who are on the front lines of advancing transportation projects.

Why we need a better approach to transportation projects

More than ever, transportation agencies need a greater level of support in local communities to make projects happen. Meaningfully engaging the public so they have a say over the project may be a little daunting for public agencies, but it ultimately makes the project more successful — whether a project as basic as the redesign of an intersection or as complex as the construction of a new light rail line.

Building more support by better engaging the public can help avoid 11th hour controversies and build the type of public trust that is more important than ever for advancing ambitious infrastructure plans or winning new revenue for transportation at your city council, the ballot box or in your state legislature.

Creative placemaking harnesses the power of arts and culture to allow for more genuine public engagement — particularly in low-income neighborhoods, communities of color and among immigrant populations — in the development of transportation projects. Forget the traditional, staid public meeting format and instead imagine artists engaging community members using multiple languages to generate meaningful dialogues, capturing their creativity and local knowledge to better inform the ultimate design of the project.

Done right, creative placemaking can lead to both a better process and a better product, in this case integrating community-inspired art into the ultimate design of the project as so many of the case studies in this guide demonstrate.

The end results are streets, sidewalks and public spaces that welcome us, inspire us and move us in every sense of that word. It doesn’t take much to get started, but it does require a new approach to public engagement along with intentional partnerships with artists, arts councils and community-based organizations.

We hope this guide serves as your starting point to a journey that can truly transform your city. Browse the guide, share it with others, and let us know what you think.

Our deepest thanks to the Kresge Foundation for their support in producing this resource.

View the Guide

Dive into creative placemaking with an online discussion about our new interactive guide on 2/17

Join Transportation for America as we release our new online interactive creative placemaking guide, The Scenic Route: Getting Started With Creative Placemaking in Transportation, with an interactive webinar on Wednesday, February 17, 2016 at 3:30pm EST.

creative placemaking twitter

America’s cities, towns and suburbs are rapidly changing and evolving, and transportation investments are playing a catalytic role in transforming communities. But all too often, major transportation projects are disruptive to the surrounding community, and frequently impact or even displace existing residents and businesses.

For those of you planning, designing and building transportation projects, creative placemaking is an emerging approach that every community should consider.

What is creative placemaking? An approach that can lead to better projects and better places, that uses arts and culture to more genuinely reflect what makes a community unique, that builds the kind of trust and relationships between the public and the planners that can make it easier to advance these important projects or the funding required to build them.

Join the kickoff webinar to learn about some of the most exciting placemaking projects in the country. You’ll also get an early copy of the forthcoming guidebook when it’s released. The event will be a chance to ask questions of our placemaking experts. And be sure to share your own successes on Twitter at the hashtag #CPguidebook.

We look forward to having you join us next week!

REGISTER

12 transportation policies states should consider in 2016 to stay economically competitive

To remain economically competitive, states must invest in infrastructure, but state legislatures have a critical choice ahead of them: continue pumping scarce dollars into a complex and opaque system based on outdated policies out of sync with today’s needs, or follow the lead of the states highlighted in Transportation for America’s new report, Twelve Innovations in Transportation Policy States Should Consider in 2016.

State legislatures, as incubators of innovation and more flexible than Congress when it comes to enacting new transportation policies, have a golden opportunity in 2016 to reform their transportation programs to expand transparency and accountability, boost state and local economies, invest in innovation across the state, save the state money and improve safety for the traveling public.

Why this focus on state transportation policy?

Similar to Congress’s action in 2015 with the passage of the FAST Act, most of the 23 states that increased their own transportation funding revenue since 2012 have failed to update the underlying policies governing the spending of those new funds. The distribution formulas for those funds are often relics of decades-old priorities that are out-of-touch with the new needs of increasingly diverse economies and demographics.

T4America’s new report outlines 12 transportation policy solutions recently passed legislatively or instituted through administrative action in states, many of which are being pursued by Transportation for America’s START network members and other key policymakers in 2016.

These dozen policy proposals have shown the ability to:

  • increase accountability and transparency to build taxpayer confidence;
  • make states economically competitive and empower locals to do the same;
  • invest in innovation and reward the smartest projects;
  • maximize savings through better project development; and
  • improve safety through better street design

Considering the fact that the federal program is still largely a block grant given to and controlled by the states, state leadership on transportation issues will be more important than ever in the years to come.

The START Network

T4America supports efforts to produce and pass state legislation to increase transportation funding, advance innovation and policy reform, empower local leaders and ensure accountability and transparency. We do this through our State Transportation Advocacy, Research & Training (START) Network of state and local elected officials, advocates and civic leaders, providing our members easily accessible resources that arm decision makers and advocates with template policies, research and case studies from leaders nationwide. Join the START network today, and share with us any bills in your state legislature that you feel we should be tracking here.

State-level reform will be essential for advancing creative and innovative transportation funding and policy reforms to make the most of limited infrastructure dollars. Get engaged by joining the START Network and get your free copy of the report today.

Join us next week for an online discussion about “Buses Mean Business”

Last week, Transportation for America and Smart Growth America’s transit-oriented development initiative hosted the public launch of new research about bus rapid transit (BRT) lines and their potential for economic development, and next week, we’re inviting all of you to join us for an online presentation of the findings.

The National Study of BRT Development Outcomes, authored by Arthur C. (“Chris”) Nelson and published by the National Institute for Transportation and Communities at Portland State University, was publicly released on Tuesday, January 12 at a live event in Washington, DC.

This new peer-reviewed research provides compelling evidence that BRT systems in the U.S. can indeed generate economic development, attract jobs, retail and affordable housing — at a cost that’s well within reach for many mid-size American cities.

So many people have expressed interest in this research that we’re holding an online version of the kickoff event. Join us on Monday, January 25, 2016 at 3:30pm EST to learn all the details of this new research from the report’s author, as well as what this means for communities considering a BRT line.

brt-online-discussion

All across the U.S., interest in BRT is booming as a smart, more affordable transit option. As of today, more than 30 U.S. regions in at least 24 states are either building or actively considering building new bus rapid transit lines in 2016 and beyond. The new study looks at what these projects could mean for development patterns, housing affordability, and employment and wages in those areas.

Next week’s webinar is a chance to hear all the details of this new research, as well as ask your questions of the report’s author. We’ll be taking questions during the event, as well as on Twitter at the hashtag #BusesMeanBusiness. Register to join us next week — we look forward to talking with you.

New study finds positive economic development benefits associated with bus rapid transit projects

Today T4America unveiled the findings of a new peer-reviewed study that examined existing bus rapid transit (BRT) lines and found strong evidence that BRT systems in the U.S. can indeed generate economic development, attract jobs, retail and affordable housing — at a cost that’s well within reach for many mid-size American cities.

Bus rapid transit is a type of bus service that travels faster and more reliably by providing level boarding, triggering traffic signals, providing pre-board fare payment and running in dedicated lanes separated from traffic, among other typical characteristics. For the first time, a new peer-reviewed research study, unveiled this morning, provides compelling evidence that BRT — often with a price tag far lower than other transit investments — can provide ample economic benefits for cities large and small.

The study, authored by Arthur C. (Chris) Nelson and published by the National Institute for Transportation and Communities (NITC) at Portland State University, was publicly released this morning in an event held by Transportation for America, Smart Growth America’s TOD Technical Assistance Initiative and NITC.

Interested in learning more? Couldn’t make our in-person event today in Washington, DC? We’ll be going over the findings in detail again in an online presentation on Monday, January 25, at 3:30 Eastern time. It’s free and open to all, so register today

All across the US, interest in bus rapid transit is booming as a smart, more affordable transit option. According to data gathered by Yonah Freemark and Steven Vance for Transit Explorer, more than 30 U.S. regions in at least 24 states are either building or actively considering building new bus rapid transit lines in 2016 and beyond.

Bus rapid transit coming soon graphic map

But there have been notable gaps in the research on the possible benefits — until now.

What does the study have to say about the economic benefits of BRT?

BRT encourages new office growth in locations connected to transit.

The areas within a half-mile of BRT corridors increased their share of new office space by one third from 2000-2007, and new multifamily apartment construction doubled in those half-mile areas since 2008. For most areas studied, there was a rent premium for office space within a BRT corridor.

BRT corridors fared better than other areas after the recession.

During the economic recovery following the 2008 recession, these corridors also increased their share of office space by one third, and more higher-wage job growth occurred near BRT stations than occurred in central counties. During the economic recovery, BRT station areas saw the largest positive shift in the share of upper-wage jobs, and employment in the manufacturing sector increased.

“Unlike the presumptions of some, bus rapid transit systems have important effects on metropolitan development patterns,” report author Dr. Arthur C. Nelson said in the study. “At substantially lower costs, BRT generates important and sometimes impressive development outcomes.”

To that end, Mayor Gregory Ballard, the recently departed Mayor of Indianapolis and a guest speaker at this morning’s event, noted that a new bus rapid transit network is one of his city’s primary economic competitiveness strategies.

“170,000 employees work within walking distance of our planned Red Line bus rapid transit service — one out of every five employees in the region,” Mayor Ballard said. “We have existing bus service, but it doesn’t go to where the existing jobs are. Providing a way to connect more people to more jobs in the region via a lower-cost, fast, flexible transportation option like bus rapid transit is a smart economic move to ensure that our growing region prospers for years to come.”

At the event, the Hon. Chris Zimmerman, Vice President for Economic Development at Smart Growth America, referenced work that Smart Growth America performed to quantify those potential economic benefits.

“A fiscal analysis we conducted for Indianapolis showed substantial benefits in terms of municipal revenues and costs if future development could be attracted to areas around their new bus rapid transit stations,” Zimmerman said. “It’s this kind of potential that is generating increasing interest in BRT, especially in mid-size cities.” Zimmerman directs the National Public Transportation/Transit-Oriented Development Technical Assistance initiative which Smart Growth America is leading in partnerships with the Federal Transit Administration.

The Hon. John Robert Smith, Transportation for America Advisory Board Chair, noted that Indianapolis is far from alone, supporting Dr. Nelson’s assertion that BRT could represent a large share of new high-quality transit investment for the next few decades.

“These findings are an affirmation for the scores of other can-do regions that bus rapid transit is a smart investment that can indeed bring tangible economic returns. The mayors and other elected officials I meet with on a regular basis are intensely concerned with connecting their residents to jobs, and evidence like this will bolster their efforts to use BRT as a tool to do so,” Smith added.

The full study can be downloaded here.

—-

The study was published by the National Institute of Transportation and Communities at Portland State University and was funded partially through a grant from Transportation for America. Dr. Nelson, who began the study at the University of Utah’s Metropolitan Research Center, is currently Professor of Planning & Real Estate Development at the University of Arizona.

SGA’s TOD Technical Assistance Initiative is made possible through support from the Federal Transit Administration.

New traffic congestion report raises more questions than it answers

Most people sitting behind the wheel each day won’t be surprised by the findings of the latest edition of the Texas Transportation Institute’s report on urban congestion that shows, once again, that (surprise!) the roads in most major American cities are very congested during rush hour each day. The report’s methodology is flawed, but what really matters most is what policymakers and citizens decide to do about congestion in their communities.

(Updated: 8/27/15 12:15 a.m. with other articles at bottom.) Once again, The Texas Transportation Institute is in the headlines today with the release of their Urban Mobility Report and its Travel Time Index (TTI), which purports to rank metro areas by congestion but is mostly disconnected from what commuters experience on a day-to-day basis.

While TTI is striving to provide easy to understand measures and rankings to the complex issue of traffic congestion, their methodology is once again drawing criticism on a number of fronts.

The report’s touchstone metric is a blunt measure of peak-hour speeds compared to an empty road in the middle of the night. Did you know that trips take longer during rush hour compared to the middle of the night? You did? The comparison of rush-hour to free-flow traffic begs the question about the goal: is it reasonable or even possible to build enough road capacity to keep traffic moving at free-flow speeds from 6-9 a.m. when the bulk of the populace is going to work? (Those free-flow speeds being used as the baseline comparison also exceed the speed limit in many cases, by the way.)

The economist Joe Cortright wrote a comical April Fools post that showed how silly that logic is when applied anywhere else, in this case, at Starbucks, where consumers lose “$4 billion every year in wasted time” because of long lines during busy mornings. Yet:

No one would expect to Starbucks to build enough locations—and hire enough baristas—so that everyone could enjoy the 15 second order times [at 9 a.m.] that you can experience when there’s a lull [at 9 p.m.]. Consumers are smart enough to understand that if you want a coffee the same time as everyone else, you’re probably going to have to queue up for a few minutes.

The report focuses only on drivers — not commuters as a whole. The millions of people using growing modes like transit, walking or biking or skipping the trip entirely by telecommuting at peak aren’t included in the analysis. So when the report says “person” or “commuter,” what they’re really saying is “car commuter.” The nearly 1 million trips taken per day in Washington, DC —#1 on the “list of gridlock-plagued cities — on metro (bus and rail) and therefore not in a car? Not included in this analysis.

Trips not taken can be crucial, yet they’re ignored here. In February 2009, Inrix, the company partnering with Texas A&M on this release, reported that just a 3.7 percent drop in vehicle miles traveled in 2008 resulted in a 30 percent drop in congestion in the 100 most congested metro areas. We don’t need everyone to shift their trip, take transit, move closer to work, or telecommute — among many possible options. But smart investments and incentives that lead to very small reductions in trips taken can have huge benefits in reduced congestion. And they’re often far cheaper than massive projects proposed to shave a few seconds off of average commutes.

Live close to where you work? Oops. Your short commute can come out looking worse than someone else’s much longer commute. TTI completely ignores the actual time and distance of commutes. If you have a 20-minute commute home but move at a lower speed, your commute scores worse than the person driving 80 minutes at a higher speed. Yet who has the better experience each day?

We share a graphic like this almost every time this report comes out, but it’s telling. According to this year’s Travel Time Index, Atlanta (1.24) is actually less congested than Chicago (1.31). Yet…

Chicago Atlanta travel time


In Chicago in 2007, the average peak hour car trip to work was 38% shorter (in time) than the 57.4 minutes it took Atlantans to drive to work in rush hour. Even the average non-peak commute in Atlanta in 2007 was longer than the average congested peak hour commute in Chicago.  A major reason for the better highway performance in Chicago is that drivers do not have to travel as far as drivers in Atlanta – 13.5 miles compared with 21.6 miles. Yet TTI rates Chicago worse.

Ranking congestion is fine, but what should we do about it? How can we manage congestion in the most cost-effective way possible given limited transportation dollars?

Doing more of the same certainly won’t solve the problem. Regions that have been aggressively investing in additional travel options, eliminating trips, reducing trip length, creating more places to live close to jobs or more effectively managing demand have seen their congestion numbers get better, according to this landmark CEOs for Cities report from a few years ago.

That’s why it’s so critically important that the rule for the congestion performance measure being developed by USDOT measure success (or failure) in ways beyond just this limited and flawed TTI measure. We do need a better measure of congestion if we want to avoid making the same decisions that got us into this mess.

How far do most people have to travel for work? How long does it take them? What is most effective at reducing the amount of time it takes to get places? How many people are exposed to the congestion? Congestion may be bad, but people telecommuting, in a vanpool or on a bike might not experience it. Credit should be given to areas that allow people to opt-out of the traffic. Those are the kinds of metrics we need to use in order to find real solutions.

The proposed rule for congestion being drafted right now by USDOT will lay out exactly how states and metro areas will have to begin measuring congestion — and measuring whether or not the projects they want to build will improve it. We’ve got some posts in the works that will discuss how some alternatives would work, so stay tuned on that front.

Updated: The quotes from the report’s author in this WAMU story from Washington, DC essentially acknowledge that their report is a limited measure of congestion, largely because it only focuses on auto commutes and ignores essentially everyone else.

In response to the coalition’s criticism, Lomax conceded the report’s methodology does not take into account non-car commuting modes.

“They have some good points,” Lomax said. “And they are points that we have included not only in our proposed solutions, but also in terms of our methodology.”

“We have backed away from trying to make estimates of what is happening on the transit side because we don’t have very good transit data. We don’t have good data about how people are walking. So we concentrated on where we have the data,” he said.

Here’s a sampling of other articles questioning the measures in the report and suggesting some better ways to measure a more accurate picture of congestion.

Transportation for America takes a look at the options for funding transit in St. Louis

St. Louis’s economic prospects are directly related to the quality of access to transportation for their residents — making new investments in public transportation essential. A new T4America report analyzes the possible ways that the St. Louis region could fund an expansion of their public transportation network.

STL-top-of-arch

This report was commissioned and released by Citizens for Modern Transit, a St. Louis-area nonprofit that supports the creation of an integrated, affordable and convenient public transportation system in the area.

Though the St. Louis region is considering several proposals to dramatically expand or improve the region’s public transportation, the bottom line is that these projects are often expensive, funding is scarce, the state may not be interested in investing in transit at all, and the uncertainty stemming from congressional inaction has only made things worse.

St Louis report coverLike most metro areas these days, St. Louis does not possess a single regional organization or government that can singlehandedly fund any of their planned major transit projects; and just one or two funding sources are rarely enough to make these projects happen in any case. (The same can be said of most major transportation projects, whether roads or transit. But states more often decide to underwrite major local road projects.)

Many regions have successfully built new transit projects by creatively piecing together funding through a variety of sources from all levels of government, along with a variety of private sources. This new report analyzes various options for funding transit at the federal, state and local level, including ways to combine various sources of funding, to build projects from large rail projects to less expensive bus or bus rapid transit projects. It also provides examples from across the nation of actual projects built using each funding mechanism raised to illustrate how each can be applied.

To bring the issue home in St. Louis, the report also analyzes two projects currently under consideration in the St. Louis region: a new 17-mile light rail line from North St. Louis to downtown and a 23-mile highway-running BRT line along I-64 ending downtown. The report considers ways to mix and match funding from federal, state and local sources to bring projects like these to fruition in the near future.

Transportation for America undertook this analysis under our new consulting practice led by our Beth Osborne, formerly the Acting Assistant Secretary for Policy at the U.S. Department of Transportation. The goal of this kind of work is to take Transportation for America’s national research and make it practical and actionable for the local leaders clamoring to invest in their communities by making smart transportation investments.

If you’re interested in a similar analysis for your region or discussing other consulting opportunities, please get in touch with us.

New Smart Growth America report details why so many companies are moving downtown

Launched at a terrific event at Washington, DC’s Newseum just this morning, Core Values, a first-of-its-kind report, is stuffed with useful data on nearly 500 companies that have decided to either move from the suburbs to a downtown location, or that have decided to expand or open a new branch in a downtown core.

The companies featured in the report — highlighted by quotes from more than 40 interviews with executives — shared some unifying threads in their decision-making process: the desire to take advantage of the collaborative and cultural opportunities that downtown locations offer, the desire to stay competitive for younger, talented workers, and the ability to give their employees multiple transportation options for getting to work each day.

It’s a trend that we’ve been keeping our eyes on in this space over the last year, like our story about State Farm’s decision to consolidate their employees in three new regional hubs near transit, the ambitious plans of three mid-sized cities that focus on transit as a core economic development strategy, or Marriott’s clear intention to move their headquarters to a location near to transit when their current lease is up.

Smart Growth America takes these stories to a new level, pairing that sort of anecdotal data above with some hard research and in-depth interviews of company executives into one comprehensive report on the trend; showing why companies are making the move and providing recommendations for other companies hoping to do the same — or cities hoping to lure them in.

As Chris Zimmerman wrote today on the SGA blog:

Core Values CoverIn 2010, global biotechnology company Biogen moved its offices from downtown Cambridge, MA, to a large suburban campus in Weston, 25 minutes away. In 2014, less than four years later, the company moved back.

“There is so much going on in Cambridge,” said Chris Barr, Biogen’s Associate Director of Community Relations. “It is such a vibrant place to live and work—it’s been a great move back for us.”

Biogen is one of hundreds of companies across the United States that have moved to and invested in walkable downtowns over the past five years. Our newest research takes a closer look at this emerging trend.

Core Values: Why American Companies are Moving Downtown is a new report released today by Smart Growth America in partnership with Cushman & Wakefield and the George Washington University School of Business’ Center for Real Estate and Urban Analysis. The new report examines nearly 500 companies that moved to or expanded in walkable downtowns between 2010 and 2015, and includes interviews with more than 40 senior-level staff at those companies.

The results provide an overview of why these companies chose a walkable downtown and what they looked for when considering a new location. The report also includes ideas for cities about how they can create the kinds of places these companies seek.

View the report

The Baltimore Sun agrees: Baltimore needs the Red Line

Yesterday, The Baltimore Sun editorial board heartily affirmed the necessity of the Red Line for Baltimore’s future, calling it “the economic shot in the arm” that the city needs and urging Maryland Gov. Larry Hogan to approve both it and the Purple Line project in the DC suburbs. 

The editorial talks about the benefits of building the light rail line through west Baltimore — cleaner air, less cars on the road, access to jobs for the city’s low-income residents — and asks Gov. Hogan the question: “Why worsen the outlook for Baltimore area business growth by canceling the Red Line?”

Baltimore residents have already made considerable sacrifice to pave the way for the Red Line, the 14.1-mile-long east-west line that would connect Woodlawn with Johns Hopkins Bayview by way of downtown Baltimore. City lawmakers agreed to a higher gas tax, local governments have committed to $280 million in combined contributions, and soon, Maryland Transit Administration systems will be charging higher fares as required by the state legislature.

This city needs the economic shot in the arm that would come from the addition of the Red Line. West Baltimore, ground zero for the recent protests and unrest that arose after Freddie Gray’s death, would stand to benefit from the multi-billion-dollar investment in transportation infrastructure. Thousands of jobs would be created. What a vast improvement over the yawning “road to nowhere” canyon that continues to haunt that side of the city, the result of a failed freeway project.

The editorial mentions the success of the MARC commuter rail service as an example of the potential benefits that can come from expanded transit service. The MARC trains used to operate only on weekdays between DC and Baltimore, but the rail line recently started running trains on weekends, taking cars off the busy Baltimore-Washington Parkway and Interstate 95 during the weekends and providing another travel option.

The editorial closes with some figures from T4America’s Maryland transit report released last week, as well as an overall reason why the Red Line is so important to Baltimore:

But don’t take our word for it, ask the business community. The Greater Baltimore Committee and others have been leading the charge for the Red Line for years. They don’t want a handout, they want a level playing field. …What would the Red Line do for Baltimore? A recent Transportation for America report estimates 15,000 jobs and $2.1 billion in increased economic activity. The Purple Line exceeds that with 20,000 jobs and $7 billion in economic activity, according to the non-profit organization of business, elected and civic leaders. The timing could hardly be better. For a city at risk of drowning in despair, Mr. Hogan’s approval of the Red Line looks like a real life preserver.

Read the rest of the Sun editorial here, and if you missed it, download the full Maryland report.

Maryland Transit Report cover

The Red & Purple transit lines in Maryland would position Maryland for long-term economic success

Drawing from experience across the nation, a new Transportation for America report attempts to assess the full range of potential economic benefits from the planned Red and Purple transit lines in Maryland. The key finding: With benefits that far outweigh the costs, these two lines would help position Maryland for economic success in ways that few other investments are likely to do.

Maryland Transit Report cover

Send a message to Governor Hogan urging him to approve the two projects.

Send A Message

At a time when competitor regions are moving forward with their own ambitious transit plans and companies and workers alike are being drawn in increasing numbers to walkable locations with high-quality transit, Maryland Governor Larry Hogan will soon be deciding the fate of two long-awaited transit projects in Baltimore and the suburbs of Washington, D.C.

Much ink has been spilled on the costs of the projects, but what about the potential benefits?

There are the short-term benefits as construction starts, workers are hired, materials are produced and sourced, and these large multi-year investments get underway; and there are the long-term benefits like the tens of thousands of additional jobs newly accessible by transit, the tens of thousands of people that have access to high-quality rail transit that did not before, and the development made possible by the dozens of stations on these new lines.The benefits to both the Washington and Baltimore regions are significant:

  • Building the projects would give 174,000 additional Maryland residents access to frequent, high-quality transit.
  • These two lines will help dramatically expand the labor and customer base for Maryland businesses. 540,000 jobs will be accessible via high-quality rail transit following construction.
  • The two new transit lines would generate 35,440 direct & indirect jobs and make a total $9 billion economic impact.

Gov. Hogan has stated his commitment to making Maryland “open for business” and prioritizing economic development around the state. How better to do that than by taking strong steps to keep the two largest regions in the state competitive for decades to come?

In March, the CEO of Marriott International, currently headquartered in Bethesda, Maryland in Montgomery County, shared the news with the Washington Post that they would be looking to relocate when their current lease is up.What’s their primary prerequisite for their new location? “I think it’s essential we be accessible to Metro, and that limits the options,” said CEO Arne Sorenson. If the Purple line gets built as planned, Montgomery and Prince George’s counties would see their total number of Metro stations nearly double, from 26 to 47. Wouldn’t it be smart for Maryland to double the options to retain employers like Marriott?

This is a recurring theme we’ve heard in meetings with mayors, chamber officials, and other civic leaders across the country. Making smart investments in transportation, and especially in transit, is a crucial part of their strategy to stay competitive and attract the talented workforce that is increasingly seeking out jobs and homes in walkable, connected cities and neighborhoods.

In Baltimore, the east-west Red Line would help turn a disconnected pair of existing transit lines into a proper system, connecting the hub of jobs at Johns Hopkins, the University of Maryland Baltimore County, the downtown office core, and the residential neighborhoods all along the line — including some of the West Baltimore neighborhoods that could use the investment and connection to opportunity that a new transit line provides.

There’s nothing else in the plans in Maryland’s future that could bring the kind of long-term economic benefits to the state as these two transit projects could. Yes, both are expensive, but the benefits of each will far outweigh the costs — to say nothing of the heavy costs of inaction.

Several years ago, with the Purple line delayed once again, the Washington Post ran these ads in D.C.

Whatever Happened to Purple Line
Thanks to Richard Layman for the use of this photo. http://urbanplacesandspaces.blogspot.com

It would be a shame to see ads like these again in ten or 20 years as we regret these missed opportunities. Tell Governor Hogan that you support both of these projects by sending him a letter.

‘Speak up for transportation’: Analyses show the devastating impact of federal cuts

Congress has seen various proposals floated to scale back federal investment in transportation, from cutting out transit funding to ending the federal gasoline tax and shifting full responsibility to the states. We decided to take a look at what that latter move would mean for taxpayers, who would have to make up the difference in each state or accept multi-million dollar decreases in funding and deteriorating conditions on an annual basis.

Tease-State Gax Tax Increases Required Tease-State Gax Tax Revenue losses per capita

The bottom line: All states would have to raise their per-gallon gas taxes more than the federal rate of 18.4 cents to replace the lost revenue — and many states would have to raise theirs by much more. Click through to see the full analysis with graphics and data for all 50 states

There’s a reason you don’t hear state politicians calling for the end of the federal transportation program and the gas tax. That’s because every single state receives more in federal transportation funds than they pay into the federal system — in part because Congress has been transferring billions from the general fund to make up for slackening gas tax receipts and the fact that the gas tax hasn’t been raised in more than two decades.

At least 16 states have moved to raise their own transportation revenues since 2012, leading some in Congress to claim that those moves show states would be fine with accepting the full burden.

But ending federal support would be a nightmare for governors and legislators, who would have to choose between slashing repair and investment or trying to push through massive tax increases to replace federal revenues.

(The Transportation Construction Coalition released a similar analysis a few weeks ago, but, unlike the analysis here, it did not include the 20 percent of the transportation program that supports public transportation. -Ed.)

According to our full analysis: (See columns 2-3 in the table)

  • 19 states would have to raise their gas taxes by at least 25¢ per gallon, over 36 percent more than the current 18.4¢ federal rate.
  • Vermont would have to raise the state gas tax by 50¢ per gallon to break even – and that’s on top of a recent increase lawmakers passed to add the equivalent of 6.5¢ to each gallon of gas.
  • New York, which receives the highest amount of transit funding in the country, would have to raise the state gas tax by 40¢ to keep the same amount of transit money flowing into their highly-used systems.

Even if states only raised their gas taxes the equivalent of the 18.4¢ federal tax, our calculations also show that: (See column 4-5 in the table.)

  • States collectively would lose out on $8.47 billion (according to data from fiscal 2014);
  • Missouri, currently attempting to raise additional state funding to address an already large budget hole, would need to raise $144 million each year on top of their current needs;
  • New Jersey, facing the imminent bankruptcy of its state transportation trust fund, would also have to find an additional $373.6 million;
  • California would lose nearly $1 billion ($970.5 million, to be exact).
  • In Wyoming, where lawmakers just passed a 10-cent gas tax increase expected to generate $72 million per year, they’d be almost back to square one, losing $57 million.

States also would fare poorly under proposals to eliminate federal contributions for public transportation, as two proposals in Congress would do, according to an analysis out today from the American Public Transportation Association. From their release:

The analysis shows that proposals to cut federal funding for public transit would result in an average 43 percent reduction in a community’s capital improvement funding. Overall, the loss of federal capital and operating funding would put at risk more than $227 billion in economic activity over six years. … Small and rural communities would be aversely affected because a greater percentage of their total funding is from the federal government.

No matter how you slice it, dramatically reducing federal dollars, whether for roads or transit, would have devastating impacts on state’s population centers – the places where commerce happens and revenues are generated. Going in the other direction however, by increasing investment available to states and local communities, would help keep roads and transit in good repair while we build for the future economy.

Read our full analysis, including graphics and sortable data for all 50 states.

Share this


This post and analysis is part of “Stand Up for Transportation” day today. Find out more and get involved here: http://standup4transportation.org/

New T4A report out today: Measuring What We Value

With pressure mounting to ensure our limited transportation dollars go as far as possible, a new report out today from Transportation for America takes a close look at the growing trend of using performance measures to establish clear priorities and better measure the success of our transportation investments.

First, it’s not too late to join us for the launch webinar this afternoon (Tuesday March 3rd) at 3:30 p.m. EST.

Register for Webinar

Secondly, this short report, featuring an introduction from former US Secretary of Transportation Ray LaHood, is live and available now on our website, so go and download your copy now.

Performance Measures Report Cover

Now available at https://t4america.org/maps-tools/performance-measures-report/

How do we justify transportation expenditures? To many people, the perception is that project decisions are made in a murky, mysterious process, or, even worse, through a political process where only the projects with the most connections get funded. Further, it is not clear to the average person what all the spending gets them. With public confidence in government at low levels, it’s more important than ever to quantify the public benefits of transportation investment and let voters know what their money is going to buy — especially when attempts are being made to raise new money for transportation to fill the gap.

Transitioning to a more performance-based system of transportation investment was one of the key reforms of MAP-21 and could represent a sea change in how funding decisions are made and our transportation system performs.

This report and recommended framework looks at the innovative DOTs and MPOs experiencing early successes in measuring the performance of their transportation system and making investments based on getting the best bang for the buck, and also lays out smart recommended goals and measures from T4America for making this transition.

Download your copy today.


Share this report with others:

email65px

UPDATE: Better bang for the buck — learn more about performance measurement

UPDATE 2/18/15: The release webinar has been rescheduled for March 3, 2015 from 3:30-4:30 p.m. EST. The report release and webinar were delayed due to rough winter weather. The registration link is once again active, so go ahead and register today!


Performance Measures Report CoverDeveloping a better system to measure the performance of our transportation spending is an idea that’s gaining momentum, and we want to help you be on the cutting edge. 

On [UPDATED] Tuesday, March 3, Transportation for America is releasing a new report on performance measures called “Measuring What We Value: Setting Priorities and Evaluating Success in Transportation.” To accompany the release and help explain an issue that’s even more wonky than other issues in the world of transportation planning — we’ve organized a helpful webinar on March 3rd from 3:30-4:30 p.m. EST.

We’ll discuss the report, hear experts explain the benefits of measuring the performance of our transportation spending and share some examples of real-world success. Register now.

Those presenting during the webinar include:

  • Beth Osborne, Senior Policy Advisor for T4America, formerly Deputy Director for Policy at USDOT.
  • Matt Carpenter, Director of Transportation Services, Sacramento Area Council of Governments (SACOG)
  • Jim Hubbell, Principal Planner, Mid-America Regional Council (MARC)
  • Erika Young, Director of Strategic Partnerships, T4America

Register for Webinar

Why is this report necessary?

How do we justify transportation expenditures? To many people, the perception is that project decisions are made in a murky, mysterious process, or, even worse, through a political process where only the projects with the most connections get funded. Further, it is not clear to the average person what all the spending gets them. With public confidence in government at low levels, it’s more important than ever to quantify the public benefits of transportation investment and let voters know what their money is going to buy — especially when attempts are being made to raise new money for transportation to fill the gap.

Transitioning to a more performance-based system of transportation investment was one of the key reforms of MAP-21 and could represent a sea change in how funding decisions are made and our transportation system performs.

This report looks at the innovative DOTs and MPOs experiencing early successes in measuring the performance of their transportation system and making investments based on getting the best bang for the buck, and also lays out smart recommended goals and measures from T4America for making this transition.

Click here to be notified about the report’s release on March 3rd and sign-up for our newsletter to stay up-to-date on all report releases.

States already scaling back planned work for next year in anticipation of funding crisis

Congressional inaction on saving the nation’s transportation fund would have tangible impacts on projects planned for next year and beyond, forcing many long-awaited projects to halt indefinitely as soon as this summer. Numerous states are already beginning to make plans for a year where no federal money is available for new projects by scaling back plans and tentatively canceling projects.

The report we released yesterday makes it clear: Starting this fall, every dollar of gas tax revenues collected will be needed to cover the federal share of projects already promised to states, regions, and transit agencies. That means no new projects with a significant federal share will be able to get underway in the new fiscal year which begins this October.

Some states are doing their due diligence and preparing plans and budgets for next year in light of the possible reality of no new money to invest in transportation projects that require a federal share or matching funds.

Tennessee stops work on new projects 

Because of uncertainty about future federal funding, the Tennessee Department of Transportation has already halted engineering on new projects for next year (and beyond).

TDOT Commissioner John Schroer reports that with a loss of federal dollars, the department would need to pare back its plan to work “exclusively on the maintenance of our existing pavement and bridges rather than new projects.” Limited funding could jeopardize projects that many regional leaders have planned to limit congestion and maintain quality of life as population booms.

Arkansas bears up under bad bridges, needed maintenance

Ten bridge replacement, road repair and highway expansion projects set to go forward this summer have already been pulled by the Arkansas State Highway & Transportation Department because of uncertainty about federal reimbursement. Arkansas has nearly 900 structurally deficient bridges that carry a total of more than 1.5 million vehicles a day.


Those are just two of many stories we’ve heard about the real impact in states and local communities if Congress fails to rescue the nation’s transportation fund. But they need to do more than just save the transportation fund. The local leaders we’ve been speaking with have made it clear that if Congress wants support for raising more revenue for transportation, they need to give these folks at the local level more reasons to believe that it will be to their benefit.

Last week we released a policy road map showing how we can resuscitate and reinvigorate the program in exciting ways, so that it better suits the needs of people in the communities where they live. That’s a great place to start.


We’ve had terrific response already to this new report, but help us spread the word! Links to share are below, and be sure to view the report if you haven’t already.

Fiscal Cliff Promo Graphic

Download the Report Visit the Report Home

Crucial transportation projects could be halted if Congress fails to act

Barring congressional action, the nation’s transportation fund will be insolvent later this year and the federal government will be unable to commit to funding any new transportation projects next year. This would have significant impacts on projects that have been planned years in advance across the country.

As the report we released this morning makes abundantly clear, starting this fall, every dollar of gas tax revenues collected will be needed to cover the federal share of projects already promised to states, regions, and transit agencies. That means no new projects with a significant federal share will be able to get underway in the new fiscal year, which begins this October.

What does that really mean for projects around the country? We asked around to a few of the many elected officials and business/civic leaders we’ve been talking to over the last couple of years and found a few specific examples of the types of projects that would stop in their tracks in FY2015 if Congress does nothing to rescue the nation’s transportation fund.

Bridge out ahead – Boise, Idaho

The Broadway Bridge in downtown Boise (pictured below) has the lowest structural rating of any bridge in the state of Idaho. (Deficient bridges are something we know a thing or two about around here.)

On game days at Boise State University right on the south side of the Boise River from downtown, thousands of people crowd the narrow 4-foot sidewalks to cross the critical choke point for traffic in the area on their way to and from the famous blue turf. Given its degraded and deficient condition, the bridge could require weight restrictions or closure at any time — one of the perils of continuing to operate a deficient bridge that’s past its recommended lifespan.

broadway bridge boise idaho

The Broadway Bridge replacement, scheduled for 2015, is one of just a few new construction projects in a state transportation plan dedicated almost entirely to maintaining existing roads.

The Idaho Transportation Department is partnering with the city of Boise on the design to ensure the new bridge serves the needs of city residents and will enhance the neighborhood — as well as the needs for regional connectivity on an important artery through the city. Sidewalks will be expanded to 10 feet and bicycle lanes will be added on the bridge and adjoining sections of Broadway Avenue and there will be new connections to the Greenbelt, a regional recreational trail that passes under the bridge.

Aerialwalltexture1

Because the insolvency of the trust fund would mean that no new transportation projects with a federal share could break ground in FY2015, the much-needed Broadway Bridge project would come to a halt.

Columbus, Ohio: Waiting on the bus

CC photo by Derek Rust /photos/drust/181587661

Passengers pack an existing COTA bus line in Columbus, Ohio.

Columbus, Ohio, home to a major university and Ohio’s state government, is a growing region with a projected 22 percent growth in transit ridership this decade.

To accommodate the growing demand, the Central Ohio Transit Authority has been planning to add 29 new buses to its fleet in 2015, replacing some of its dilapidated buses and adding 12 buses to the peak-time fleet. New buses are critical to get residents across the region to work.

Residents in the region support their community’s transit service through a voter-approved local sales tax and the agency is using primarily local funds to rehab a garage to service the new buses. But the agency is counting on the expected federal matching funds to purchase the new buses that they need to meet their needs. In addition to adding service on existing routes, COTA is planning the region’s first bus rapid transit corridor on Cleveland Avenue.

Those are just two of the many stories we’ve heard of important projects that would come to a stop if Congress fails to rescue the nation’s transportation fund.

But they need to do more than just save the transportation fund. The local leaders we’ve been speaking with have made it clear that if Congress wants support for raising more revenue for transportation, they need to give these folks at the local level more reasons to believe that it will be to their benefit.

Last week we released a policy road map showing how we can resuscitate and reinvigorate the program in exciting ways, so that it better suits the needs of people in the communities where they live. That’s a great place to start.

—-

Fiscal Cliff Promo Graphic

Download the Report Visit the Report Home

When the trust fund goes bust: Report shows how much your states and city will lose

Photo via WSDOT/Flickr https://www.flickr.com/photos/wsdot/8670279118

Unless Congress adds new revenue to the nation’s transportation trust fund, the federal government will be unable to commit to funding any new transportation projects, depriving states and localities of resources critical to maintaining and improving the infrastructure that makes our economy possible.

Photo via WSDOT/Flickr httpswww.flickr.com/photos/wsdot/8670279118

The idea of getting any new projects underway in FY 2015 (like this ongoing project in Washington State) could be history without a fix for the trust fund.

America is at a crucial decision point for transportation. The nation’s transportation trust fund is facing a crisis. The gasoline tax that has sustained the federal transportation program since the middle of the last century is no longer keeping up with investment needs.

Transportation for America has released a new report that shows the tangible financial impact that the trust fund’s expected insolvency would have on state and local transportation budgets beginning in the upcoming fiscal year.

But there is a ray of light: The crisis presents an opportunity, because it comes at the same time as Congress must update the federal transportation program, MAP-21. Last week we released a policy road map showing how we can resuscitate and reinvigorate the program in exciting ways, so that it better suits the needs of people in the communities where they live. Absent such action, though, the bottom line is a bleak one: Starting this fall, every dollar of gas tax revenue collected will be needed to cover the federal share of projects already promised to states, regions, and transit agencies, according to the Congressional Budget Office.

That means new transportation projects with a federal share will be shelved — perhaps indefinitely — starting as soon as this summer.

The End of the Road? The looming fiscal disaster for transportation covers the crisis in detail, complete with tables of the exact amounts states and urban areas stand to lose, and the share of state transport budgets that federal funding represents.

While every state raises their own transportation funds through some taxing mechanism and local governments contribute their own funds, federal funds account for the lion’s share of many major projects in the country, from a key bridge replacement or highway rehab to new rail cars and buses. Federal dollars account for half or more of the transportation capital budget in all but 15 states, and for many the share is two-thirds or more. (It’s more than 90 percent in Alaska and Rhode Island, for example.) Metro regions like Miami, Seattle, Atlanta, Denver, Dallas, Philadelphia, Minneapolis-St. Paul – to name just a few – could be out $100 million or more.

We’ll be featuring some of the key projects that could be shelved and states that are scaling back their transportation plans throughout the course of today and tomorrow. There are surely hundreds if not thousands of affected projects all across the country.


Fiscal Cliff Promo Graphic

Download the Report Visit the Report Home