
Ask USDOT to #MakeMeCount this Bike to Work Day

This Friday, thousands of people across the country will put on their helmets and take to the streets for National Bike to Work Day, an annual event promoting active commuting options and safer streets. 

CiGfqFXUgAArtpOWill you be joining the event this week? If so, make your ride even more impactful by telling USDOT to #MakeMeCount and look at people, not just vehicles, when it comes to measuring how well a street works.

More and more Americans are choosing to bike — as well as walk, take transit, or share a ride — to work each day. Yet a recent USDOT proposal for measuring traffic congestion would ignore all these people when evaluating whether a street is working well or not.

If you bike to work this week, snap a photo and share it on Twitter or Facebook with the following text:

Hey @USDOT, I biked to work today! #MakeMeCount when measuring congestion. http://bit.ly/make-me-count #BTWD2016
Twitterlogo

USDOT’s proposed rule would make driving fast the ultimate goal of our transportation system—regardless of what type of street you’re on. That means driving fast could take precedence along streets where children are walking or commuters are biking, as so many people will be doing this week.

Don’t plan to bike this week but still support streets that work for everyone? Sign the petition to USDOT and then help spread the work with our gallery of shareable images.

I’ll be asking USDOT to #MakeMeCount this Friday. I hope you’ll join me.

When it comes to traffic congestion, we need to measure more than just vehicles

UPDATE:

The comment period closes Saturday, August 20th but we are sending in all of your comments to USDOT on Friday, August 19th. If you haven’t sent in a letter yet, you can do that right here.

Last week, USDOT issued a draft rule that will govern how states and metro areas will have to measure and address congestion, along with other metrics like freight movement and emissions. However, the rule as it is currently written would measure success in outdated ways. Old measures leads to old “solutions,” like prioritizing fast driving speeds above all other modes of transportation and their associated benefits.

Congestion We All Count

The comment period is finally open: So tell USDOT to take a wider view of success and change the proposed rule.

The rule as it is currently written fails to consider people taking transit, carpooling, walking, and biking. It would also penalize communities where people live close to work, or travel shorter distances at slower speeds.

This rule makes driving fast the ultimate goal of our transportation system, regardless of what type of road you’re on. Should driving fast be the highest priority on our main streets where people might be shopping or dining at an outdoor café? Should that be the priority in residential neighborhoods where children might be biking or walking.

Photo by NACTO. httpswww.flickr.com/photos/nacto/14442453218Of course not.

Success is about a lot more than moving cars fast. Tell USDOT to improve their proposed rule. Sign an individual letter that we will deliver on your behalf to USDOT.

This rule is particularly disappointing in light of Transportation Secretary Anthony Foxx’s unprecedented effort to improve Americans’ access to economic opportunity through better transportation options. Those are worthy goals, and passing the rule as currently written would be a missed opportunity to achieve them.

Deciding what projects we consider “successful” will influence which transportation projects are selected and built for years to come.

Tell USDOT that #WeAllCount and that the new rule should reflect that.

Join us as we break down FHWA’s most recent rulemaking on measuring traffic congestion

Do you want a transportation system that makes you count? Join Transportation for America for a free, public webinar on Wednesday, April 27 at 1:00 p.m. EST to discuss the recently announced Federal Highway Administration (FHWA) national transportation performance rulemaking on measuring traffic congestion and its implications for communities nationwide.

For the first time, USDOT has released new requirements for how states and metro areas will have to measure traffic congestion. However, the rule as proposed doubles down USDOT’s focus of prioritizing single occupancy vehicles over multi-modal solutions and completely discounts non-vehicular users. How we measure congestion matters, and this rule applies to the lives of all who use our transportation system.

Joe McAndrew, T4’s Policy Director, will cover what’s in FHWA’s performance rulemaking, a few high-level first principles to guide change, and how civic, business and elected groups can impact the outcome of this rulemaking.

Register for Webinar

There’s a direct connection between how we decide to measure congestion and how we choose to address it. If we focus, as this rule does, on keeping traffic moving at a high rate of speed at all times of day on all types of roads and streets, then the result is easy to predict: our solutions will prioritize the investments that make that possible, regardless of cost vs. benefits or the potential impacts on the communities those roads pass through.

Sign up for Wednesday’s discussion, and in the meantime, here are ten things you should know about this new rule and what you can do about it.

Ten things to know about USDOT’s new proposal for measuring traffic congestion

For the first time, USDOT has released new requirements for how states and metro areas will have to measure traffic congestion. While the new rule marks a continued, necessary shift to assessing what our federal transportation dollars actually accomplish, this proposal as introduced doubles down on outdated measures of congestion that will push local communities to spend billions of dollars in vain attempts to build their way out of it.

For two years, USDOT has been working to establish a new system of performance measures to help govern how federal dollars are spent and hold states and metro areas accountable for making progress on important goals. This proposal for congestion (and several other measures focused on “system performance”) is the last of three sets of new Federal Highway Administration (FHWA) rules that will be finalized in early 2017.

Though this represents an incredibly important and necessary shift toward measuring what our transportation spending actually accomplishes, using the wrong measure for congestion will help advance projects that divide communities, cut people off from opportunity, and cost billions of dollars (we don’t have) in the name of solving “congestion” by trying in vain to keep traffic moving.

As we laid out in our post on congestion last week, how we measure congestion matters.

There’s a direct connection between how we decide to measure it and how we choose to address it. If we focus, as this rule does, on keeping traffic moving at a high rate of speed at all times of day on all types of roads and streets, then the result is easy to predict: our solutions will prioritize the investments that make that possible, regardless of cost vs. benefits or the potential impacts on the communities those roads pass through.

Here are ten things you need to know about this new rule from USDOT and what you can do about it


#1 The rule undermines Secretary Foxx’s unprecedented effort to connect communities and use transportation to give people greater opportunities

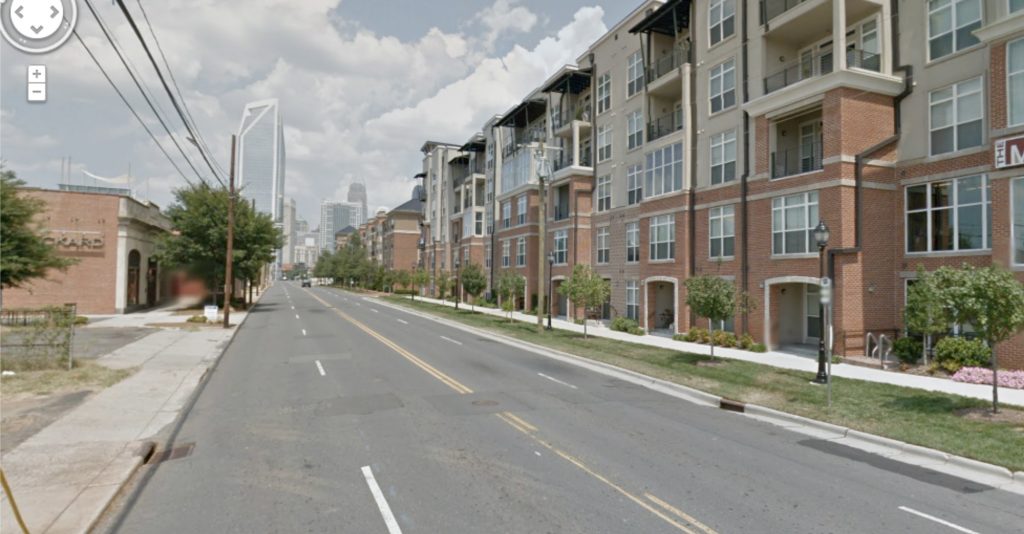
Transportation Secretary Anthony Foxx recently launched a campaign based on the stunning admission that federal policy had long incentivized poorly designed highways that isolated communities and cut people off from jobs and opportunities.

Springing out of powerful personal examples he saw firsthand growing up in Charlotte when new freeways were built “to carry people through my neighborhood, but never to my neighborhood,” he expressed his firm commitment to ensuring that our transportation investments connect more people to opportunity and knit communities together — rather than divide them.

crestdale drive charlotte interstates congestion rule

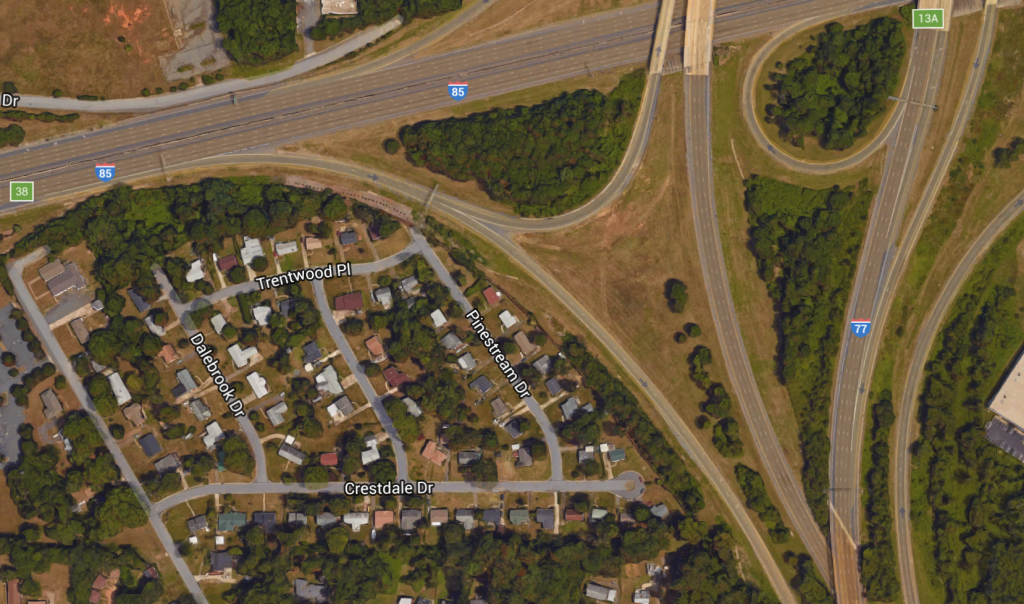
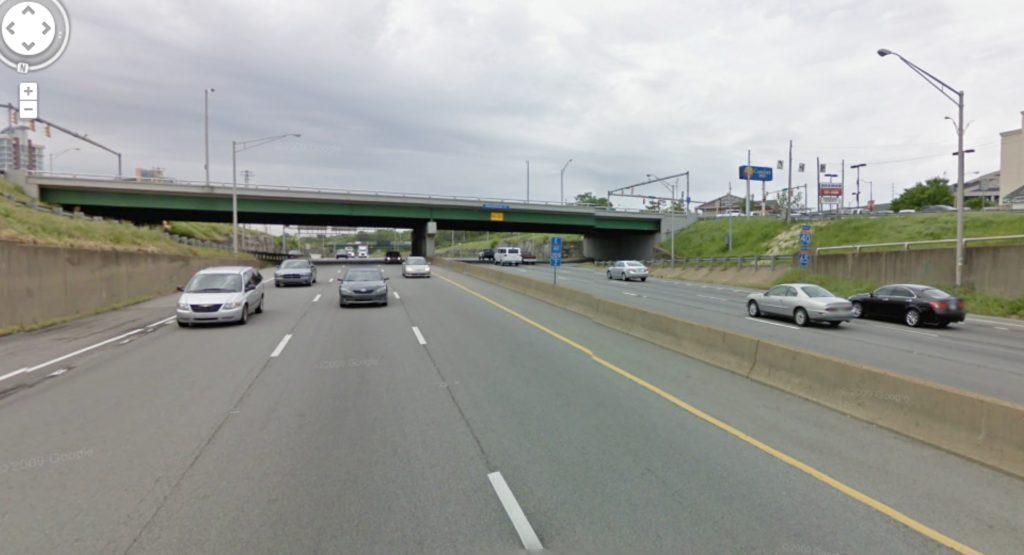
Where the streets around Secretary Foxx’s childhood neighborhood dead-end into Interstates 77 and 85 in Charlotte, NC

It’s an inspiring effort, but as he said, “These principles sound very easy, but they’re really hard and they’re also very necessary if we’re going to make transportation work for everybody.”  This rule produced by FHWA illustrates the uphill battle against the institutional inertia for the old way of doing things.

This proposal also undercuts the Secretary’s ongoing Mayors’ Challenge for Safer People and Safer Streets intended to “help communities create safer, better connected bicycling and walking networks,” explicit requirements from Congress to design streets safe for all users, and the nearly 900 communities that have passed complete streets policies to do the same.

“We’re trying to be more attuned, but it’s not a situation where the federal government is solely in control. We can’t tell a state what project to do. They have to make those determinations,” Sec. Foxx noted.

Indeed, states and metro areas will still be making the bulk of the decisions. Yet through this rule and other guidance, USDOT can absolutely usher in a new paradigm by steering states and metro areas to a more holistic approach for measuring traffic congestion that counts all people in a community by counting all modes of transportation. And we will need your help to hold USDOT’s feet to the fire to make this change happen.

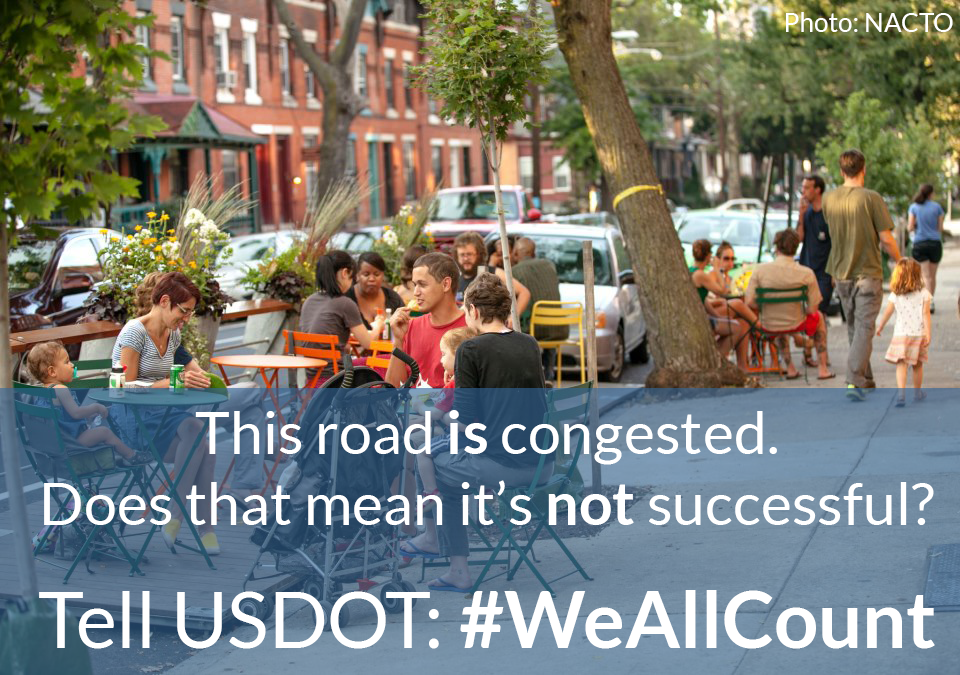
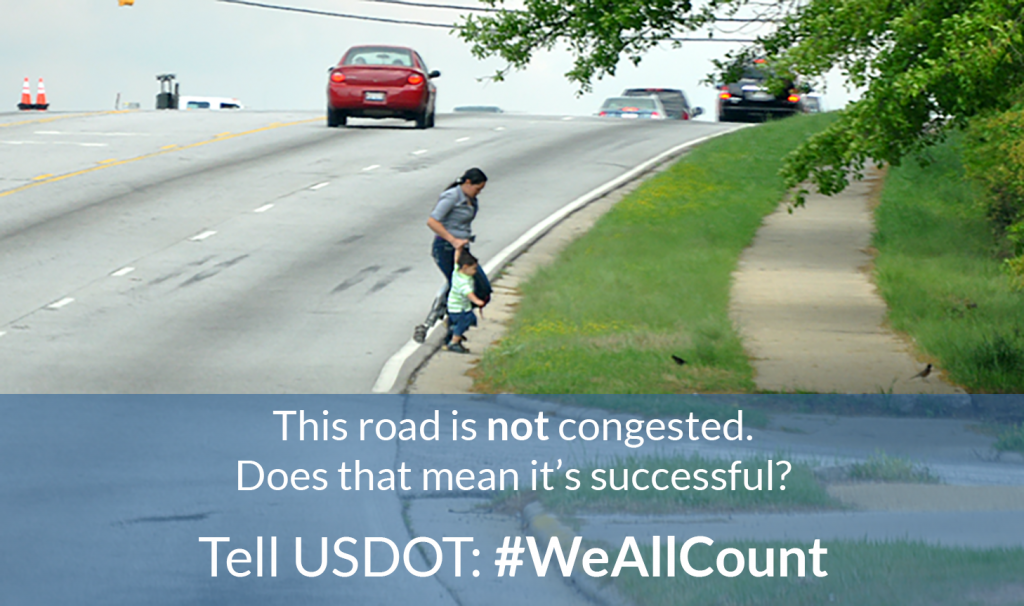
#2 Focusing on delay is simply the wrong measure for addressing congestion

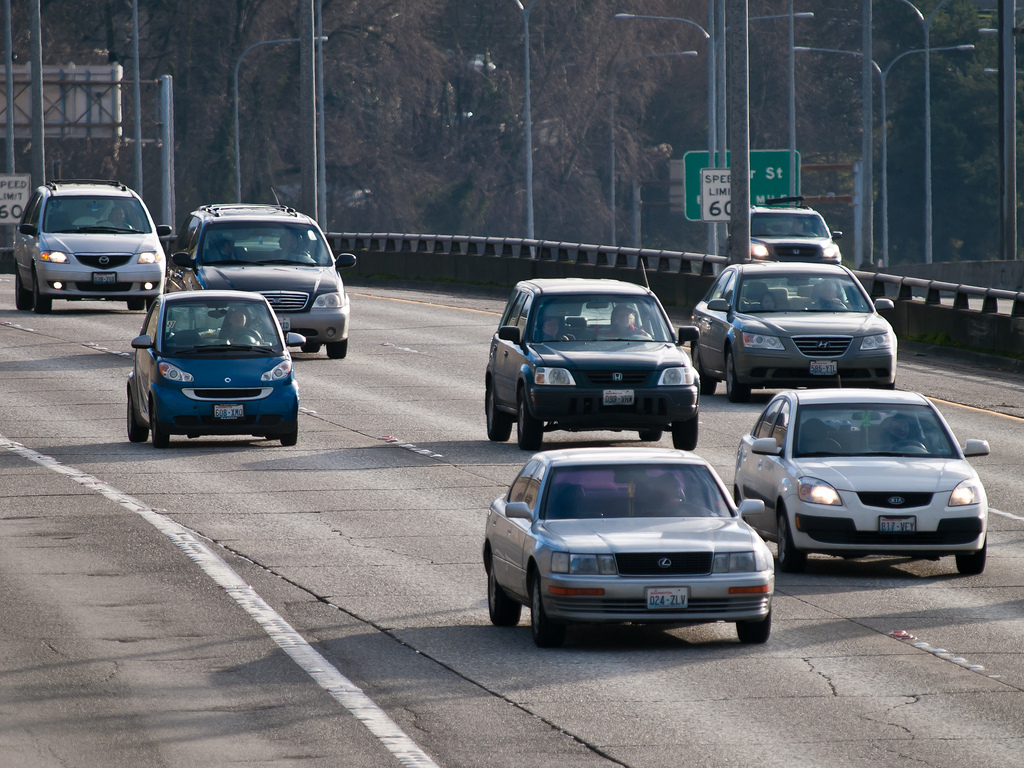
USDOT plans to measure vehicle speed and delay seven different ways, while ignoring people carpooling, taking transit, walking & biking or skipping the trip entirely.

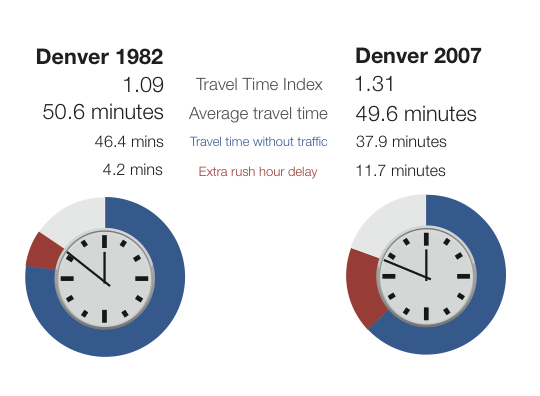
A host of people and groups from all across the map, including T4America, have already explained in detail how a singular focus on delay for drivers paints an incredibly one-dimensional picture of congestion. Focusing on average delay by simply measuring the difference between rush hour speeds compared to free-flow 3 a.m. traffic fails to count everyone else commuting by other modes, rewards places with fast travel speeds at the expense of places with shorter commutes and less time spent behind the wheel overall, and completely ignores how many people are actually moving through the corridor.

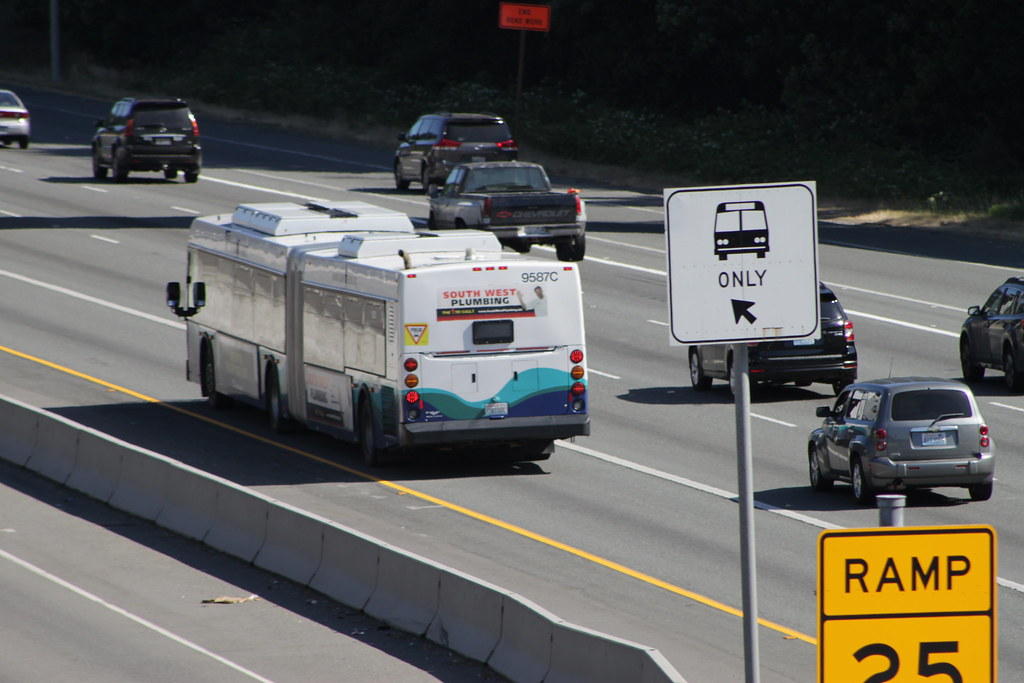
This measure treats a corridor filled with buses or carpoolers the same as a corridor filled with single-occupancy vehicles. It ignores millions of people who opt out of congestion entirely by taking transit, telecommuting, walking or biking, and even penalizes places where people get to take shorter trips. While USDOT’s proposal to measure delay per capita at least begins to recognize that not everyone in a region is stuck in traffic on the highway, it still fails to measure how many people are moving through a corridor.

Shouldn’t the actual impact on real people be the core principle of anything we measure? Any traffic congestion measure should lead us to solutions that increase access to opportunity for everyone — regardless of how they travel each day.

#3 You can’t manage what you don’t measure

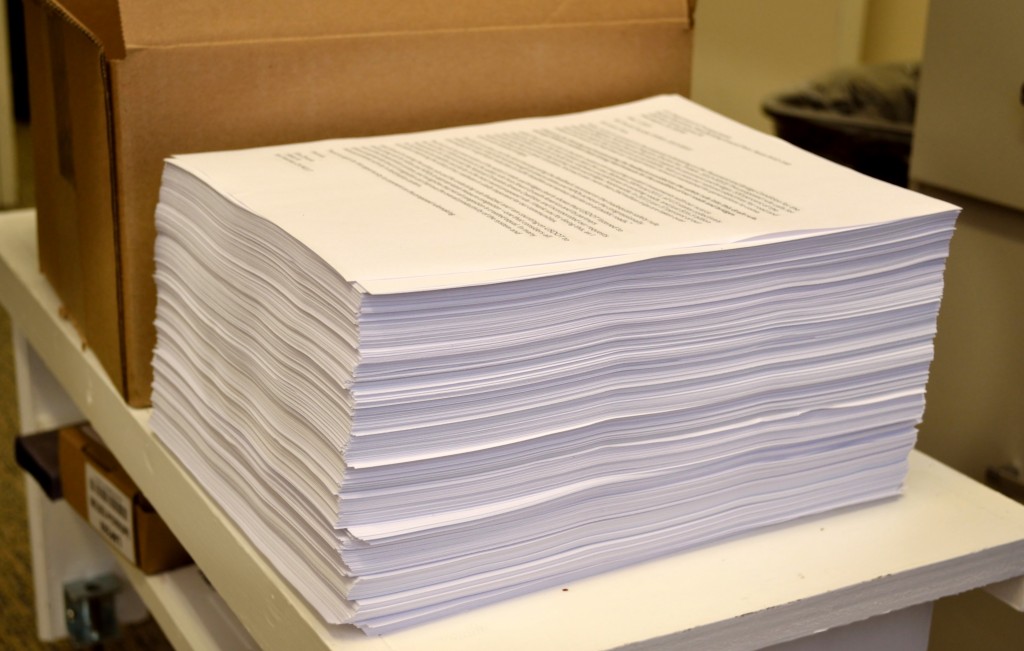
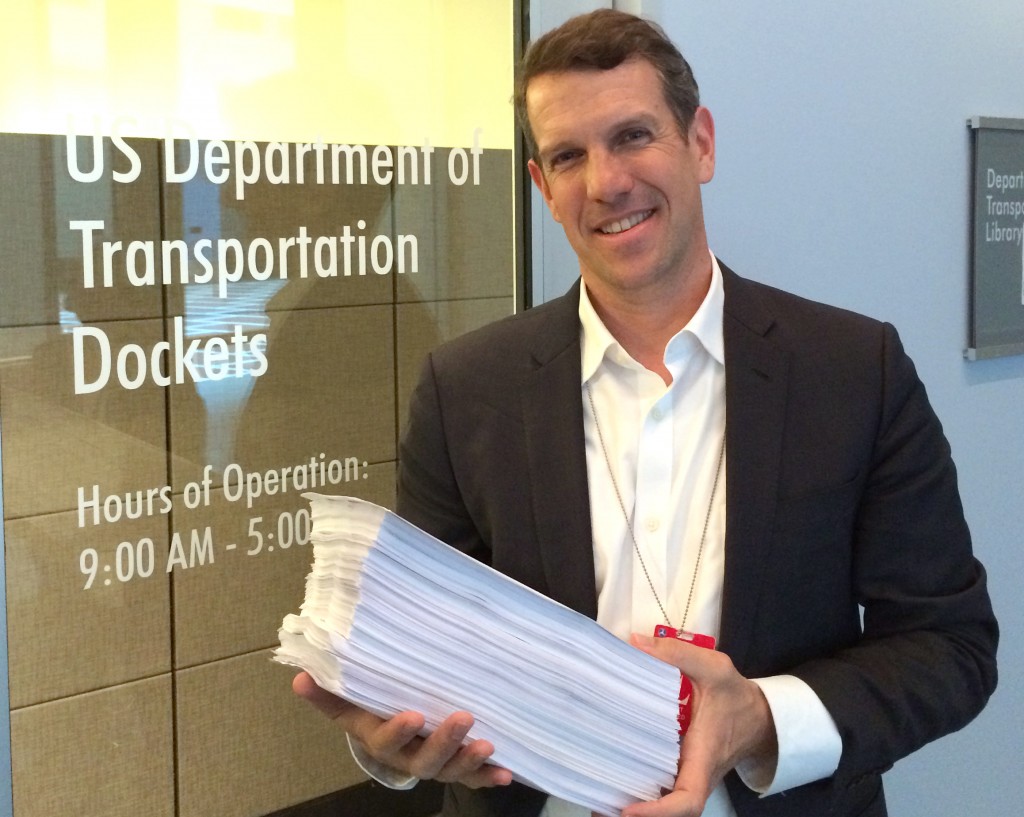
In the pointed words of a USDOT official earlier this week, “you can’t manage what you don’t measure.” The really staggering thing is that FHWA knows they’re missing the boat on measuring other crucial things that paint a more accurate picture of delay. From their own words in the 425-page rule:

As with delay metrics, FHWA acknowledges that travel time indices do not capture system attributes in terms of shorter trips or better access to destinations and mode options, which may occur at the expense of greater delay.

True. So let’s find a better way than focusing narrowly on delay.

#4 USDOT should stick with reliability and dump delay

One of the few positives is that (in one of the measures), USDOT recognizes that predictability is incredibly important. The rule includes a people-centric metric of “reliability” — whether a trip on a corridor takes the same amount of time from one day to the next. While completely eliminating rush hour congestion isn’t either possible or affordable, what many travelers are looking for is the basic assurance that their morning commute will take the same amount of time each day, allowing them to plan their trips with predictability.

But reliability for whom? Unfortunately, this rule only considers the reliability of those traveling by car, and will ignore whether or not your transit trip is hit or miss.

Though one of the other measures is labeled “reliability,” it’s just another measure of delay in sheep’s clothing: It defines “reliability” as trips taking the same amount of time at any time of the day – middle of the night or rush hour — an incredibly unlikely scenario.

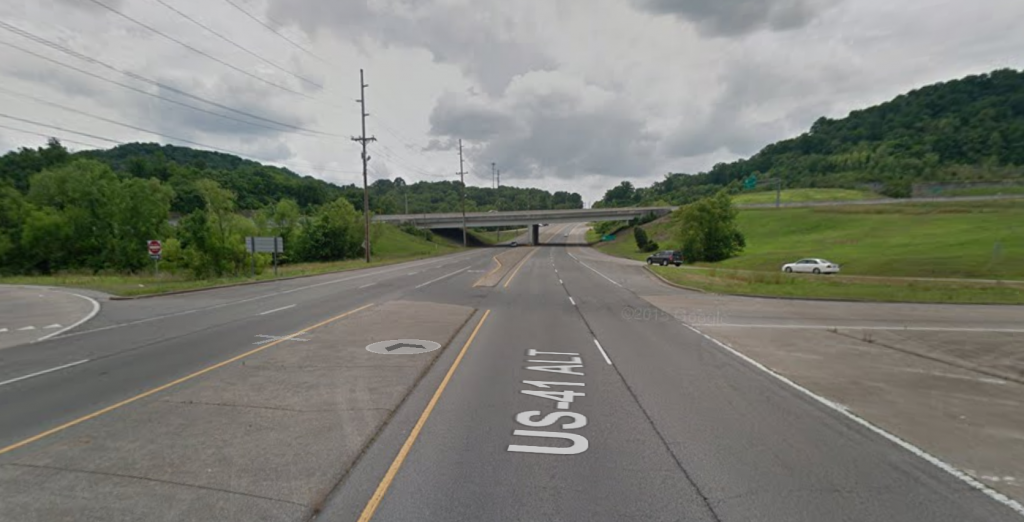
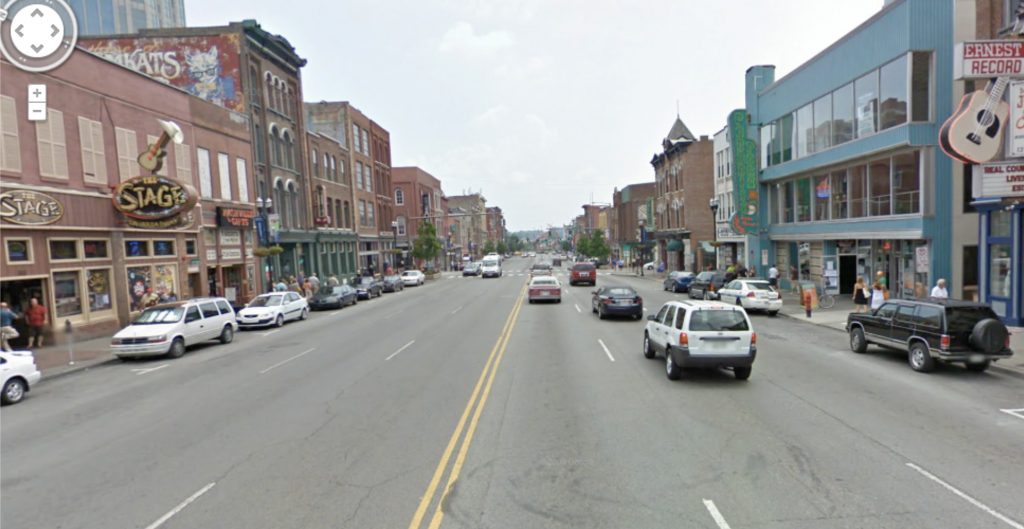
#5 When it comes to congestion, this treats highways the same as main streets — and could do real harm to our most economically vibrant places

Take a look at these two sets of streets from Nashville and Charlotte. First: US 41/Clarksville Pike in northern Nashville, and then Broadway in downtown Nashville.

US 41 Nashville congestionNashville Broadway NHS congestion

And Brookshire Blvd/NC-16 headed south into Charlotte, and Tryon Street near downtown

NC 16 Charlotte congestionCharlotte Tryon Street NHS congestion

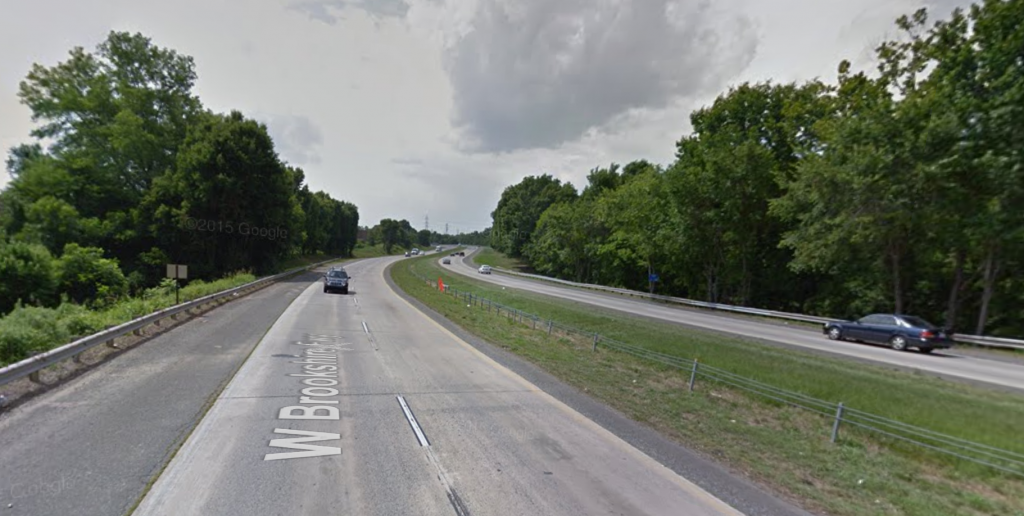
Are the needs of all of these streets the same? Do they all need to accomplish the same thing? Should we expect them to function the same way?

Partially because of a decision made all the way back in 2012 in MAP-21 to expand what’s known as the National Highway System to include nearly every four-lane (or larger) road — regardless of what kind of traffic it carries or where it passes through, this measure proposes to measure congestion roughly the same way on all of them.

Whether in a rural small town or a big city, the needs of our country’s main streets are radically different from the highways and interstates designed to connect disparate places. For a main street to function well, it has to serve everyone who needs to use it.

On a main street, that which looks like “vehicle delay” to a traffic engineer looks like economic activity and success to a local merchant or mayor on a main street.

#6 USDOT ignores the innovative things other states and metro areas are already doing

California has already moved to scrap level of service (LOS) as an evaluation criteria for transportation projects, one that has typically resulted in the same outcomes as this narrow congestion rule. As Angie Schmitt wrote in Streetsblog back in January:

Instead of assessing how a building or road project will affect traffic delay, California will measure how much traffic it generates, period. Car trips, not car delays, will be the thing to avoid. This is likely to have the opposite effect of LOS, leading to more efficient use of land and transportation infrastructure.

At the same time that USDOT is proposing to double down on 1960’s measures for traffic congestion, other metro areas across the country are setting ambitious new goals and accompanying performance measures for improving health, improving access to jobs for more people or expanding transit to connect more people to opportunity.

#7 We can’t wait to develop better measures until we have the “perfect” data

Throughout the rule’s 425 pages, USDOT continues to perpetuate the myth that they lack adequate data to measure other modes of transportation, ignoring sources like (their own!) National Transit Database, the U.S. Census American Community Survey, and cell phone network data among others. USDOT invested millions of taxpayer dollars after the passage of MAP-21 to procure the data necessary to develop these vehicle-only measures. If USDOT is spending our money to collect data then they must find ways to acquire the data needed to better measure the entire system and all of its users.

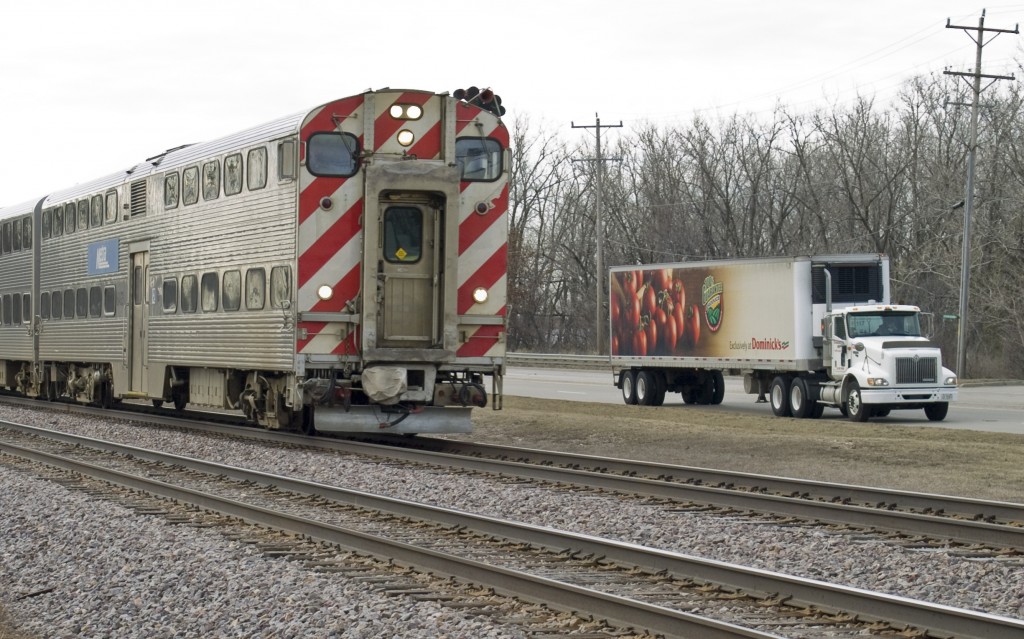
#8 It puts containers above commuters

By defining congestion on interstates as speeds below 35 mph for commuters but below just 50 mph for freight trucks, this rule strangely prioritizes the needs of freight movement at the expense of people. While the movement of freight is indeed incredibly important, it should be on a level playing field with the people picking up the majority of the tab for the system’s maintenance. (To say nothing of the difficulty of actually implementing different standards for various types of vehicles on the same roadway.)

This rule also sets an impossible standard for freight movement in urban settings. Freight bottlenecks obviously occur far more often in urban areas where demand is far greater. Does anyone think that it’s feasible or affordable to spend enough or build enough capacity so that trucks can travel at 50 mph through the middle of major cities during rush hour?

#9 It undercuts the goal of protecting and enhancing the environment

This rule does include more than just measures for traffic congestion, including a requirement to measure mobile source emissions (i.e. pollution from vehicles). Yet states and metro areas would only have to measure the impact of the few projects funded by the relatively tiny Congestion Mitigation and Air Quality (CMAQ) program, which is akin to not being required to reduce highway deaths on a road because that road was built with highway dollars instead of safety improvement dollars.

Though the rule makes a first-ever move to include language on measuring the contribution of the potential emissions impacts of transportation, it stops far short of actually including any requirements with teeth. As Joe Cortright wrote earlier this week:

Despite some hopes that the White House and environmentalists had prevailed on the USDOT to tackle transportation’s contribution to climate change as part of these performance measures, there’s nothing with any teeth here. Instead—in a 425 page proposed rule—there are just six pages (p. 101-106) addressing greenhouse gas emissions that read like a bad book report and a “dog-ate-my-homework” excuse for doing nothing now. Instead, DOT offers up a broad set of questions asking others for advice on how they might do something, in some future rulemaking, to address climate change.

#10 We still have a chance to improve this rule — but we’ll need your help to do it

The comment period for this rule isn’t open yet — it will open on Friday, April 22 and run for at least 90 days. Though USDOT has gone in the wrong direction on many of these measures, we know from our past experience on similar rules that they are absolutely listening for suggestions for improving this. They’re eager to hear how it can be improved.

There are three things you can do in the next week to help.

Not on our email list already? Sign up here.

Breaking news: USDOT releases draft rule for measuring congestion

A new federal proposal governing how states and metro areas will be required to measure congestion was just released early today. Our brief analysis finds that though there’s potential for improvement with how the rule is worded, it would still push local communities to waste time and money attempting to build their way out of congestion by using a measure of traffic congestion that’s narrow, limited and woefully out of date.

As we alluded to last week, thanks to new requirements in the 2012 transportation law (MAP-21), USDOT was preparing to release the last batch of new performance measures to help ensure federal dollars are spent to make progress on important, measurable goals. Though these new directions on measuring congestion (along with other important measures) won’t be officially released and open for comment until this Friday, this document posted by FHWA today is likely to be the final proposal for new performance measures.

We’re reading through the full 425-page rule now, and will have much more here on the blog soon (and in your email inboxes), including a way for you to send official comments to USDOT urging them to do better.

Do you want to be notified with the latest news on this front? Sign up for email from T4America today. 

In the meantime, if you missed our post last week explaining why it’s important how we choose to measure congestion, catch up with that here.

Will pending federal transportation rule double down on outdated view of congestion?

USDOT is on the cusp of releasing crucial directions for how states and metro areas will have to measure traffic congestion. The new rule could push local communities to try in vain to build their way out of congestion, or mark a shift toward smarter approaches like shortening trip times, rewarding communities that provide more options or better accounting for other travel modes and telecommuting.

Updated: The rule is out — read our more detailed post on ten things you should know about it, and take action by sending a letter to USDOT.

Friday Night Lights

Thanks to new requirements in the 2012 transportation law (MAP-21), USDOT is working to establish a new system of performance measures to help govern how federal dollars are spent and hold states and metro areas accountable for making progress on important goals. For two years, USDOT has been slowly developing, releasing and then refining new metrics for safety and state of good repair for highways and bridges. And any day now, they’re expected to release the final highway rule that will cover traffic congestion, air emissions, freight movement and system performance.

How we measure traffic congestion matters

While all of those specific metrics are important, how USDOT instructs states and metro areas to measure congestion will have huge impacts on communities of all sizes. Why? Because there’s a direct connection between how we decide to measure congestion and the resulting strategies for addressing it. And we need a measure that rewards solutions like aggressively investing in additional travel options, eliminating trips, reducing trip length, creating more places to live close to jobs or more effectively managing travel demand.

One of the most commonly used methods for measuring congestion today (and how proposed transportation projects would improve it or make it worse) is incredibly narrow and generates major criticism: roadway delay.

Every year, the Texas Transportation Institute releases their annual Travel Time Index congestion report that generates tons of news coverage across the country. Our piece from last year explained the limitations of comparing average rush-hour speeds to empty roads in the middle of the night, as TTI uses those middle-of-the-night speeds as their baselines for comparison. And then as a direct result of how congestion gets measured, many agencies attempt, at enormous price tags, to build enough road capacity to keep traffic moving at free-flow speeds during rush hour, usually bringing limited benefits (a few seconds of savings per commuter) at enormous costs.

Roadway delay, typified by TTI, also rewards places with long average commutes that happen at a high rate of speed, dinging places where people spend less time commuting or commuting shorter distances — just because they travel at slower speeds compared to that baseline of average travel speeds at the middle of the night.

Another major shortcoming is that roadway delay focuses only on drivers — not commuters as a whole, ignoring the millions of people opting out of congestion entirely by using various other options like transit, walking or biking or skipping the trip by telecommuting.  Under a roadway delay measure, if a city has made investments like these that allow a large share of its commuters to skip roadway congestion entirely, it can be rated the same as another city where the average delay on the roads is the same, even if 100 percent of that second city’s commuters are stuck in traffic.

Delay is also blind to how many people a corridor is actually moving — it only looks at the number of vehicles. Should two similar corridors, where the first moves three times the amount of people as the second because of a carpool requirement or a lane dedicated to high-capacity transit, have the same scores for delay just because the travel speed is the same?

STEX 9587C deadheading in Mountlake Terrace

With USDOT about to propose this new framework for measuring congestion, it’s worth stating plainly: Roadway delay, similar to what TTI measures, represents a flawed and unrealistic view on measuring congestion.

It also doesn’t mesh with USDOT’s overall priorities, running counter to the stated goals of President Obama’s seven rounds of successful multimodal TIGER investments as well as the priorities of Secretary Foxx’s ambitious Ladders of Opportunity initiative.

A better, properly constructed measure will reward states and regions for investing in projects that make the most cost-effective difference in managing congestion, reducing travel times and improving system performance, regardless of what type of transportation mode is proposed.

What we’re expecting from USDOT

Unfortunately, early indications lead us to believe that the final congestion measure due to be released any day now will incorporate a variation on roadway delay. But that won’t be the end of the line for something better. Just like the past two rules that largely focused on safety and the conditions of roads and bridges, USDOT will be opening a comment period after the rule is released and then refining it one last time.

Though we’ll have an uphill battle, through coordination and agreement on a preferred alternative (more on that in our next post), we stand a strong shot at getting language included that acknowledges the limitation of these conventional congestion measures and invites development of a better, more holistic measure that provides a fuller picture of congestion and who is or isn’t affected.

But we won’t be able to do this alone. We will need cities, MPOs, transit agencies, the business community, state DOTs and advocates just like you to support our effort to ensure that the final congestion measure more fully accounts for all modes of transportation and doesn’t reinforce flawed 1950’s measures of success.

Using performance measurement to chase the right goal: Performance measures for members, part III.

If states and metro areas merely take up conventional measures without question, they may move in the wrong direction toward the wrong outcomes in the end. Instead, start from your ideal goal and work backwards to choose the appropriate measure to get you there.

This is the third post in a series on performance measures by Beth Osborne, T4America Senior Policy Advisor. Read the rest of the series anddive into high-level overview of the conceptfind out how and why you should go beyond the federal requirements, and learn how to demonstrate to the public that their dollars are being used wisely. -Ed.

What do you mean “conventional” measures? What sort of commonly accepted measures can send us in the wrong direction?

Beth Osborne, T4America

Beth Osborne, T4America

A fantastic, timely example can be seen in the latest release of the oft-cited but flawed Texas Transportation Institute’s (TTI) Urban Mobility Report which purports to rank metro areas by congestion, but is a case study in how a conventional, yet flawed, measure can lead you in the wrong direction.

There are numerous issues with TTI’s measure of congestion and we don’t cover them all here. Read our detailed public critique of the TTI report on the blog. -Ed.

When actual drivers talk about congestion, they tend to mean one of two things: bumper-to-bumper traffic or unpredictability. The latter really makes commuting a hassle — the lack of certainty about just how long today’s commute may take, with no way to adequately plan for it. (“Do I know how much time I need to allow today so I’m not late for work?”) It turns out that commuters understand that traffic will slow during rush hour, just like they know they will wait for a table at a popular restaurant on Saturday night.

TTI’s travel time index identifies congestion as any delay compared to the speed of traffic when the road is essentially empty. In other words, if people travel at 65 miles-per-hour on a particular highway where there is no traffic, any time the speed drops is considered delay, even if a slowdown to 55 mph is simply down to the posted speed limit. Yet, if you knew that you could travel at a reliable 55 mph each day for a rush hour commute (or 45 mph or 35 mph, even), wouldn’t you appreciate that predictability?

Most delay measures also only consider the experience of those driving. When the TTI report speaks of the experience of commuters universally, they’re actually only talking about driving, leaving out millions of others who commute each day by other methods.

Why is that distinction important? Let’s say the roadways are equally congested in two cities. In one city only half of the commuters experience it because they commute by transit, bike, foot or opt out entirely by telecommuting. In the other city, almost every commuter is traveling by car and is stuck in traffic each day. Do these two cities have the same congestion problem? According to the way TTI measures it, yes they do.

This is precisely how the wrong measure can put you on a path to the wrong outcome.

By defining and measuring congestion as only the change in speed at rush hour compared to the middle of the night and ignoring all other commuters, the “solution” becomes as limited as it is expensive: build enough roads and lanes so commuters in cars can drive as fast as they want — even above the speed limit — at all times of day no matter how many vehicles are on the road.

That narrow focus also means the community will be missing ways to encourage shorter trips, commuting by other less costly modes, and opting out of commuting entirely. If the community has economic development goals of attracting the young talent that is increasingly looking to locate in places with a wide range of transportation options, using a measure that focuses solely on driver delay will run at cross-purposes to those (and other) goals.

So how can we make sure we’re measuring congestion in a more beneficial way; in a way that reflects our residents’ concerns?

First, listen to your residents and stakeholders explain what it is about congestion that frustrates them. Understanding the source of their frustration will ensure your community is tracking the real problem.

Second, think about the point of view of all of your residents — roadway congestion may not be a frustration for all commuters. This means getting a more accurate picture of who is actually experiencing congestion day-to-day. After all, one way to address congestion is to remove drivers from the road, through carpooling, telecommuting, alternative work hours, helping people live closer to work or supplying affordable and convenient transportation options. Many of these solutions are cheaper than building more road capacity.

Congestion is not the only area where states and metro areas attempting to measure performance can mess up. One smart way to avoid these mistakes is to think deeply about the preferred, ideal outcome you’re seeking. Is it free flow conditions on every road at all times of day? Is it giving your commuters a predictable commute? Is it giving the highest possible number of people access to jobs within a 45-minute commute? Identify the end goal and find a measure that leads toward that goal.

We have more information about ways to do this in our report, Measuring What We Value. And let us know if we can help you explore these issues more deeply.

Performance Measures Report Cover 350x300

New traffic congestion report raises more questions than it answers

Most people sitting behind the wheel each day won’t be surprised by the findings of the latest edition of the Texas Transportation Institute’s report on urban congestion that shows, once again, that (surprise!) the roads in most major American cities are very congested during rush hour each day. The report’s methodology is flawed, but what really matters most is what policymakers and citizens decide to do about congestion in their communities.

(Updated: 8/27/15 12:15 a.m. with other articles at bottom.) Once again, The Texas Transportation Institute is in the headlines today with the release of their Urban Mobility Report and its Travel Time Index (TTI), which purports to rank metro areas by congestion but is mostly disconnected from what commuters experience on a day-to-day basis.

While TTI is striving to provide easy to understand measures and rankings to the complex issue of traffic congestion, their methodology is once again drawing criticism on a number of fronts.

The report’s touchstone metric is a blunt measure of peak-hour speeds compared to an empty road in the middle of the night. Did you know that trips take longer during rush hour compared to the middle of the night? You did? The comparison of rush-hour to free-flow traffic begs the question about the goal: is it reasonable or even possible to build enough road capacity to keep traffic moving at free-flow speeds from 6-9 a.m. when the bulk of the populace is going to work? (Those free-flow speeds being used as the baseline comparison also exceed the speed limit in many cases, by the way.)

The economist Joe Cortright wrote a comical April Fools post that showed how silly that logic is when applied anywhere else, in this case, at Starbucks, where consumers lose “$4 billion every year in wasted time” because of long lines during busy mornings. Yet:

No one would expect to Starbucks to build enough locations—and hire enough baristas—so that everyone could enjoy the 15 second order times [at 9 a.m.] that you can experience when there’s a lull [at 9 p.m.]. Consumers are smart enough to understand that if you want a coffee the same time as everyone else, you’re probably going to have to queue up for a few minutes.

The report focuses only on drivers — not commuters as a whole. The millions of people using growing modes like transit, walking or biking or skipping the trip entirely by telecommuting at peak aren’t included in the analysis. So when the report says “person” or “commuter,” what they’re really saying is “car commuter.” The nearly 1 million trips taken per day in Washington, DC —#1 on the “list of gridlock-plagued cities — on metro (bus and rail) and therefore not in a car? Not included in this analysis.

Trips not taken can be crucial, yet they’re ignored here. In February 2009, Inrix, the company partnering with Texas A&M on this release, reported that just a 3.7 percent drop in vehicle miles traveled in 2008 resulted in a 30 percent drop in congestion in the 100 most congested metro areas. We don’t need everyone to shift their trip, take transit, move closer to work, or telecommute — among many possible options. But smart investments and incentives that lead to very small reductions in trips taken can have huge benefits in reduced congestion. And they’re often far cheaper than massive projects proposed to shave a few seconds off of average commutes.

Live close to where you work? Oops. Your short commute can come out looking worse than someone else’s much longer commute. TTI completely ignores the actual time and distance of commutes. If you have a 20-minute commute home but move at a lower speed, your commute scores worse than the person driving 80 minutes at a higher speed. Yet who has the better experience each day?

We share a graphic like this almost every time this report comes out, but it’s telling. According to this year’s Travel Time Index, Atlanta (1.24) is actually less congested than Chicago (1.31). Yet…

Chicago Atlanta travel time


In Chicago in 2007, the average peak hour car trip to work was 38% shorter (in time) than the 57.4 minutes it took Atlantans to drive to work in rush hour. Even the average non-peak commute in Atlanta in 2007 was longer than the average congested peak hour commute in Chicago.  A major reason for the better highway performance in Chicago is that drivers do not have to travel as far as drivers in Atlanta – 13.5 miles compared with 21.6 miles. Yet TTI rates Chicago worse.

Ranking congestion is fine, but what should we do about it? How can we manage congestion in the most cost-effective way possible given limited transportation dollars?

Doing more of the same certainly won’t solve the problem. Regions that have been aggressively investing in additional travel options, eliminating trips, reducing trip length, creating more places to live close to jobs or more effectively managing demand have seen their congestion numbers get better, according to this landmark CEOs for Cities report from a few years ago.

That’s why it’s so critically important that the rule for the congestion performance measure being developed by USDOT measure success (or failure) in ways beyond just this limited and flawed TTI measure. We do need a better measure of congestion if we want to avoid making the same decisions that got us into this mess.

How far do most people have to travel for work? How long does it take them? What is most effective at reducing the amount of time it takes to get places? How many people are exposed to the congestion? Congestion may be bad, but people telecommuting, in a vanpool or on a bike might not experience it. Credit should be given to areas that allow people to opt-out of the traffic. Those are the kinds of metrics we need to use in order to find real solutions.

The proposed rule for congestion being drafted right now by USDOT will lay out exactly how states and metro areas will have to begin measuring congestion — and measuring whether or not the projects they want to build will improve it. We’ve got some posts in the works that will discuss how some alternatives would work, so stay tuned on that front.

Updated: The quotes from the report’s author in this WAMU story from Washington, DC essentially acknowledge that their report is a limited measure of congestion, largely because it only focuses on auto commutes and ignores essentially everyone else.

In response to the coalition’s criticism, Lomax conceded the report’s methodology does not take into account non-car commuting modes.

“They have some good points,” Lomax said. “And they are points that we have included not only in our proposed solutions, but also in terms of our methodology.”

“We have backed away from trying to make estimates of what is happening on the transit side because we don’t have very good transit data. We don’t have good data about how people are walking. So we concentrated on where we have the data,” he said.

Here’s a sampling of other articles questioning the measures in the report and suggesting some better ways to measure a more accurate picture of congestion.

Diving into performance measures with T4’s resident expert

Feel a little lost when it comes to the concept of transportation performance measures? In the first post of a short series expressly for T4A members, Our resident expert and USDOT veteran will help bring you up to speed with a high-level overview of the concept and a quick look at the current state of practice.

This is the first post in a series on performance measures by Beth Osborne, T4America Senior Policy Advisor. Read the rest of the series and find out how and why you should go beyond the federal requirements, learn more about choosing the best measures for addressing your priorities, and learn how to demonstrate to the public that their dollars are being used wisely. -Ed.

Beth Osborne, T4America

Beth Osborne, T4America

As Congress debates a new surface transportation reauthorization bill, it is easy to forget that the transition to performance measurement required by MAP-21 has not yet been fully implemented. The language in MAP-21 required that states and metropolitan planning organizations (MPOs) determine the success or failure of their transportation system by measuring the performance of their investments against federally-required measures, but USDOT has been slow to finalize those benchmarks and kickstart this new process for states and MPOs.

While USDOT continues to work their way through this process via three rulemakings, there are two big issues with which everyone will grapple.

First, though MAP-21 requires specific areas to be measured, the areas were limited to those on which Congress could agree — measures including safety, system condition, system performance, mobile source emissions, and freight movement on interstates and congestion, among others. MAP-21 did not address other measures like economic impact, access to opportunity, transportation cost, freight movement (beyond interstates) and other environmental impacts beyond air quality.

T4A members should be concerned about these missing areas. Regions that fail to consider them may end up only building projects that address Congress’ priorities and not the priorities of their constituents. If you or your community want to consider other factors and measures when picking projects and choosing where to invest, it is time to confer with political and civic leaders, stakeholders and the public to identify those priority areas and the measures that go with them.

Nationwide, states and MPOs are discussing this issue now — before the rule is completed by USDOT and everyone is forced to get moving on USDOT’s tight implementation timeline. We will talk more about how this can be done in the next post, with some specific examples.

Second, regions should pay close attention to the development of each performance measure rule by USDOT because those rules will establish exactly what each state and region will measure. There are more ways to measure “National Highway System performance” and even “congestion,” for example, than you may realize, with a wide range of impacts based on how each issue is measured.

Congestion could be a measure, as engineers have traditionally treated it, of moving cars through an area as fast as possible. Or we could focus on moving people instead of cars. Keeping cars moving so that traffic never slows — no matter how many cars are on the road — is an extremely expensive, if not impossible, proposition. If your goal is moving people, the solution will be much more affordable, flexible and tailored to the overall community goals.

We will dig in deeper to the issue of how the wrong measures can send a community in the wrong direction in an upcoming post.

USDOT split their full rule for performance measurement into three parts. Their first part covered safety measures; the second, system condition measures (i.e., road and bridge condition); and the third contains all the other measures mentioned above. The first two parts of the rule have already been released, commented upon and closed. The third (the biggest one) is still pending and will probably be released to the public for comment toward the end of this year.

Stay tuned right here, T4A members! Over the next few weeks, we will unpack the thorny issue of performance measures and provide you with insights into preparing for this new decision-making system and how you can use it to build support for your programs and help make a case for needed funding.

For more information, feel free to check out our report on performance measures, Measuring What We Value.

The USDOT listened, and we thanked them for it — 1,100 times

Last Friday, with help from many of you, we delivered almost 1,100 ‘thank you’ letters to the U.S. Department of Transportation for writing strong rules to hold states accountable for the condition of their roads and bridges. 

It was an astonishing thing to see the enormous stack of letters piled up on a desk in our office. Last Thursday, just before the Friday deadline for comments, T4America director James Corless got a midday workout by hauling the box of letters across town to USDOT and ensuring that your voices were heard on the issue.

James USDOT NHPP rulemaking delivery

USDOT is working to establish a new system of performance measures to govern how federal dollars are spent via this process of draft rules and feedback.

Last year, after complaining that the USDOT’s proposed safety performance measures — the first set of measures — were far too lenient, we sent the agency 1,500 letters letting them know that the rule was not good enough. The USDOT listened and drafted much stronger rules for their second set of measures on road and bridge conditions. In the first draft, states were allowed to fail half of their targets and still receive a passing grade. But after receiving those 1,500 comments, USDOT incorporated that feedback into this improved draft rule for road and bridge conditions, requiring progress on all targets — not just 50 percent of them.  

So it was time to say thank you and let USDOT know that requiring progress across the board is just as essential for evaluating the condition of our roads and bridges.

Even third graders know that our voices matter. T4A director James Corless had to stop by his son’s classroom on his way to USDOT, and he had the giant box of letters in tow.

I had been scheduled to talk to my third grade son’s civics class about how Congress and the Administration make decisions about things like the federal budget and how much we spend on transportation. After talking a lot about the different roles of Congress and the President, one of the third graders put up her hand.

“What’s in the box?” she said.

“Those are letters to Secretary Foxx, head of the U.S. Department of Transportation,” I replied.

“Is that a petition?” another child asked.

“In a way, yes, except this time we are thanking them for listening to the public — that’s the great thing about a democracy.”

“Cool!” another third grader said.  “They’re going to have to read all of those letters, right?  Can we send some too?”

Coming up next? Measuring congestion

You (and those third graders) will have an opportunity to engage once again on this issue. Sometime this year USDOT will release their third draft rule that will include an approach for measuring congestion. Congestion is a tricky thing to measure, and most of our current analyses wildly miss the mark. As our Beth Osborne wrote back in January:

For example, is the goal of highway performance to keep traffic moving at the speed limit no matter how many cars are on it? Or is it to know that your trip today will take the amount of time you budgeted for it? If it is the former, we will have to spend a lot of money paving over a lot of places at marginal benefit to ensure a safe and efficient commute or delivery. If it is the latter, we can address the issue with a mix of more affordable operational improvements, emergency response and new capacity. In congestion, are we only interested in the speed of cars or do we give communities credit for letting their residents opt out of congestion entirely by taking transit, walking or biking?

As another example, while you might want an interstate between two cities to flow as freely as possible, some congestion on a city street in a business district might be desired as a sign that it’s a popular destination. Yet most current measures often treat these roadways the same.

We will be exploring some ideas about better ways to measure congestion here in the next few weeks, hopefully before USDOT releases their next rule, so stay tuned.

Hold states accountable for repairing roads and bridges – send a letter to USDOT

The U.S. Department of Transportation is in the process of writing new rules to hold states accountable for the condition of their roads and bridges. USDOT’s strong first draft rule was a step in the right direction, and we want to thank them — and ensure they don’t bow to pressure to soften these requirements.

Can you take just one minute to sign this letter to USDOT? We’ll hand-deliver a copy straight to USDOT for you.

Did you already take action? Share this action with others:

The 2012 transportation law (MAP-21) requires transportation agencies to begin using a new system of performance measures to govern how federal dollars are spent. USDOT is working to establish these new metrics for safety, the state of repair, congestion (coming soon!), air emissions and other aspects of our transportation system through an iterative process of draft rules, feedback, refined drafts and final rules.

Look, we get it: this is a wonky and arcane affair. So why should you take action and provide a comment on this pavement and bridge proposed rule? Because USDOT is truly listening to comments and making changes as a result. 

USDOT’s first rule on roadway safety wasn’t a good one, to put it bluntly, and it failed to ensure that safety would improve. Yet the thousands of comments we delivered played a part in improving it.

In that draft, states were allowed to fail half of the fatality and injury targets and still receive a passing grade. But after receiving more than 1,500 comments, USDOT incorporated that feedback into this improved draft for roads and bridges, requiring progress on all targets — not just 50 percent of them.  

Now USDOT is going to hear from the other side, those that don’t want states to be held to such high standards.  We need to let USDOT know that we support the changes they made and that requiring progress across the board is just as essential for evaluating the condition of our roads and bridges.

Between 2009 and 2011, all U.S. states collectively spent $20.4 billion annually to build new roadways and add lanes to existing roads, and just $16.5 billion annually repairing and preserving existing roads and bridges. But by 2011, after spending more than half of all highway dollars on expansion projects, just 37 percent of our nation’s roadways were in ‘good’ condition. And today, more than 260 million trips are taken each year on the country’s structurally deficient bridges.

That’s not good enough. We need to hold states accountable to meet measurable targets with our tax dollars. USDOT has drafted a better rule to make that happen, and we need your help to ensure it stays that way.

Read and sign this letter today, and we’ll deliver it to USDOT before the May 8 deadline.

Credit where it’s due: With repair rule, the feds listened to public comment

In developing new standards for ensuring our roads and bridges are kept in good condition, officials at the U.S. DOT did something skeptics would find surprising: They really listened to public comment, and reflected it in the newly released rule.

T4America's Beth Osborne

T4America’s Beth Osborne

As we have noted here often, the 2012 transportation law (MAP-21) requires transportation agencies to begin using performance measures to govern how federal dollars are spent. The U.S. DOT is working to establish those metrics for safety, the state of repair, congestion, air emissions and other aspects of our transportation system.

State DOTs and metropolitan planning organizations (MPOs) will then set their own targets for areas. They then must show how their investment plans will help them reach the targets and report on the results. If they fail to make enough progress on say, road and bridge conditions, they would be expected to spend more in those areas.

Creating this brand new system from scratch is a challenge. DOT officials have to figure out which sets of data are truly valid measures and where the data come from; how much time and wiggle room to give states and MPOs in setting and meeting targets; and what happens when they don’t.

We at T4America and many of our allies howled last year when USDOT’s first proposed performance measure, on safety, allowed states and MPOs to fail outright on half of the measures, making the targets for states virtually meaningless. T4A and the Complete Streets Coalition responded with 1500 public comments saying that this was not good enough.

We are still waiting for the full rule on safety, but with the release of this second proposed rule on system conditions (i.e. bridge and pavement maintenance) USDOT has shown that they heard us on the question of how agencies will be held to account. The new rule proposes that MPOs and states must hit all of the required targets — 50 percent success is no longer a passing grade. And states must either beat the trends or, if their target is not as good as the trend line, they must hit their target. This is a substantial improvement. Considering the current condition of the country’s infrastructure, holding states’ and metros’ feet to the fire on state of repair is critically important. As Smart Growth America’s 2014 Repair Priorities report made clear, most states are still spending billions on new roads or expanding existing ones — while neglecting their growing repair backlogs.

Between 2009 and 2011, the latest year with available data, states collectively spent $20.4 billion annually to build new roadways and add lanes to existing roads. America’s state-owned road network grew by 8,822 lane-miles of road during that time, accounting for less than 1 percent of the total in 2011.

During that same time, states spent just $16.5 billion annually repairing and preserving the other 99 percent of the system. … [In 2011], just 37 percent of roads were in good condition that year—down from 41 percent in 2008.

Under the new rule, that kind of investment decisions and resulting diminishing performance should fail to pass muster in the future.

As someone who has worked for USDOT and is accustomed to the dense documents we sometimes produced, I was struck by the clarity and tone of this (still long and technical) rule. The impact of the public comments — including those provided by T4America and our partners — was clear. USDOT explains each issue they had to grapple with, what they heard from stakeholders on each issue, the principles they used to evaluate options, how each option performed in that evaluation and then their final choice. Reading the rule felt like having a frank conversation with the experts at FHWA writing the rule.

This is especially encouraging because the third rule on congestion (and other measures) undoubtedly will be the hardest and, in many ways, the most impactful. It includes measures that are newer to the federal program and can be defined many different ways. For example, is the goal of highway performance to keep traffic moving at the speed limit no matter how many cars are on it? Or is it to know that your trip today will take the amount of time you budgeted for it? If it is the former, we will have to spend a lot of money paving over a lot of places at marginal benefit to ensure a safe and efficient commute or delivery. If it is the latter, we can address the issue with a mix of more affordable operational improvements, emergency response and new capacity. In congestion, are we only interested in the speed of cars or do we give communities credit for letting their residents opt out of congestion entirely by taking transit, walking or biking?

One thing we now know for sure: USDOT is listening to the public, so we need to engage. We thank USDOT for the improvements and for listening. It is a heavy responsibility, and one the folks at the U.S. Department of Transportation executed very nicely.

There are a couple more ways they can improve the rule further, like making more of the process available to the public. I encourage everyone to comment on the current draft.

UPS chief and other business leaders urge Congress to pass a bill that helps both commuters and freight

David Abney, the recently hired chief executive officer of UPS, recently penned an editorial in Bloomberg/BNA that provides an illuminating look inside the priorities of the booming freight company — based in the same city where we hosted a policy breakfast on metro freight movement just two weeks ago.

Everybody wins. Flickr photo by Thomas Merton

Everybody wins. Flickr photo by Thomas Merton

Abney’s comments put a bright line under the importance of Congress updating our country’s outmoded freight policy in the next federal transportation authorization.

He argues that Congress still needs to update the federal program from its roots in a 20th century “highway bill” to a truly 21st century “transportation bill” that knits all modes of transportation together. “My sense tells me that to truly impact America’s transportation infrastructure problem, we can’t approach it just from the standpoint of ‘trying to fix our road’ or ‘trying to fix our ports,’” he said. “Instead, we need to think first about the real end goals: 1) getting to and from our destinations and 2) making those commutes as quick, efficient and cost-effective as possible.”

When we were developing our policy platform a year ago based on the feedback we were hearing in meetings around the country, a consistent theme — especially when meeting with local chambers of commerce or metropolitan business leaders — was that moving freight and people was often one of their top priorities. Forget about the usual simple debates between spending on maintenance versus new road capacity, or whether a particular area should build this rail line or that highway; chambers especially seem to grasp that a) freight movement is critically important to the local (and national) economy and b) you can’t make a plan to move people that doesn’t also account for the movement of stuff, and vice versa.

But like any discussion of federal transportation policy these days, the elephant in the room is always funding. And affirming much of what you’d expect from businesspeople, they’re willing to pay more, but only for a smarter approach that can improve the bottom line:

Of course, before even having a broader debate about infrastructure, we need Congress to pass, at minimum, funding support for vital maintenance and repair programs. Otherwise today’s infrastructure won’t even be around for tomorrow’s solutions. …To address congestion and drive down transportation costs, we need a holistic approach–one that integrates all modes of transport, and that includes dedicated funding mechanisms. Whether it’s a vehicle-miles-traveled tax, raising the gas tax, implementing waste-reduction policies or reallocating government spending, we’ll need a way to pay for these crucial investments.

Abney’s thoughts are similar to what we heard in his company’s hometown just a couple of weeks ago for a policy breakfast we convened with the Metro Atlanta Chamber. At the Chamber offices in downtown Atlanta, we heard from Doug Hooker, executive director of the Atlanta Regional Commission (Atlanta’s MPO), Jannine Miller, senior manager at The Home Depot, and David Abney’s colleague Frank Morris, UPS’s vice president of corporate and public affairs.

All the speakers represented Atlanta-based businesses or metro leaders with a keen interest in seeing the region keep freight and people moving each day. “Atlanta started as a freight hub and has stayed true to that,” said Doug Hooker with ARC. “We, as leaders in Atlanta, need to figure out how that job growth center will continue in the future.”

While there are real flaws with the “Travel Time Index” when it comes to putting a specific dollar value on congestion’s cost to everyday commuters, businesses like UPS or Home Depot that deal in very specific timetables see much more tangible losses. “If UPS’ drivers are stuck, the company puts more drivers on the road. For UPS, a 5 minute delay on every driver every year costs UPS $110 million,” said UPS’ Morris.

“One of metro Atlanta’s biggest advantages is our multimodal transportation system,” said Miller with Home Depot, with a nod to the railroads that helped make Atlanta an economic powerhouse. “The future of our business will be heavily invested in utilizing those last mile connections.” The home improvement chain certainly knows about last-mile connections: the goods from manufacturers around the U.S. and the world eventually have to reach stores located everywhere from downtown NYC to small towns in California.

Because most companies like UPS can’t deliver off-peak, finding ways to reduce demand or more efficiently utilize roadway space at peak times can be a win-win for everyone. A robust and heavily-used transit system in a metro region could be a freight company’s best friend, moving large numbers of people quickly during peak commuting hours without having to take up space on highways they depend on, while also lowering transportation costs for metro residents. UPS’ Abney illustrated this people-first way of thinking in the superb conclusion of his editorial.

America’s transportation infrastructure can become stronger and more efficient if we work at moving people, not just planes, trains and automobiles separately. “Good” can’t be defined exclusively according to road engineering manuals, and while a nationwide “people-based approach” might sound idealistic, it’s also the approach most informed by bottom line impact. A truly functional transportation infrastructure system isn’t just about how many cars we can fit on a particular stretch of highway; it might be, for example, about how we can allow trucks to deliver along busy retail corridors, or how we can best facilitate customers being able to reach their local businesses, no matter where they are in the world.

Put differently, to really get the best bang for our infrastructure buck, we must measure and account for how transportation investments drive growth and support quality of life. The questions we ask about infrastructure need to change accordingly. Are there ways to achieve the same transportation goals by investing limited resources differently? Are we investing in the research, engineering and alternative fuels that will transform commutes and save money? And are we thinking about ways to “right-size” projects–selecting infrastructure investments that might accomplish 90 percent of our goals, but at a fraction of the cost?

Read the full UPS piece here.

Our thanks to Dave Williams and the rest of the team at the Metro Atlanta Chamber for hosting and organizing the terrific policy breakfast.

Congestion rankings make news, but what do they really mean? Very little for most residents

The Texas Transportation Institute always garners a flurry of headlines with the release of the annual Urban Mobility Report and its Travel Time Index (TTI), which purports to rank metro areas by congestion. Oft-cited and interesting though they may be, however, the rankings don’t really say much about the lives of the people who live in those places.

That’s because the TTI is a theoretical construct that doesn’t fully reflect what we experience on a day-to-day basis. Its fixation on peak-hour speeds ignores the actual time and distance of most residents’ commutes.

As an example, consider the findings for Chicago and Atlanta, two metros that ranked close together in the report released this week, as they have in years in past. According to the 2012 Travel Time Index (pdf), they’re near the top with scores of 1.24 and 1.25 respectively, and tied for seventh in yearly delay per commuter.

The graphic below was created based on an earlier Urban Mobility Report, from 2009, but its key points are valid today. At the time Chicago was actually 23 percent worse than Atlanta according to the TTI. That must mean the commute for most Chicagoans was worse than for most Altantans, right? Well, actually … no.

Chicago Atlanta travel time

In truth, Chicago commuters had an average travel time of almost twenty minutes less than their counterparts in Atlanta. In Chicago, the average peak period travel time is 35.6 minutes – 38 percent less than the 57.4 minutes in Atlanta. A major reason for the better highway performance in Chicago is that drivers do not have to travel as far as drivers in Atlanta – 13.5 miles compared with 21.6 miles.

Study that for a minute. Most Chicagoans live closer to work and spend less time getting there. Metro Atlanta residents spend much more time in the car. Yet the two are ranked similarly because the difference in traffic speed during peak hour versus off-peak (say, 3 a.m.) is similar in both places. Ultimately, the TTI doesn’t really care about overall quality of life for the majority of residents. It’s all about how fast you can drive at peak hour.

The Washington, D.C. and Denver metro areas are two that have seen their congestion rankings remain stubbornly high. In truth, though, both places have seen pay-off from actions that are expanding the share of homes in walkable neighborhoods with access to good public transportation and other options. As a result, commute distances are dropping. More people are living closer to work, more are walking, biking or taking transit to work. They are avoiding peak-hour traffic altogether – or spending less time driving because jobs and shopping is closer together. That’s making life better for them – they report enjoying their commutes more than freeway travelers – and it’s taking the pressure off the overcrowded freeways.

We’re not big fans of congestion. We think a lot of it could have been avoided with better planning and smarter development. But doing more of the same is not going to solve the problem. That’s why it’s so critically important that the performance measures being adopted by states and the feds under the new MAP-21 look beyond the blinkered TTI and delay measures for indicators of transportation success. How far do most people have to travel for work? How long does it take them? What is most effective at reducing the amount of time it takes to get places? Those are the kinds of metrics we need to use in order to find real solutions to help people spend less time in or stay out of those rush-hour traffic jams.

Telling only half the story of congestion, travel time and the quality of our metro areas

A popular study on traffic and congestion in our metropolitan areas is widely cited by the national, state and local media with every annual release, but it doesn’t tell the entire story. Far from it. That’s because measuring congestion while ignoring the actual time and distance spent commuting is a poor measure of what residents’ actually experience on a day-to-day basis.

The popular and oft-cited Texas Transportation Institute’s annual Urban Mobility Report isn’t an incorrect metric, it just tells half of the story. For starters, let’s consider two metros that appear to be ranked pretty close together in the latest report out today. Atlanta and Chicago appear to both be pretty miserable in regards to congestion, right? According to the 2012 Travel Time Index (pdf), they’re near the top with TTI scores of 1.24 and 1.25 respectively, and tied for seventh in yearly delay per commuter. (In 2009, Chicago’s TTI was 1.43 – 23% worse than Atlanta’s 1.35.)

That must mean that the commute is just as bad in both of these areas, right? Well, no.

Chicago Atlanta travel time

These statistics are from 2007, due to a limitation with how we can break down the TTI data.

Take an informal poll of your friends and co-workers: Who wouldn’t agree that a 35-minute commute is better than a 57-minute commute? Then why do we rely on measuring performance in a way that says the exact opposite? The TTI is almost the exact same for these two metros now, yet Chicago commuters had an average travel time of almost twenty minutes less than their counterparts in Atlanta a few years ago. That’s because TTI focuses only on how fast we can drive at peak while ignoring how far apart the destinations are in these two places.

In Chicago, the average trip to work is 35.6 minutes – 38% less time than the 57.4 minutes it takes Atlantans to drive to work. A major reason for the better highway performance in Chicago is that drivers do not have to travel as far as drivers in Atlanta – 13.5 miles compared with 21.6 miles. The amount of time it takes to go somewhere isn?t just about speed, that’s only half of it — it?s influenced both by how fast you travel and the distance you have to travel. Chicago and Atlanta are different places, so what about comparing an apple to an apple?

Denver, Colorado (8th worst TTI in 2012) has experienced a rebirth in its city core in the last decade or two, with residents flocking to new apartments and homes in the city center and close-in neighborhoods, attracted in part by the huge investment in regional transit. More people live near transit today in Denver than years ago, and with accompanying investments in new housing and jobs near transit and in more walkable neighborhoods, that means more people have shorter trips to get to work each day. Yet TTI shows that commuting in Denver is far worse in 2007 than it was 25 years ago. (TTI in 2012 is 1.27)

Denver 1982-2007 travel time 2

Look at the average travel time in 2007 in Denver compared to 25 years ago — it’s about the same. Rush hour delays have almost tripled, but the travel time without traffic (a good proxy for the average length of trips) actually decreased by almost ten minutes. Destinations are closer. Residents have more options. Commuters take shorter trips.

HPIM6863

Denver downtown construction near light rail. Creative Commons Flickr photo by vxla ***

Relying solely on TTI to try and measure congestion and travel time in your city is like measuring only measuring two dimensions of a three-dimensional object. Like measuring the length and height of a new couch for your living room while ignoring the depth. The couch is 48 inches tall, but without measuring the depth, do you have any idea if it’ll fit through your front door?

This gets at the core problem with TTI — when cities and regions (or the USDOT) rely solely on TTI as the single measure of congestion and make all their decisions about future transportation investments based on only part of the whole picture, regions prioritize projects to reduce TTI or shave a few seconds off of rush hour delay.

Legislators, the Federal Highway Administration, state DOTs, and newspapers all use the Travel Time Index to measure highway performance. Then we spend millions or billions to build projects that lower this number, but we rarely get to work in less time.

As the nation shifts to a performance-based transportation system — beginning under MAP-21 — it is key that the first national performance measures get this right. Any national performance measure needs to allow communities to consider both factors — speed and distance.

There’s probably a handful of federal, state or local legislators looking at the headlines in their local newspaper today about congestion in their metro region. Maybe they’re saying “we’ve got to do something about this!” We need to do “something” — they’re right! But accurately measuring the problem is the only way to find an appropriate solution.

Let’s start there.

Debunking the congestion index used to justify the policies that keep us stuck in traffic

Interstate 24 Traffic Originally uploaded by Transportation for America to Flickr.

The cycle is familiar by now. A study tells us what we all know: our roads are congested. We pour billions into new roads and lanes to “reduce congestion.” Then the study comes out two years later and just as before, our roads are still congested. There’s a call for new roads, new roads open up, we drive further and further, congestion goes up. Rinse and repeat.

Every two years, nearly every major media outlet in the country reports on a “congestion index” study that ranks metro areas and cities by their relative amount of traffic congestion. But a significant new report from CEOs for Cities suggests that there’s a fundamental flaw in that study from the Texas Transportation Institute, and by failing to accurately measure congestion or pinpoint what is producing it in our cities, we’re failing to truly understand the problem.

And when you don’t understand the problem, how can you ever really fix it?

Noah Kazis at Streetsblog most succinctly describes how the TTI study fails to see the whole picture:

Imagine two drivers leaving downtown to head home. Each of them sits in traffic for the first ten miles of the commute but at that point, their paths diverge. The first one has reached home. The second has another twenty miles to drive, though luckily for her, the roads are clear and congestion doesn’t slow her down. Who’s got a better commute?

Shockingly, the standard method for measuring traffic congestion implies that the second driver has it better. The Texas Transportation Institute’s Urban Mobility Report (UMR) only studies how congestion slows down drivers from hypothetical maximum speeds, completely ignoring how long it takes to actually get where you’re going. The result is an incessant call for more highway lanes from newspapers across the country.

The reason why we find ourselves in this situation is because our current federal transportation policies virtually guarantee it. There’s no financial incentive for anyone to measure congestion accurately or improve it — states just get a big load of federal transportation money with few strings attached. Congestion doesn’t get better in large part because states and metro areas aren’t required to reduce congestion or try to shorten or reduce trips with their federal money.

If a state wants to spend some of their federal money on a new comprehensive metro transit system to provide drivers some relief by giving them an additional option as well as taking cars off the road, the process takes years longer and is far more complex. What state, given the choice, would choose to invest in projects that take 4 times longer to get approved and require more local money to build? (Transit projects have about 50% of the cost paid by the federal government, highways get around 80%.)

As this new study demonstrates, the lack of proper metrics to measure success (or mostly failure) is emblematic of the need for reform.

If the ultimate point is to make smart transportation policy, we need to look at a lot of different factors that affect people’s lives. Fixating solely on interstate throughput, while failing to offer other travel and living options, has led our state departments of transportation to invest billions to create a result that is choking the lives out of our regions and isn’t making life better for the vast majority of commuters.

The good news is that places that are attempting to reduce trips and congestion by investing in diverse transportation options are actually showing progress. Regions that have been aggressively investing in additional travel options, eliminating trips, reducing trip length, creating more places to live close to jobs or more effectively managing demand have seen their congestion numbers get better, according to the CEOs for Cities report.

All of this is just one more giant sign pointing to the need for a truly reformed transportation program that can more accurately measure the problems we face, prescribe solutions that will work, and get out of the way as we unleash those solutions on the traffic that is killing our productivity and choking our regions while we motor along at 10 mph with no other option.

IBM imagines a smarter planet with smarter transportation

“The systemic nature of urban transportation is also the key to its solution. We need to stop focusing only on pieces of the problem: adding a new bridge, widening a road, putting up signs, establishing commuter lanes, encouraging carpooling or deploying traffic copters.
Instead, we need to look at relationships across the entire system—and all the other systems that are touched by it: our supply chains, our environment, our companies…the way people and cities live and work. Traffic isn’t just a line of cars: it’s a web of connections.
‘Smart traffic’ isn’t yet the norm—but it’s not some far-off vision of tomorrow. In many places, IBM is helping to make it happen today.”
From IBM’s Smarter Traffic page.

Perhaps you’ve seen the IBM commercials touting the fact that for the first time in history, the majority of humanity lives in cities — and solving the challenges facing our growing cities will be more urgent than ever before. One of the 21 programs of IBM’s “Smarter Planet” initiative focuses on traffic, congestion and what’s known as Intelligent Transportation Systems. (Others include cities, buildings and infrastructure.)

Last week, a forum sponsored by IBM as part of their Smarter Planet series that focused on improving transportation systems through technology yielded important lessons from some of our European counterparts.

Two speakers – Dr. Leo Kroon of Netherlands Railway and Gunnar Soderholm of Stockholm, Sweden – were among the highlights of “A Smarter Transportation System for the 21st Century,” held on Capitol Hill last Thursday.

Kroon described the importance of rail in his “tiny country,” whose 16 million people make it extremely dense. According to Kroon, rail market share between some Dutch cities reaches 50 percent, an amount that would be unheard of in the United States. And rather than force anyone onto the train, Kroon says the Netherlands Railways “seduces” them instead, through continued technological improvement that makes travel convenient and a commitment to reliability and affordability.

For instance, Netherlands Railway has introduced a SmartCard system and is improving its monitoring systems to pinpoint its flow of passengers and accommodate them as efficiently as possible.

The report out of Stockholm was even more compelling.

Gunnar Soderholm, head of the city’s Environmental and Health division, explained how a congestion charging scheme went from “biggest political suicide ever in Sweden” to embraced by even the most right-wing parties. The policy itself was made easier to implement than other cities because Stockholm proper is composed of several islands, with easy boundaries around the central business district.

After implementing the policy – in which drivers are charged for bringing autos into the business district during peak hours – the conventional wisdom was that people would need to see numbers showing its impact. According to Soderholm, no numbers were needed. Everyone could see the difference. “It was free flow all the time,” he said. Stockholm saw a 20 percent reduction in traffic, a 30-50 percent reduction in travel time and a 10-14 percent reduction in carbon emissions. Many more Stockholm residents are combining auto use with more walking and bicycling. Revenues from the charge are directed toward transportation infrastructure.

Stockholm is aiming to be fossil fuel free by 2050.

Innovations are also underway here at home. Judge Quentin Kopp, a decades-long transit advocate and former chairman of the California High Speed Rail Authority, explained how his home state has pledged to match dollar-for-dollar every piece of stimulus funding for high-speed rail. Kopp has been on the frontlines of the cause from the beginning, battling with former Republican Gov. Pete Wilson over a commission and, just two years ago, helping to shepherd narrow passage of a statewide ballot measure to fund high speed rail in the State.

Congressman Earl Blumenauer, a Portland Democrat, concluded with a window into how innovation and technology can guide efforts on the Hill. The big question: how does Congress pay for the next transportation bill? Blumenauer is an advocate of a vehicle-miles-traveled-tax and has pushed legislation to allow pilot projects across the country.

There remains great potential to both learn from our friends abroad and build upon successes here at home.

(Graphic below from Smarter Planet’s Transportation page.)

Driving down in 2008, congestion down much more

Interstate 24 Traffic Originally uploaded by Transportation for America

Due to the impact of high gas prices, the economic slowdown, and a growing preference for public transportation and other options for getting around, congestion was down in 2008 over 2007, marking the first two-year decrease in congestion since the Texas Transportation Institute began keeping track in 1982. Today, TTI released their bi-annual Urban Mobility Report today on the state of congestion and traffic in the U.S.

Some key findings:

Travelers spent one hour less stuck in traffic in 2007 than they did the year before and wasted one gallon less gasoline than the year before. The differences are small, but they represent a rare break in near-constant growth in traffic over 25 years.

  • The overall cost (based on wasted fuel and lost productivity) reached $87.2 billion in 2007 — more than $750 for every U.S. traveler.
  • The total amount of wasted fuel topped 2.8 billion gallons — three weeks’ worth of gas for every traveler.
  • The amount of wasted time totaled 4.2 billion hours — nearly one full work week (or vacation week) for every traveler.

One cause of the decrease in congestion is the same cause responsible for the lower numbers of highway fatalities — Americans have been driving less and less. Vehicle miles traveled (VMT) growth rates have been in decline since 2005 and in 2007, total VMT and per capita VMT actually decreased for the first time since World War II. High gas prices and the recent economic downturn have contributed to these declines, but VMT was actually in decline well before the shock of increased gas prices and the recession, and has continued to fall even as gas prices plummeted over the last year.

And while total vehicle miles traveled (VMT) went down just slightly, congestion is down much more significantly.

According to Feburary numbers from INRIX, a reputable traffic statistics service, just a 3.7% drop in vehicle miles traveled in 2008 resulted in a 30% drop in congestion in our 100 most congested metro areas. That means each commuter spent 13 less hours stuck in traffic in 2008 over the previous year. And in slight contrast to the TTI report, the report found that overall, “99 of the top 100 most populated cities in the U.S. experienced decreases in traffic congestion levels in 2008 as compared to the prior year.” Small reductions in how much we drive each year have a much larger impact on congestion.

The best way to reduce congestion and help Americans save money, time and fuel is to get smarter about managing traffic and offer increased options such as public transportation, telecommuting and incentives for carpooling, bicycling and walking. There is ample evidence that shows that reducing peak hour traffic by just a small percentage will dramatically reduce congestion and all of the costs associated with traffic.”
— James Corless, T4 America

There’s no doubt that the sagging economy had a hand in reducing how much we drive. But regardless of the current economy, most Americans seem to be looking for ways to drive less — not more. So what if we invested more in the positive ways to reduce the amount we have to drive by making other options for getting around accessible, convenient, and available to more people?

With public transportation ridership still going up — even as driving is going down — it’s clear that people who have choices for getting around use them. People are looking for other convenient ways to travel that can get them out of traffic and save them time and money.

And as the INRIX numbers show, if we can make it easier to get around and increase the options for doing so, everyone behind the wheel benefits as congestion decreases. (And despite the decrease overall, the current $87 billion in congestion costs isn’t good news, by any stretch of the imagination.)

It’s unquestionable that the recession has had an impact, giving us some momentary slack in congestion. But what will we do with the breather? When the economy begins to pick back up again and people start driving more, will we head straight back into gridlock? With driving down and public transportation up, will we make more investments in the kinds of transportation options people are clamoring for, the kinds of options that can reduce congestion and make travel more painless for everyone?

Or will congestion simply mount as the economy rebounds?

A day of air travel over North America, and what it means for rail

From Wired Magazine via Aaron of Streetsblog comes this amazing map and video that shows a day of air travel over North America. Using data from the Federal Aviation Administration and a service called FlightView that tracks airline travel each day, artist Aaron Koblin created this Google map that shows 24 hours of airline travel on August 12, 2008.

Aaron Koblin Airline Travel

There’s also a breathtaking movie version of this same map, that shows the flights in real time through the course of the day.

The sheer number of airplanes traveling over the United States is simply mind boggling. On this day chronicled in the map, the FAA tracked 205,000 flights in U.S. airspace. Anyone who has ever traveled by plane knows that we have plenty of air above our country, but the problem is the fact that too many of them need to be in specific pieces of air at the same time. Or traveling through the same crowded airports.

Watch the movie and look at what happens to the east coast — especially the northeastern corridor — during the major commuting hours. Our major airports are bursting at the seams, and our air traffic control system, while among the safest and most professional in the world, is hard pressed to keep up with the growing demands placed on it. (more…)