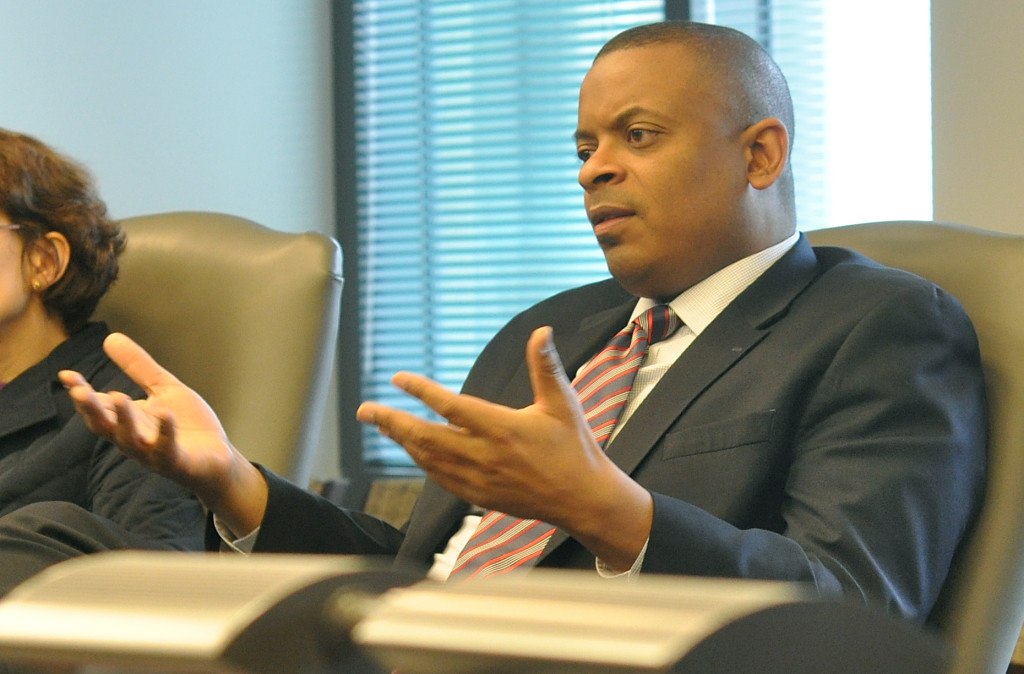
T4America brought together a group of mayors to visit with U.S. Secretary of Transportation Anthony Foxx — a former mayor himself — and deliver a message about the importance of passenger rail to the economies of those local communities they represent.
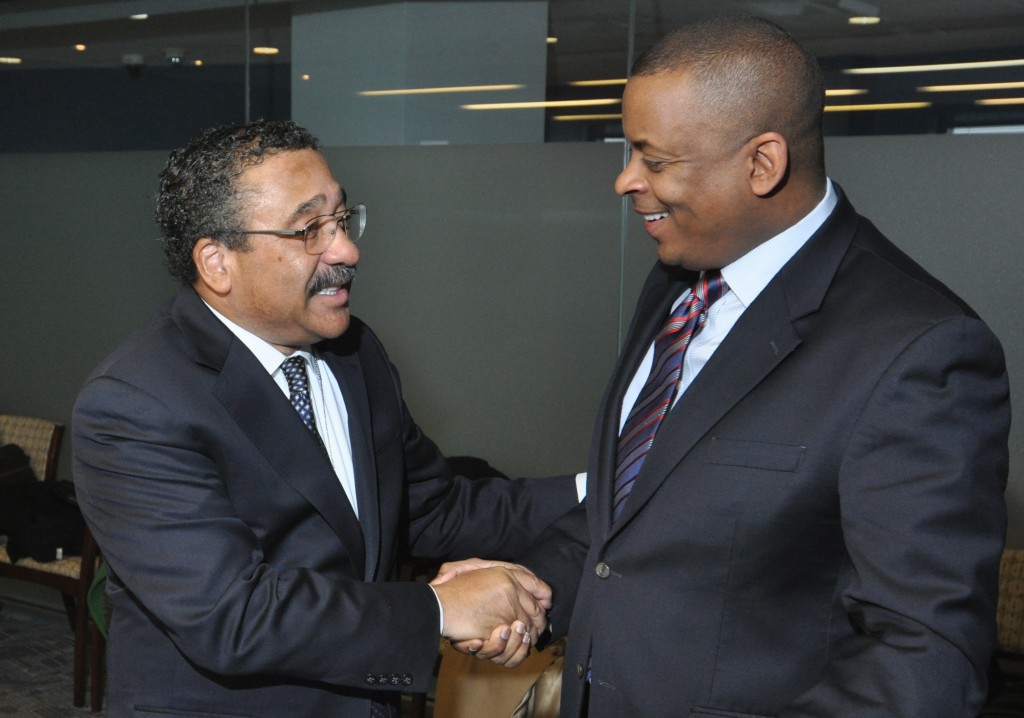
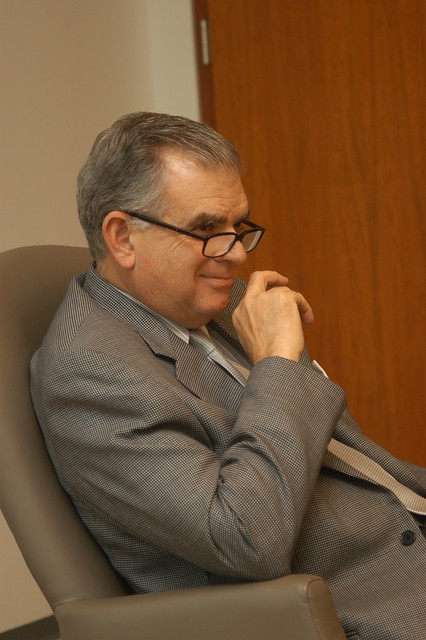
Mayor Marks of Tallahassee, Florida greets Sec. Foxx before a meeting at USDOT on 12/17/2013
There are few who better understand the importance of passenger rail as a transportation option and economic development tool than do mayors. That’s why we brought a bipartisan group of mayors from cities across the country to Washington, D.C. for a meeting with Sec. Foxx today.
Passenger rail service has been booming in this country, setting monthly and yearly records as surely as the pages of the calendar continue to turn. Not including the many commuter rail systems operating in the U.S., about 85,000 passengers ride on more than 300 Amtrak trains each day, with more than 31 million passengers taking a trip last year — an all-time ridership record for the nation’s passenger railroad.
The bill (PRIIA) that sets policy and authorizes funding for Amtrak expired on Sept. 30, 2013. Congress is overdue to write its replacement, and there’s a lot of discussion about what sort of reforms need to be made and how much funding to invest in our country’s passenger rail system.
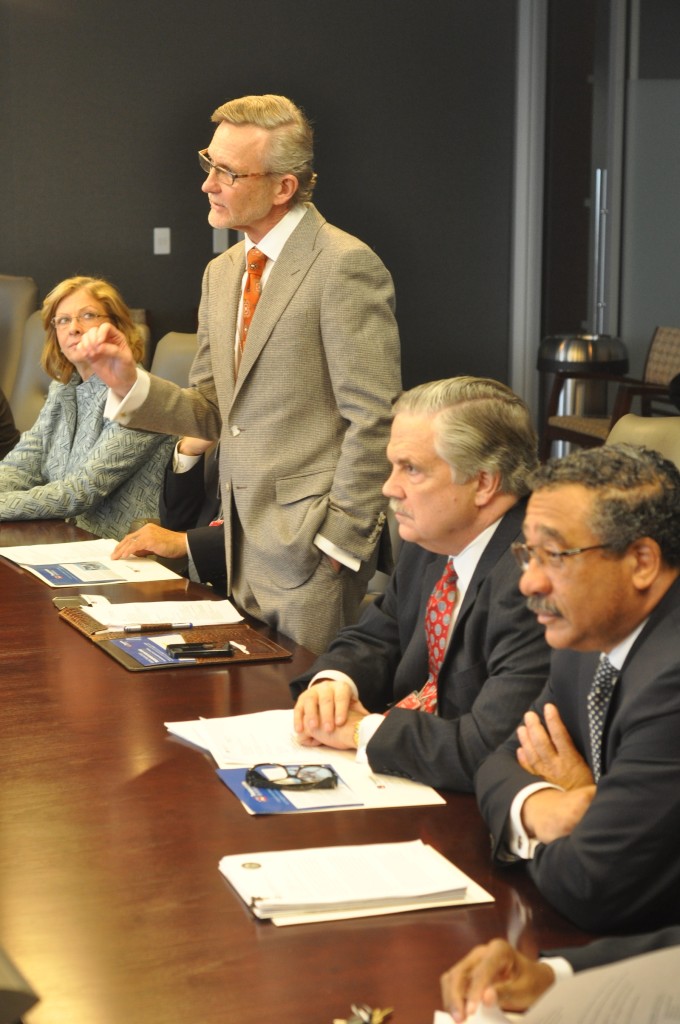
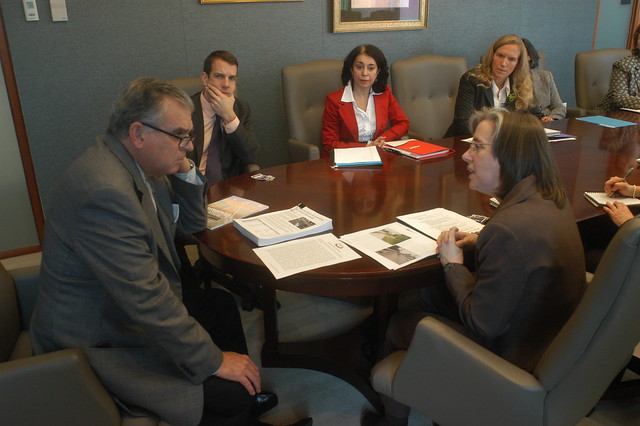
From left, Mayor McFarlane of Raleigh, North Carolina; former Mayor John Robert Smith with T4America; Mayor Danny Jones of Charleston, West Virginia; and Mayor John Marks of Tallahassee, Florida in the meeting with Secretary Foxx on Dec. 17, 2013.
Mayors like these know firsthand that passenger rail supports economic development in their cities and provides vital connections to other cities near and far, and that’s a message that needs to be heard at USDOT and in Congress right now.
Mayors in North Carolina’s Triangle region are raring to go with more improvements and added service for their existing passenger rail connections, and in fact, they’re already seeing the economic impacts.
Mayor Nancy McFarlane of Raleigh, North Carolina shared how a TIGER grant that helped her city start work on a station to connect Amtrak and local transit service under one roof has already reaped rewards. “400 jobs are there already, just from announcing the plans for the station,” she said. And next door in Durham, Mayor Bill Bell is on the same page, telling Sec. Foxx that “it’s no question that the demand is there — we just need the capacity.”
Charleston, West Virginia Mayor Danny Jones remembered how the trains were one of the few things moving after 9/11 for those days that air travel was shut down.
“The price we pay for Amtrak each year — that’s a small price for having a good substitute transportation system for this country. It’s there for us, and we need it,” he reminded everyone.
At the end of the historic Crescent Line in New Orleans, Louisiana, Deputy Mayor Grant provided a poignant reminder that during Hurricane Katrina, rail service was actually the only way out of the city at times.
Not too far east, Tallahassee, Florida was one of the handful of cities that lost their passenger rail service because of Katrina and has yet to see it return.
“I want to focus the conversation on economic development,” Mayor John Marks began. With 75,000 university students and staff between Florida State, Florida A&M and a sizable community college (as well as baby boomer retirees flocking to Tallahassee) all within a few miles of the train station that’s right off the main street, he said that moving people more efficiently has significant economic implications. Reconnecting that service through Tallahassee “is a significant tool for our economic development,” he said.
Saco, Maine is a small town where the city invested $2.5 million into the old train station downtown, which is in turn spurring the development of nearby abandoned mills into mixed use buildings. “We’re invested,” said Mayor Donald Pilon. “And the investment is paying off. The train station is the draw for the developers.”
“This train drives southern Maine’s economy,” Mayor Pilon declared, while mentioning all the destinations connected to Saco by the five daily trains.
Our co-chair and former Mayor John Robert Smith is fond of telling the story of how he got involved firsthand years ago in Meridian, Mississippi when the passenger line that runs right through his town from Atlanta to New Orleans was on the chopping block. It wasn’t just the fact that a lot of his constituents depended on that passenger rail service as the only way they could visit relatives, see a doctor in a bigger city, or take a vacation. The downtown train station was also an important transportation hub and in the process of being transformed into a new center of economic activity for Meridian. And once that service was preserved, the restoration of the station helped usher in millions of dollars in economic impacts through new and renovated buildings in the downtown core.
From Mayor John Marks in Tallahassee, Florida all the way up to Mayor Donald Pilon in Saco, Maine, mayors know the importance of investing in reliable, on-time passenger rail connections.
Secretary Foxx, not far removed from his time as Mayor of Charlotte, N.C., told all the mayors that their work delivering this message here and back at the state level can carry greater weight for members of Congress than a message from him at USDOT. It’s got to come from the local level, he said.
He closed the meeting by letting the mayors know that USDOT wants to be in the business of helping them realize their visions.
Hopefully Congress will hear the message from these mayors and dozens of others loud and clear — and act on it as they begin work on passenger rail policy and funding for the next few years to come.


.jpg)

 With
With