
The traffic forecast used to justify your road widening is bogus

Highway lanes crisscross across an otherwise barren landscape. Rows of tightly clustered cars dot the lanes

The predicted traffic levels on which transportation planners base their decisions are erroneous and rooted in obsolete methods. Here’s how transportation models fail to accurately predict future traffic, and how you can call out their misuse.

Highway lanes crisscross across an otherwise barren landscape. Rows of tightly clustered cars dot the lanes
The 26-lane Katy Freeway in Houston had worse traffic after its widening than before. Were the traffic models wrong? Photo: Wikimedia Commons

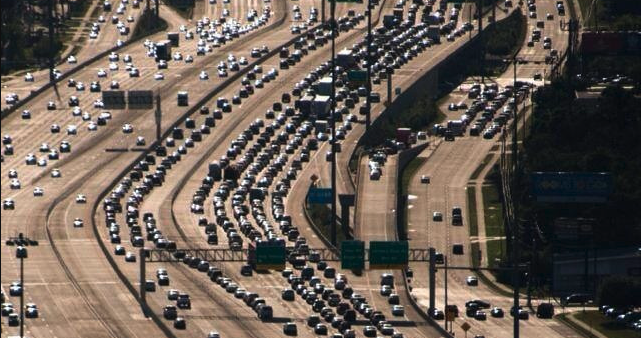
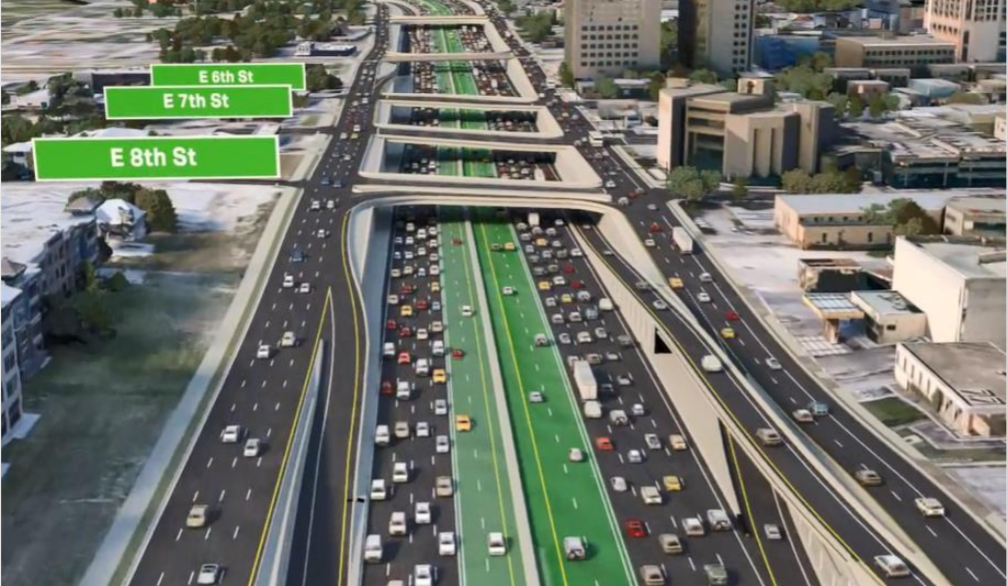
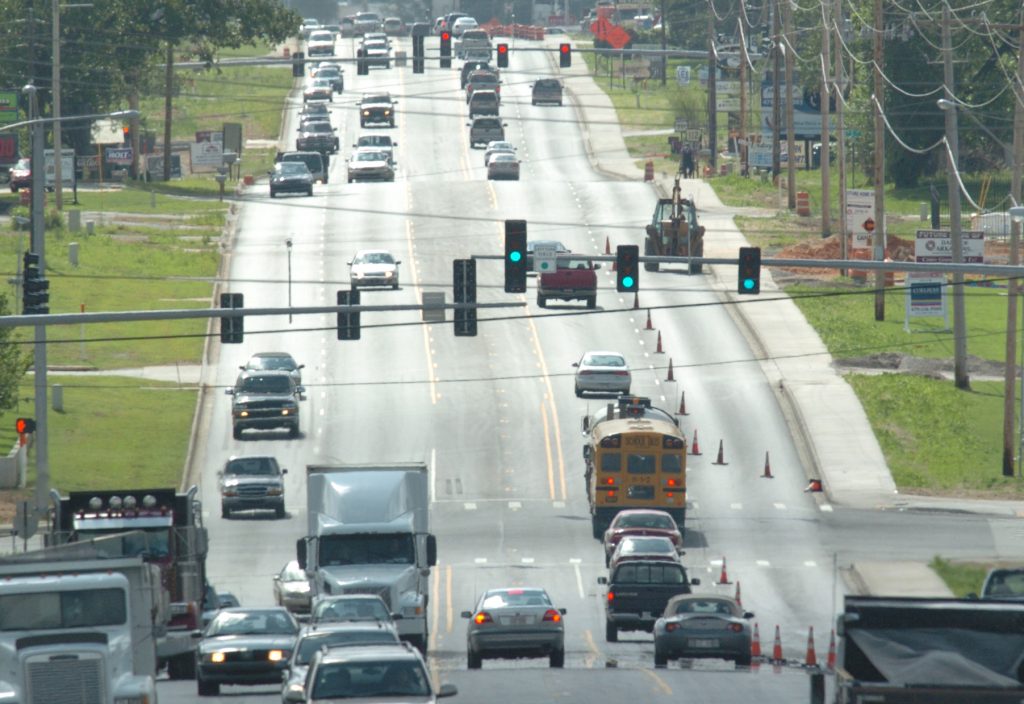
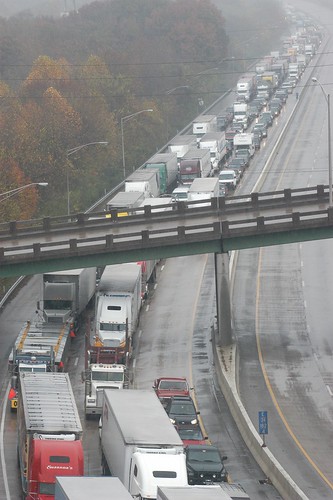
You’ve seen it before. A state DOT claims they must widen a highway through your community to reduce congestion and accommodate future traffic. The transportation agency points to traffic projections that we all take at face value. They might even claim that widening the highway will improve traffic flow thereby reducing emissions. You don’t want the highway widening in your community, but what can you do in the face of experts saying it is necessary and pointing to data that “proves” their case?

Transportation agencies use transportation models to predict future traffic and plan the roadway system accordingly. But the underlying algorithm for these models was developed in the 1980s when the computers in use were less powerful than today’s smartphones. Due to this past limitation in computing power, travel demand models use a simplified approach that doesn’t accurately represent how people make travel decisions.

T4America experts collaborated with our partners to look inside the black box of transportation models (also sometimes called travel demand models or traffic models). We submitted a memo to the US Department of Transportation asking them to apply more accountability to agencies using these models to correct them.

Some of the transportation models’ specific flaws

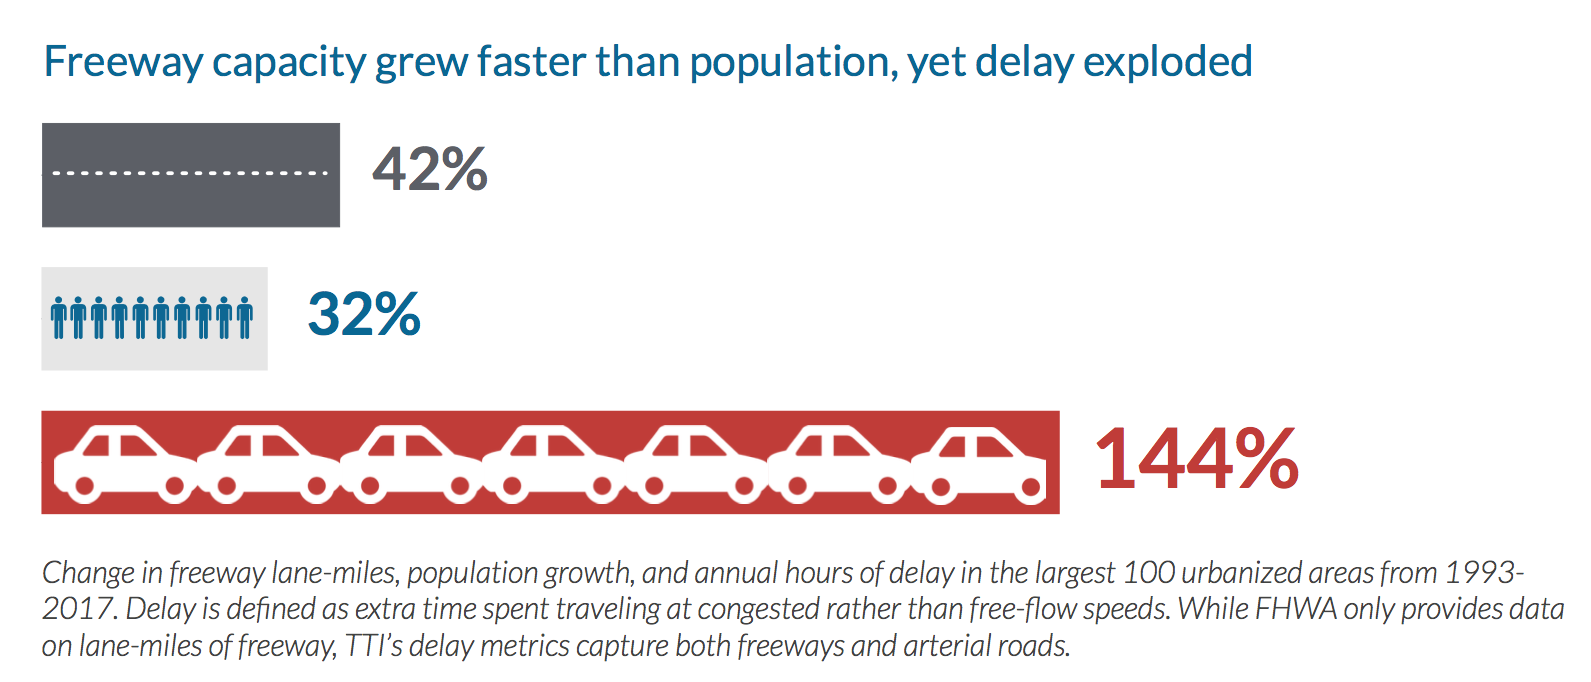
The proof that transportation models are failing us is plain to see in the long term trends. Over the last 20 years, congestion has increased in every single U.S. metropolitan area regardless of how much they’ve expanded their highways and regardless of whether their population grew or shrank.

Graphic showing increase in population, lane-miles, and delay from the Congestion Con report
From the Congestion Con

In what way have transportation models misled us? It largely has to do with the underlying approach which is too simple, chosen because of limited 1980s computing power. Transportation models use a Static Traffic Assignment (STA) algorithm which is a sort of snapshot in time of how much traffic is on each roadway in a region at a given moment. This static algorithm is problematic, since people make decisions on different factors every day, often in the moment. People are dynamic not static.

What’s more, STAs do not properly account for bottlenecks, or constrain forecasts based on roadway capacity. No roadway can ever carry more cars than its maximum capacity, any more than a coffee mug can hold 110% of its coffee capacity. Yet agencies routinely and confidently make claims like, “without this expansion, the roadway will be at 110% capacity.” If you point out that a roadway can’t handle more cars than it has capacity for, they say that extra 10 percent is “latent demand.” In other words, they are certain that there’s exactly 10 percent more cars and trips out there that must be served. 

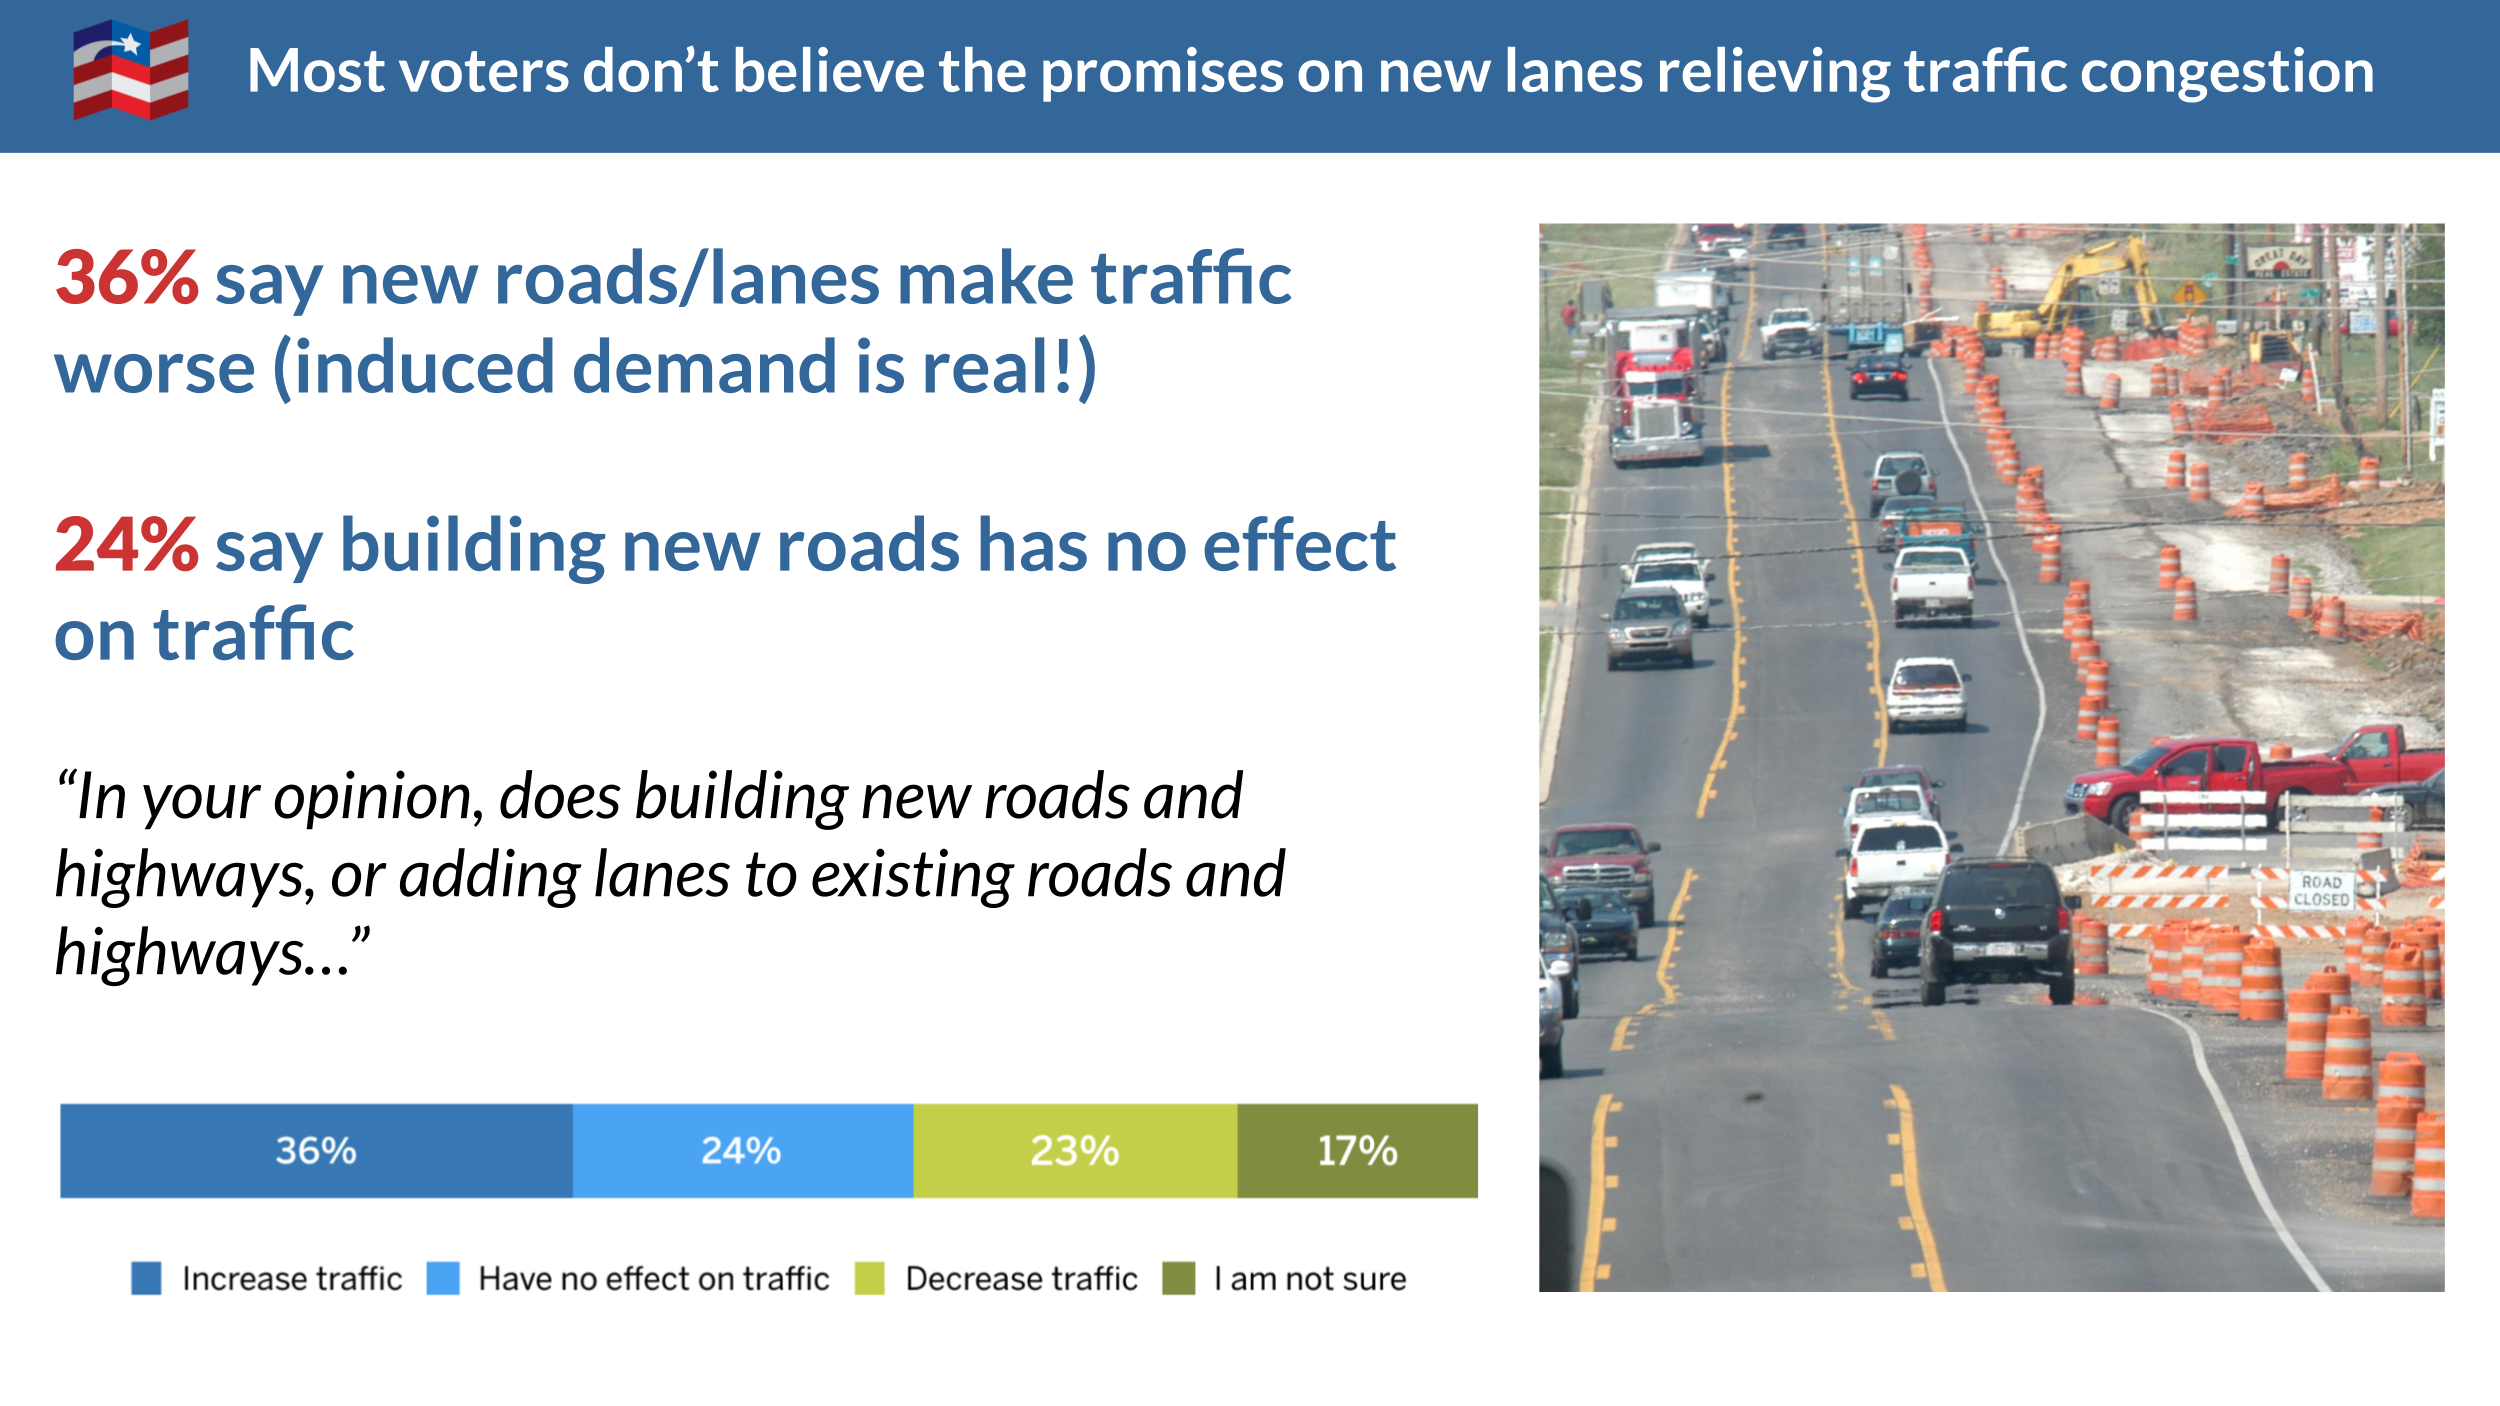
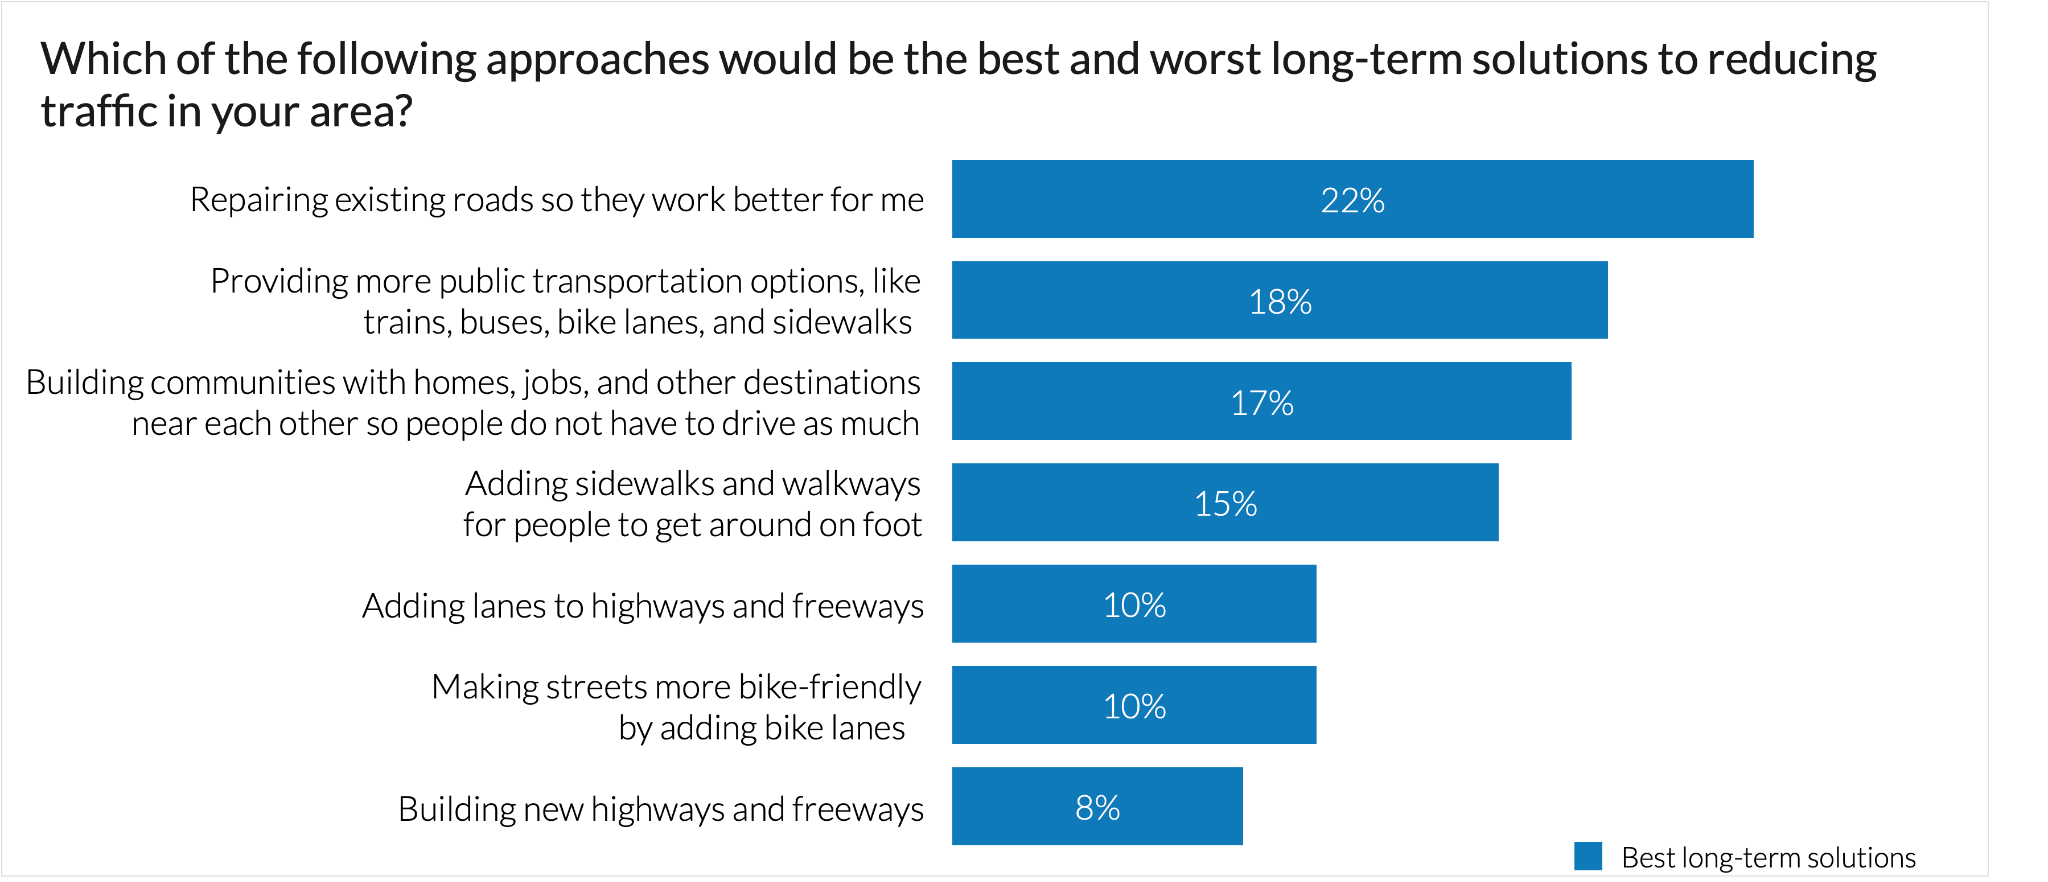
We call this induced demand—demand created by the new road itself—a concept those same agencies often claim doesn’t exist. (But which the public absolutely understands, as our brand new national polling shows.) By trying to sell the project on all that “latent” demand, they can claim a traffic nightmare if nothing is done without admitting that the project will actually create more traffic—and more greenhouse gas emissions, fine particulates, etc. [USDOT and the Environmental Protection Agency support that approach for some unfathomable reason, never asking if the models used to justify federally funded projects have been right.]

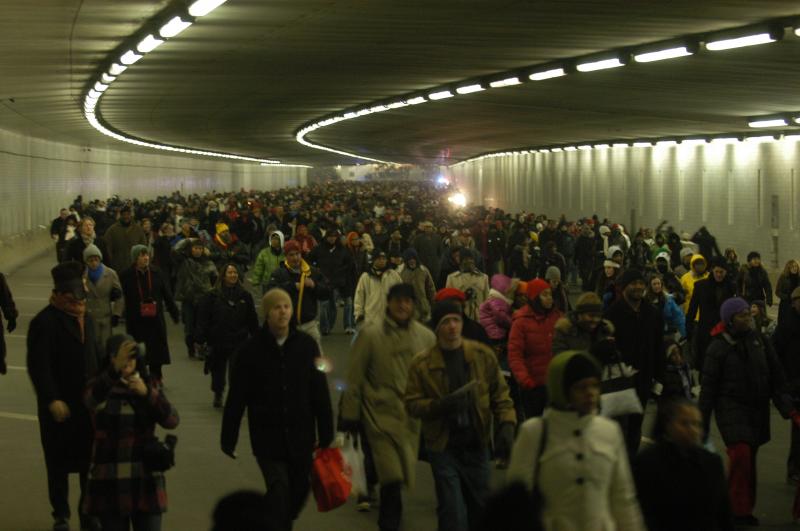
In reality, as congestion increases toward that 100% capacity mark, people make different travel decisions, change their routes, choose to travel at a different time, use a different mode or choose a closer destination to fulfill the same need. If there is a crash, people delay their trip or consult Google maps and choose a different route. But transportation models using the STA approach unrealistically assume people will blindly keep driving a congested roadway, no matter what is happening or how long their trip will take.

Not only does the model assume no changes in behavior, but it will also output results that show drivers stuck at one bottleneck, while simultaneously allowing them to magically pass through that one to also be stuck at another bottleneck downstream.

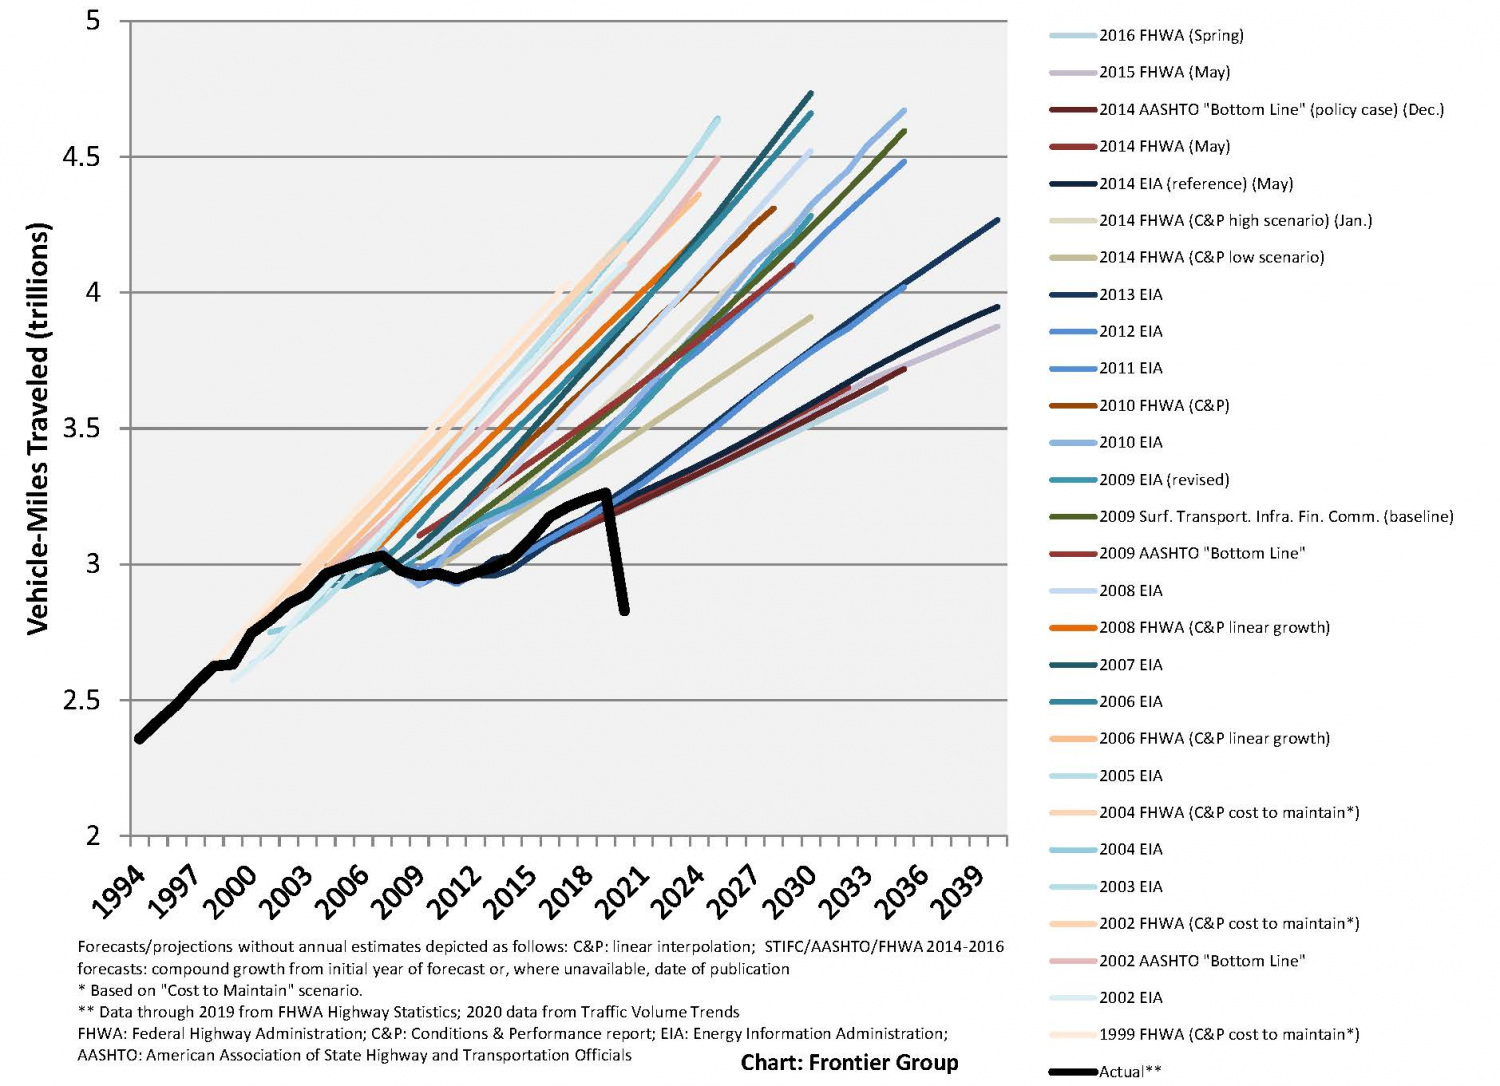
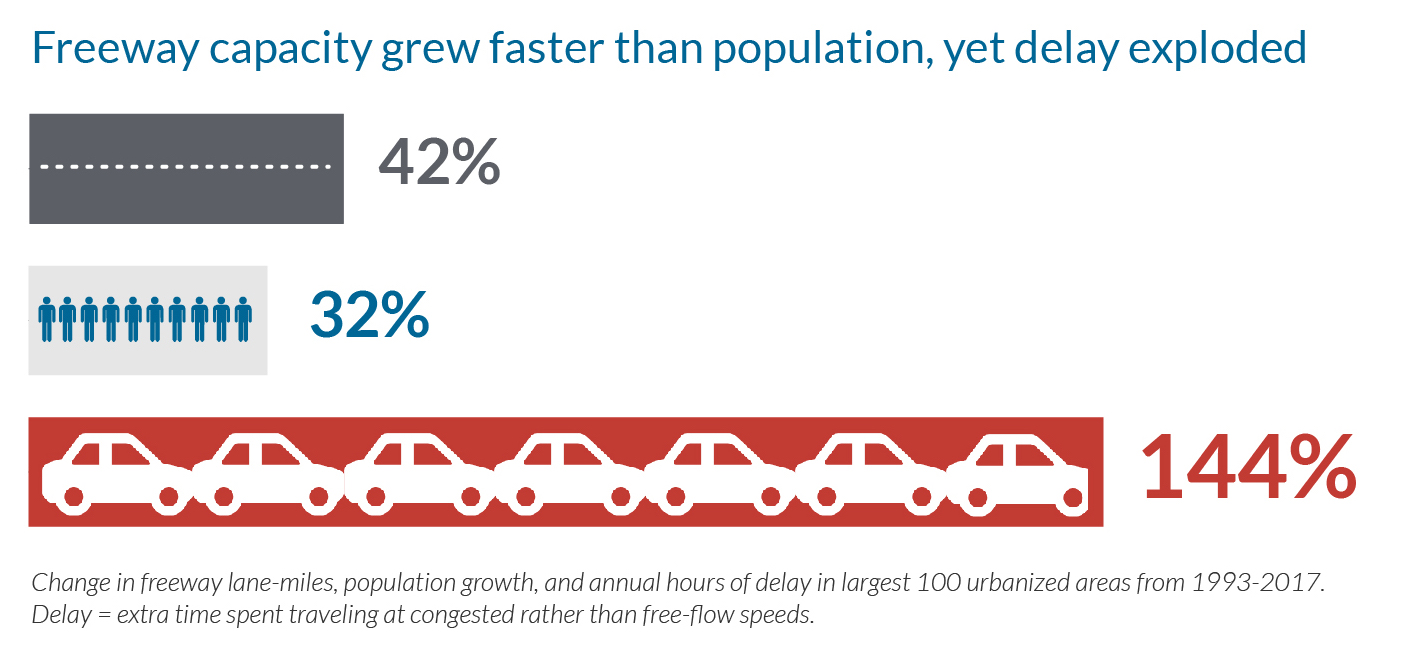
Compounding these issues, planners rarely, if ever, look back at their past work to see if their predictions were correct. Did the traffic materialize? We’re stuck with decades-old models that are never tested or upgraded to reflect reality, as shown here:

graphic combining 20+ increasing projections of VMT
This graphic from the Frontier Group combines past federal projections of future growth in vehicle miles traveled. Every year a new optimistic projection was made that ultimately didn’t pan out, but they kept on predicting the same thing.

How to question your region’s model

We’re hopeful that USDOT will eventually provide accountability to upgrade the state of practice on transportation modeling, but you can also ask questions about the transportation models used to promote road widenings in your community. Here are some things you can ask your local transportation planners to illustrate the flaws of using transportation model results to justify road widenings:

  1. Does your model use Static Traffic Assignment?
  2. What is the maximum volume to capacity in your model runs, and how is that realistic? (If they give a volume over 100%, ask how a road can carry more than its capacity. And ask if latent demand will fill the new capacity they are building then what good will this investment do?)
  3. How does your model account for dynamic changes in commuting patterns, responses to crashes, or the threshold at which people shift to other modes?
  4. What is your protocol for evaluating the accuracy of your past traffic projections and using that to improve upon the model? Where is it published?

Getting our transportation models to better reflect reality will help planners make better decisions about where to invest our tax dollars. Calling on USDOT to upgrade standards for transportation models, and calling out their misuse locally in the meantime will help us turn the corner to more sensible improvements to transportation in our nation.

82% don’t believe highway expansions are the best solution for reducing congestion

Graphic showing poll results referenced in text

New nationwide survey shows that prioritizing road repair, improving transit, and reducing driving are more popular options for spending transportation dollars

WASHINGTON, D.C. (June 29) — A new nationwide survey of American voters’ attitudes reveals a significant divide between voters’ attitudes about the best short-and long-term solutions for reducing traffic, versus the actual priorities of their state and local transportation agencies.  

Graphic showing poll results referenced in text

In 2021 The Washington Post estimated that highway widening and expansion consumed more than a third of states’ capital spending on roads (over $19 billion). These projects were backed by promises to reduce congestion. The public isn’t buying it. The results of a national survey of 2,001 registered U.S. voters—90 percent of whom own a car they drive regularly—underscores a widely shared belief that highway expansion doesn’t work as a short- or long-term strategy for reducing traffic and that we should invest more in other options.

  • 70 percent of respondents agree that “providing people with more transportation options is better for our health, safety, and economy than building more highways.”
  • 67 percent of respondents agreed that “expanding highways takes years, causes delays,  and costs billions of dollars.” The same percentage believes that “widening highways attracts more people to drive, which creates more traffic in the long run.” Only 11 percent felt state DOTs actually deliver congestion relief with highway expansions. In other words, the public understands the concept of “induced demand,” which is widely ignored by state legislatures, DOTs, Congress, and federal agencies.
  • 69 percent of respondents agree that “it’s more important to protect our quality of life than to spend billions of tax dollars on expanding highways. By removing a few miles of highway and adding more transportation options, like trains, buses, bike lanes, and sidewalks, we can have healthier communities.”
  • 71 percent of respondents agree that “no matter where you live, you should have the freedom to easily get where you need to go. Almost all government spending on transportation goes to highways. Instead, states should fund more options, like trains, buses, bike lanes, and sidewalks.”

The survey revealed a deep dissatisfaction with the overall status quo of state and local transportation spending which overwhelmingly prioritizes spending on new roads, often at the expense of keeping roads and bridges in good condition, investing in transit and safe streets for walking or biking, or reducing the need to drive overall.  Given seven choices for the best short- and long-term solutions for reducing traffic, the least popular option was “building new freeways and highways,” even as states are poised to spend tens of billions on new highways thanks to the 2021 federal infrastructure law. 

“Our country remains on a highway spending spree while requests for basic investments in walkability and transit are given low priority.  I hope this survey serves as a wake-up call to politicians that the public is clamoring for reasonable investments in our health, climate and quality of life, not traffic-inducing polluting highways,” said Mike McGinn, Executive Director of America Walks. 

Prioritizing the repair of existing roads and bridges first was the top option for how states should be investing their transportation funding (selected by 22 percent of respondents), though Congress has long agreed—in a strong bipartisan fashion—not to institute any binding requirements to prioritize repair first. 

“We’re repeatedly told by leaders on Capitol Hill that requiring states to prioritize maintenance first is just too controversial,” said Beth Osborne, director of Transportation for America. “But this survey shows yet again that there’s no controversy among the people they serve—they’re beyond ready to retire the last generation’s playbook when it comes to improving mobility and getting them where they need to go.”

While “reducing congestion” is the top policy goal that shapes the spending decisions of most state DOTs, traffic is not a huge stumbling block for most people to access what they need. Just one in four said they find it difficult to get around.

Survey respondents expressed positive feelings about a range of messages about spending transportation money differently, demonstrating that voters are looking for new ideas, policies, and/or investments that address their problems and deliver meaningful benefits to people and communities—instead of just doing the same old things over and over again. (See attached PDF for full results on pages 19-22, all of which were supported by over 60 percent of respondents.)

“These results are clear: Americans are eager to see the transportation investments that can connect and repair their communities,” said Rabi Abonour, a transportation advocate at NRDC (Natural Resources Defense Council). “Federal, state and local leaders should follow the lead of the public and invest in the public transit and related projects that will really improve mobility, clean the air, and address climate pollution.”

About the poll

Hattaway Communications, a strategic communications firm based in Washington D.C., was retained to conduct this survey of 2,001 registered voters and assess their awareness of relevant issues, attitudes toward transportation projects, and aspirations for their communities. The survey was fielded online, between February 23–March 7, 2023, and reflects the demographic and geographic composition of the United States. 

This survey was supported by the Natural Resources Defense Council and a grant from the Summit Foundation.

###

Transportation for America is an advocacy organization made up of local, regional, and state leaders who envision a transportation system that safely, affordably, and conveniently connects people of all means and ability to jobs, services, and opportunity through multiple modes of travel. T4America is a program of Smart Growth America. Learn more at t4america.org

America Walks is leading the way in advancing walkable, equitable, connected, and accessible places in every community across the U.S. We are the national voice for public spaces that allow people to safely walk and move. At the regional, state, and neighborhood levels, America Walks provides critical strategic support, training, and technical assistance to partner organizations and individuals to effectively advocate for change. https://americawalks.org/ 

The Natural Resources Defense Council (NRDC) works to safeguard the earth—its people, its plants and animals, and the natural systems on which all life depends. https://www.nrdc.org/about 

More highways, more driving, more emissions: Explaining “induced demand”

Even if we hit the most ambitious targets for changing our cars and trucks over to electric vehicles, we will fail to meaningfully reduce emissions from transportation without confronting this simple fact: new roads always produce new driving. This costly feedback loop referred to as “induced demand” is the invisible force short-circuiting the neverending attempts to eliminate congestion by building or expanding roads.

This gif explaining induced demand is from Driving Down Emissions

Today, Transportation for America is partnering with RMI and the Natural Resources Defense Council to release a new calculator that shows how highway expansion repeatedly fails to reduce congestion and instead increases traffic and pollution. The SHIFT Calculator provides transparency about new traffic created by highway widening and expansion so transportation agencies can make smarter, more sustainable transportation investments. Read the press release.

Check out the calculator here

Imagine a guy who, struck with a wild but charitable fever of generosity, decided to give away 100 gallons of tasty, free coffee every morning at a small downtown stand. During that entire first week, he struggled to give it all away before lunchtime and went home with quite a few gallons of leftover lukewarm coffee. In week #2, he started seeing familiar faces each day from the nearby buildings, because people walking by know a good deal when they see one (the low price of free!) Many of them returned each day and the coffee was gone by 11 a.m. By the third week, the word was out across downtown about the “crazy free coffee guy” and he started running out earlier each day. By the start of week four, people were coming from all over downtown and he had a line queued up waiting for him at 7 a.m. to ensure they got their free cup before work, and it was all gone before 9 a.m. 

Say hello to “induced demand.”

Giving something away for free shapes the behavior of those who want it

It’s a fundamental principle of economics: Provide a tangible good at no cost that people value and the demand will outstrip supply.

Yet political leaders and transportation agencies refuse to believe that this same basic principle will apply when they spend billions to widen or expand highways in the name of “solving” traffic congestion in urban regions, and then give away all of that newly created space for free. They refuse to believe that anyone will take new trips on the newly freed-up highway space, that people will shift existing off-peaks trips to rush hour, that someone on transit might decide to return to driving (like thousands of people did during the pandemic), or that developers might take advantage of the new capacity to build yet more houses or retail on land that’s now more easily accessible.

They refuse to believe that this is possible, even when all of that expensive new highway space fills right up in a short period of time, wiping out any benefits and failing to deliver on all those promises of speedy commutes, improved travel times, and money in our pockets from all the “time savings.”

Attempting to “solve” congestion by building new roads or expanding existing ones has been the animating purpose behind billions of dollars of federal and state transportation investment for decades now. 

Armed with this single-minded purpose and billions in no-strings money from the federal government, states have spent hundreds of billions of dollars to widen or build new highways. We built enough new roads and lanes from just 2009-2017 to build a brand new road back and forth across our enormous country 83 times. State transportation departments have added 5,325 new lane-miles just since 2015.

All the lanes we’ve built have led to a predictable increase in driving. From 1980-2017, per capita vehicle miles traveled (VMT) increased by 46 percent. In 1993, on average, each person accounted for 21 miles of driving per day in those 100 urbanized areas. By 2017, that number had jumped to 25 miles per day. Every year, Americans are having to drive farther just to accomplish the same things we did back in 1993 every day.

The problem isn’t too few roads

Delay skyrocketed in our 100 largest urbanized areas from 1993-2017, rising by 144 percent. Yet we expanded our freeway system in those areas by 42 percent, while the population only increased by 32% during that time. We built roads like crazy, yet delay just got worse.

Delay increased because new highways, roads, and lanes are proven to induce more driving, which leads to more emissions and ultimately more congestion. The evidence for induced demand is overwhelming. In a landmark study, Kent Hymel at Cal State Northridge suggests the relationship is perfectly correlated—a 10 percent increase in lane miles leads to a 10 percent increase in driving.

If you’re celebrating the notable but small climate and transit provisions in the current enormous infrastructure deal, you should know that this shortsighted 1950s-style deal will provide states with historic levels of virtually no-strings highway funding that they can continue to blow on the same old bankrupt strategy for congestion without even any basic requirements to repair things first.

Profligate spending on highways also undermines the relatively limited investments being made in other lower emission transportation options like biking, walking, and transit.

Why do transportation agencies deny this reality?

The unreliable models that agencies depend upon have a poor track record of success, but they never look backward to consider their accuracy or how they can be improved.  When is a state DOT ever held to account for repeatedly making predictions about traffic that fails to materialize? Who even remembers what they predict? This great thread from Kevin DeGood about Texas DOT’s repeated failure to make accurate predictions shows just how rarely anyone looks backward:

19 years ago, the Texas DOT predicted that average daily traffic (ADT) on I-35 through downtown Austin would be 330,000 daily vehicles by last year. The reality wasn’t even close: Actual totals in 2019 were only 201,000 daily trips. As Kevin notes, in 2016, with the state totally ignoring how wildly inaccurate their current projections were turning out to be, they projected “that total VMT on I-35 in the Austin area would increase by 50% by 2040.”

Rinse and repeat. 

TxDOT is certainly doing their best to make those 2040 projections come true. All it’s going to cost taxpayers is $5 billion to widen I-35 right through downtown.

If the state follows through on this staggeringly expensive project, they’d be creating millions of new trips and increasing pollution, all while failing to make a dent in congestion over the long term and wiping out hundreds of acres of some of the most valuable land in the entire state.

Screenshot of SHIFT calculator's results on Austin, TX I-35 widening project
This data comes from the new SHIFT Calculator’s estimates for the I-35 widening project which would add 42 lane-miles to the interstate through downtown Austin

The cynical answer to “why” is that if state DOTs around the country finally admitted that expansions fail to actually solve congestion, they would lose their #1 strategy of continued expansions that allow everyone other than the taxpayer to make more money. They’d be admitting that they’ve placed all of their bets on a losing horse, and they’ve been doing so for years. On top of that, they’d then have to do far more sophisticated work to better understand the complicated reality of our travel needs and rebuild their models from the ground up to focus on moving people rather than just “make cars go fast.” 

Even the most progressive states with ambitious agendas to lower transportation emissions aren’t fully willing to acknowledge this reality

Advocates and residents and local leaders need to start holding them to account. How?

We can’t put our heads in the sand anymore

This new, rigorously vetted calculator produced by RMI, the Natural Resources Defense Council and Transportation for America provides more accurate and transparent data about increases in driving and pollution, as well as the other impacts of highway expansions. 

Our hope is that advocates, local governments, and anyone who cares about finally getting more accurate and transparent data about increases in driving and pollution will use this new tool to hold their transportation agencies to account. And we want transportation agencies to use it to bring a fuller picture to their current transportation modeling that leads them to “solutions” that fail to address congestion, divide neighborhoods, increase pollution, devastate nearby communities, and fail to meaningfully improve our access to jobs and services.

Find a proposed project in your metro area and run it through the calculator.


Some parts of the above post were adapted from Driving Down Emissions, a report from Smart Growth America and Transportation for America which explores how changing transportation policy and land-use patterns are key to lowering greenhouse gas emissions.

New calculator shows how highway expansions increase traffic

graphic element

The SHIFT Calculator provides transparency about new traffic created by highway widening and expansion so transportation agencies can make smarter, more sustainable transportation investments.

A new tool released today provides anyone with the ability to estimate the increased traffic and pollution that will result from proposed highway expansions.

Over the past few decades, taxpayer dollars have funded billions of dollars in highway expansions intended to alleviate road congestion, but it usually does not take long for the traffic to return. This endless loop, known as “induced demand,” fails to address congestion while leading to more cars on the road and more pollution from the transportation sector, which is the nation’s largest source of emissions.

Using the State Highway Induced Frequency of Travel (SHIFT) Calculator developed by RMI, NRDC (Natural Resources Defense Council) and Transportation for America, anyone can now project the increases in driving that would result from highway expansions. The Calculator provides transparency and accountability for transportation projects that often do not deliver on promised benefits and instead make traffic and pollution worse. This new tool will enable transportation agencies to account for the principle of induced demand in the planning and implementation of highway projects.

“Road expansion projects have failed to deliver the promised benefits. In fact, the evidence shows that they actually make traffic and pollution worse,” said Ben Holland, manager in RMI’s Urban Transformation Program. “To achieve US climate goals, we must reduce the amount that the average person drives by 20%. This tool shines a light on the impacts of highway expansion and shows how these projects often move us away from our goals.”

The SHIFT Calculator was based on RMI’s Colorado Induced Travel Calculator, which advocates used to show that proposed and in-progress road expansions would increase vehicle miles traveled by up to 3% by 2030, at a time that the state is aiming to reduce those roadway miles by 10%.

“This easy-to-use tool will help advocates make their case to city and state transportation departments,” said Carter Rubin, a transportation strategist at NRDC. “So many of us have seen firsthand how quickly traffic returns when extra highway lanes open up, and this calculator provides the numbers to back up that experience. If cities and states really want to get residents out of traffic and cut down on smog, they should make it easier and faster for people to ride public transit, bike and walk.”

“For 90 years, we have known that building new lanes creates new vehicle trips that fill those lanes, and for 90 years, we have mostly ignored this fundamental law while repeating the same mistakes at great cost,” said Beth Osborne, director of Transportation for America. “We must stop making empty promises about congestion reduction that never materialize. Having the ability to estimate added travel caused by expansions can finally equip decision makers and the public with the data to make the case for something more effective at connecting people to jobs and opportunity.”

###

About RMI

RMI is an independent nonprofit founded in 1982 that transforms global energy systems through market-driven solutions to align with a 1.5°C future and secure a clean, prosperous, zero-carbon future for all. We work in the world’s most critical geographies and engage businesses, policymakers, communities, and NGOs to identify and scale energy system interventions that will cut greenhouse gas emissions at least 50 percent by 2030. RMI has offices in Basalt and Boulder, Colorado; New York City; Oakland, California; Washington, D.C.; and Beijing.
More information on RMI can be found at www.rmi.org or follow us on Twitter @RockyMtnInst.

About NRDC

NRDC (Natural Resources Defense Council) is an international nonprofit environmental organization with more than 3 million members and online activists. Since 1970, our lawyers, scientists, and other environmental specialists have worked to protect the world’s natural resources, public health, and the environment. NRDC has offices in New York City, Washington, D.C., Los Angeles, San Francisco, Chicago, Bozeman, MT, and Beijing. Visit us at www.nrdc.org and follow us on Twitter @NRDC.

About Transportation for America

Transportation for America, a program of Smart Growth America, is an advocacy organization made up of local, regional and state leaders who envision a transportation system that safely, affordably and conveniently connects people of all means and ability to jobs, services, and opportunity through multiple modes of travel. Learn more at t4america.org and follow us on Twitter @T4America.

Dear governor, our congestion “solutions” have failed

Governors and legislators in state houses across the country have a major role to play in ending the congestion con and spending our money on projects that will actually improve our lives—rather than just temporarily shortening some commutes by 30 seconds until the congestion returns. Help us make that a reality by sending your local officials a message.

In the United States, conventional wisdom holds that the solution to traffic congestion is more and wider roads. But the conventional wisdom is wrong. Really wrong.

It’s been well documented for years that wider roads create more traffic rather than reduce it. Research showing this dates back to the 1960s and Transportation for America’s new report—The Congestion Con—shows clearly that on average congestion has more than doubled in the 100 most populous urbanized areas since 1993, despite billions spent on freeway expansions.

Unfortunately, the state officials in charge of directing how we spend transportation dollars haven’t gotten this memo and keep advocating for more roads as a solution to congestion.

It’s time to end the con. Send a message to your state legislators and governor to make sure they have this new data.

Send a message

There are dozens of prominent examples around the country that demonstrate just how futile highway widenings are, like the Katy Freeway widening in Houston, TX or the I-405 widening in Los Angeles. Both epitomize induced demand, where new lanes just entice more people to drive. More insidiously, new freeways also spur sprawl by making previously remote land more readily accessible.

Governors are sometimes the worst offenders here. Many have grand—i.e. expensive—highway plans to “solve congestion” and they appoint transportation secretaries that will make their pet projects a reality. In many cases, governors see their department of transportation (DOT) not as a holistic transportation department, but as a highway department. DOTs could just as easily be put to work eliminating our road maintenance backlog or building robust networks of biking, walking, and transit infrastructure that would reduce traffic burdens instead of digging us into a deeper congestion hole.

But governors are absolutely not the only ones to blame here: state legislatures can and do set limits for or give directives to DOTs through legislation and oversight. Legislators are often just as complicit in the congestion con, whether they know it or not.

Take action and make sure elected leaders in your state have the information they need to make informed transportation investments.

Take action

Real solutions for real relief

It’s time to break this vicious cycle. Instead of spending huge sums of public money on ineffective highway widenings, let’s instead focus on real solutions that can deliver real congestion relief.

The Congestion Con report details five policy recommendations. While many are targeted at the federal government—and would be most effective if implemented nationally—states can and should move forward with these policy changes on their own. In fact, state action almost always precedes major federal policy shifts and states should lead by example.

First, we need a new measure. Using vehicle delay as a proxy for congestion is 1) overly simplistic, 2) car-centric and ignores everyone else not in a personal vehicle, and 3) leads to an expensive focus on spot improvements instead of system-wide solutions. With new technologies that are readily available, DOTs could instead start measuring accessibility—what jobs and services can one easily reach and how. An accessibility measure is much more robust, includes all travel modes—walking, biking, transit, driving—and allows us to more accurately evaluate other important information like trip times, trip lengths, overall travel, mode split, emissions, health impacts, and household transportation expenditures. Some states like Virginia and Hawaii are already using access to prioritize projects for funding and more states should follow their lead.

Second, states should focus on road repair instead of road expansion. As we chronicled in Repair Priorities 2019, states choose to spend about as much money on repairing existing highways as they do building new ones—and the maintenance backlog continues to grow as a result. There is nothing preventing state legislators from directing their state DOT to prioritize repair with highway funding until and unless a certain (high) threshold of roads are in good condition. The federal government has given state DOTs tremendous flexibility to choose how to spend billions in annual highway funds, but in the absence of directives to spend on repair, many shirk that responsibility. The only thing preventing us from reducing our maintenance backlog is the will to act.

Third, we need safer streets for everyone. When streets are designed to prioritize high-speed cars and trucks, it robs people of the ability to walk or bike to their destination, even if it’s nearby. While Congress has a role to play here with the federal Complete Street Act, state legislatures could just as easily dictate that roads surrounded by development be designed for speeds of 35 mph or less.

Fourth, we need to address demand by pricing roads. We will never be able to build enough supply—we have to find ways to reduce travel demand at peak times. The meat of this recommendation is federal: remove restrictions on tolling federal highways and allow the proceeds to be used for other roads, transit, and walking & biking infrastructure. This national restriction on tolling is related to the current hold up on New York City’s congestion pricing plans. But if other states were to pursue congestion pricing in their metro areas as a way to raise more funding to invest in other transportation options, this would put more pressure on the Federal Highway Administration and Congress to change the law.

Finally, we need to curtail sprawl and focus on infill development. A major part of the congestion con is this negative feedback loop: new highway → new development → more traffic → wider highway → more sprawling development → more traffic ad infinitum. On this issue, states can truly lead the way. In Oregon, Virginia, Maryland, Minnesota, Nebraska, and other states around the country, legislators are considering or have passed state level bills to remove overly restrictive zoning rules that raise the cost of housing in existing communities and make it easier to build new homes that are closer to jobs, schools, and other destinations. This reduces the pressure to build new roads out to the fringe to support new homes in sprawling locations

Governors and legislators in state houses across the country have a major role to play in ending the congestion con and spending our money on projects that will actually improve our lives—rather than just temporarily shortening some commutes by 30 seconds until the congestion returns. Help us make that a reality by sending your local officials a message.

Contact your state officials

California officially dumped the outdated “level of service” metric — your state should too

California made a small but crucial change to how they measure the performance of their streets in 2013, shifting away from a narrow focus on moving as many cars as fast as possible and taking a more holistic view and measuring a street’s performance against a broader list of other important goals. So what is this outdated “level of service” measure and how can other states follow California’s lead?

Wanting to rejuvenate their local economy, a community cooks up plans to redesign the local street running through downtown that was perhaps even short-sightedly widened or converted to one way travel in the 1960’s or 70’s. But as the street is also a state highway, they soon hear from the state department of transportation (DOT) that their proposed changes will slow down traffic and fail to meet “level of service” requirements and won’t make the cut of the state’s short list of projects. Worse yet, the community is told that in order to make a street safer, they actually need to widen it and smooth out any curves, making it a virtual speedway, undercutting their plans to build a place with more enjoyable places to walk and visit — a framework for creating economic prosperity. Heard this story before?

What is level of service, and how do DOTs come to this conclusion?

Though there are no formal or federal requirements to do so, most DOTs, metropolitan planning organizations and traffic engineers rely on a metric known as level of service (LOS). According to Jason Henderson, professor of geography at San Francisco State University, “Every city I’ve ever come across has some use of [LOS].” Because of the ubiquity of LOS, this largely misunderstood measurement has profound influence on the design of our communities.

Level of service is a system by which road engineers measure how well a road is performing based on the number of cars and the delay that vehicles experience on that roadway. Letters designate each level, from A to F. A, B and C represent free-flowing conditions and F is stop-and-go traffic. The score is assessed based on the highest level of congestion on that roadway, even if it only occurs a few minutes a day. Traditionally, roadway conditions are acceptable if they score a C or higher on non-urban streets and a D or higher on urban streets.

The LOS measurement is calculated by first measuring the amount of traffic during the busiest 15 minutes of an evening rush hour. Next, traffic engineers project the amount of traffic on the road in 20 or 30 years to determine if the road has enough capacity to cover the lifespan of the asset. If a road is projected by traffic engineers to lack capacity 20 years in the future — an incredibly fuzzy practice that’s far more art (or magic?) than math — that road still receives a failing LOS grade today, even if the road is adequately suiting capacity needs.

This heavy reliance on LOS has dramatically shaped our cities. As Gary Toth from the Project for Public Spaces brilliantly put it in this piece, transportation professionals, “in search of high LOS rankings, have widened streets, added lanes, removed on-street parking, limited crosswalks, and deployed other inappropriate strategies” all because LOS has been the de facto standard over the last 50 years. This terrific cartoon from Andy Singer that Toth includes shows the rationale in practice:

A guy rototills his garden to eliminate weeds

andy singer cartoon rototil congestion city level of service street road design

Where did this measure come from?

The 1965 federal Transportation Research Board Highway Capacity Manual introduced the LOS metric and it quickly became accepted as the standard measure of roadway performance. One reason that states adopted the LOS so quickly was that it suited our country’s transportation goals in the 1960’s of building out a network of interstates and prioritizing automobiles to travel quickly.

Although LOS quickly became the standard, transportation agencies at any level are not explicitly required to use it: there are no planning or project design requirements that mandate the use of either LOS or travel modeling. FHWA recently issued a memo clarifying that level-of-service was never a federal requirement. Read more about that (and some other important changes) in this recent story:

If we are going to change the way our streets and communities are designed, we will need to change the way we measure their performance. And that’s exactly what California has set out to do. In 2013, California legislature passed a law that began the shift, directing the Office of Planning and Research (OPR) to use an alternative of measuring vehicle-miles traveled (VMT).

In 2013, Governor Jerry Brown signed into law SB 743, eliminating the use of LOS for projects within designated transit priority areas (TPAs). As Streetsblog LA reported in 2013, because most urban areas fall within the state-defined parameters of a TPA, this means that LOS is largely eliminated for urban projects. Additionally, SB 743 authorized Governor Brown to develop a new way of measuring traffic impacts of major projects statewide and based the new way on total vehicle miles traveled (VMT) rather than intersection congestion. This will change how development projects are analyzed and scored in traffic impact studies and thus the type of projects that match up with the state’s goals for development.

In short, instead of measuring the success of a project by only the limited measure of whether or not it will make it less convenient to drive, CalTrans will now measure whether or not a project contributes to other state goals, like reducing greenhouse gas emissions, developing affordable multimodal transportation options for residents, preserving open spaces, and promoting diverse land uses and infill development. It is expected that this change will make it easier to build transit projects, as well as bicycle and pedestrian-friendly infrastructure — instead of encouraging more development that works against California’s own environmental and other goals.

How can other states replicate this move?

Great question.

This change in California is just one of the many smart policy changes that we’ll be covering in detail in Sacramento this November at Capital Ideas II, our one-of-a kind conference on state transportation policy. We’ll have experts on hand from California who will be discussing their legislative and policy shift away from level of service. Expect to hear more about that as we finalize the agenda in the coming weeks and share it here with you.

Learn More & Register

Capital Ideas II


When it comes to traffic congestion, we need to measure more than just vehicles

UPDATE:

The comment period closes Saturday, August 20th but we are sending in all of your comments to USDOT on Friday, August 19th. If you haven’t sent in a letter yet, you can do that right here.

Last week, USDOT issued a draft rule that will govern how states and metro areas will have to measure and address congestion, along with other metrics like freight movement and emissions. However, the rule as it is currently written would measure success in outdated ways. Old measures leads to old “solutions,” like prioritizing fast driving speeds above all other modes of transportation and their associated benefits.

Congestion We All Count

The comment period is finally open: So tell USDOT to take a wider view of success and change the proposed rule.

The rule as it is currently written fails to consider people taking transit, carpooling, walking, and biking. It would also penalize communities where people live close to work, or travel shorter distances at slower speeds.

This rule makes driving fast the ultimate goal of our transportation system, regardless of what type of road you’re on. Should driving fast be the highest priority on our main streets where people might be shopping or dining at an outdoor café? Should that be the priority in residential neighborhoods where children might be biking or walking.

Photo by NACTO. httpswww.flickr.com/photos/nacto/14442453218Of course not.

Success is about a lot more than moving cars fast. Tell USDOT to improve their proposed rule. Sign an individual letter that we will deliver on your behalf to USDOT.

This rule is particularly disappointing in light of Transportation Secretary Anthony Foxx’s unprecedented effort to improve Americans’ access to economic opportunity through better transportation options. Those are worthy goals, and passing the rule as currently written would be a missed opportunity to achieve them.

Deciding what projects we consider “successful” will influence which transportation projects are selected and built for years to come.

Tell USDOT that #WeAllCount and that the new rule should reflect that.

More on the engineering metric that has an outsize impact on the design of our communities

California changed how the state measures the performance of their streets in 2013, shifting away from a narrow focus on moving as many cars as fast as possible — level of service (LOS) — and taking a more holistic view and measuring their performance against a broader list of other state goals that were often in conflict with LOS. But what is LOS? How does it impact how communities can design their streets?

In this second post of a longer series on level of service (LOS) only for T4America members, we walk through this metric in more detail and explain how it often works against a state’s, metro area’s or city’s other stated goals. Read the first post here.

Introduction

You may be familiar with this story: a community has plans to rejuvenate the economy by redesigning the local street (yet also state highway) running through its downtown, only to be told by the state department of transportation (DOT) that their proposed changes will slow down traffic and doesn’t rate high enough on their metrics to make it onto the short list of projects. Worse yet, the community is told that in order to make a street safer, they actually need to widen it and smooth out any curves, making it a virtual speedway, which would undercut the economic development opportunities.[1]

How do DOTs come to this conclusion that the proposed changes or new development would cause the roadway not to perform well? Most DOTs, metropolitan planning organizations and traffic engineers rely on a metric known as level of service (LOS). According to Jason Henderson, professor of geography at San Francisco State University, “Every city I’ve ever come across has some use of [LOS].”[2] Because of the ubiquity of LOS, this largely misunderstood measurement has profound influence on the design of our communities.

What is level of service?

Level of service is a system by which road engineers measure road performance on a graded scale of A through F. LOS measures how well a road is performing based on the number of cars and the delay automobiles experience on that roadway. Letters designate each level, from A to F, with LOS A, B and C representing free flowing conditions, while LOS F is stop-and-go traffic.[3] The score is assessed based on the highest level of congestion on that roadway, even if it only occurs a few minutes a day. Traditionally, roadway conditions are acceptable if they score a C or higher on non-urban streets and a D or higher on urban streets.[4]

Example of level of service graphic[5]

Santa Clara County Expressway Level of Service Map

The LOS measurement is calculated by first measuring the amount of traffic during the busiest 15 minutes of an evening rush hour. Then traffic engineers project the amount of traffic on the road in 20 or 30 years using the result of that measurement to determine if the road has enough capacity to cover the lifespan of that asset.[6]

One surprising aspect of the usage of LOS that many people don’t realize is how LOS is not just about how a road functions today. If a road is projected by traffic engineers to lack capacity 20 years in the future — an incredibly fuzzy practice that’s more art than math — that road still receives a failing LOS grade today, even if the road is adequately suiting capacity needs.[7]

The history of LOS

The 1965 federal Transportation Research Board Highway Capacity Manual introduced the LOS metric and it quickly became accepted as the standard measure of roadway performance.[8] One reason that states adopted the LOS so quickly was that it suited the country’s transportation goals in the 1960’s of building out a network of interstates and prioritizing automobiles to travel.[9]

Although LOS became the standard, transportation agencies at any level are not explicitly required to use it: there are no planning or project design requirements that mandate the use of either LOS or travel modelling. Planning manuals from both the the Association of American State Highway and Transportation Officials (AASHTO) and the Federal Highway Administration “clearly state that these are guidelines to be applied with judgment — not mandate(s)”[10]

It is important to point out that although LOS was initially meant exclusively for highways and cities aren’t required to abide LOS as a course of law, over the years the measure has hardened into convention for all roads. The adoption of this convention means that LOS has routinely been used for the design of city streets.[11] Eric Jaffe of Atlantic Cities in 2011 noted that “By the time cities recognized the need for balanced transportation systems, LOS was entrenched in the street engineering canon.”[12]

What’s next in the series on LOS?

In our forthcoming third post in this series, we will explain in more practical detail how LOS has damaged communities, organizations, and advocates promoting smart-growth. As Gary Toth from the Project for Public Spaces brilliantly put it, transportation professionals, “in search of high LOS rankings have widened streets, added lanes, removed on-street parking, limited crosswalks, and deployed other (anti-smart growth) strategies” all because LOS has been the de facto standard over the last 50 years.[13]

If we are going to change the way our streets and communities are designed, we will need to change the way we measure their performance.

Citations

Debunking the congestion index used to justify the policies that keep us stuck in traffic

Interstate 24 Traffic Originally uploaded by Transportation for America to Flickr.

The cycle is familiar by now. A study tells us what we all know: our roads are congested. We pour billions into new roads and lanes to “reduce congestion.” Then the study comes out two years later and just as before, our roads are still congested. There’s a call for new roads, new roads open up, we drive further and further, congestion goes up. Rinse and repeat.

Every two years, nearly every major media outlet in the country reports on a “congestion index” study that ranks metro areas and cities by their relative amount of traffic congestion. But a significant new report from CEOs for Cities suggests that there’s a fundamental flaw in that study from the Texas Transportation Institute, and by failing to accurately measure congestion or pinpoint what is producing it in our cities, we’re failing to truly understand the problem.

And when you don’t understand the problem, how can you ever really fix it?

Noah Kazis at Streetsblog most succinctly describes how the TTI study fails to see the whole picture:

Imagine two drivers leaving downtown to head home. Each of them sits in traffic for the first ten miles of the commute but at that point, their paths diverge. The first one has reached home. The second has another twenty miles to drive, though luckily for her, the roads are clear and congestion doesn’t slow her down. Who’s got a better commute?

Shockingly, the standard method for measuring traffic congestion implies that the second driver has it better. The Texas Transportation Institute’s Urban Mobility Report (UMR) only studies how congestion slows down drivers from hypothetical maximum speeds, completely ignoring how long it takes to actually get where you’re going. The result is an incessant call for more highway lanes from newspapers across the country.

The reason why we find ourselves in this situation is because our current federal transportation policies virtually guarantee it. There’s no financial incentive for anyone to measure congestion accurately or improve it — states just get a big load of federal transportation money with few strings attached. Congestion doesn’t get better in large part because states and metro areas aren’t required to reduce congestion or try to shorten or reduce trips with their federal money.

If a state wants to spend some of their federal money on a new comprehensive metro transit system to provide drivers some relief by giving them an additional option as well as taking cars off the road, the process takes years longer and is far more complex. What state, given the choice, would choose to invest in projects that take 4 times longer to get approved and require more local money to build? (Transit projects have about 50% of the cost paid by the federal government, highways get around 80%.)

As this new study demonstrates, the lack of proper metrics to measure success (or mostly failure) is emblematic of the need for reform.

If the ultimate point is to make smart transportation policy, we need to look at a lot of different factors that affect people’s lives. Fixating solely on interstate throughput, while failing to offer other travel and living options, has led our state departments of transportation to invest billions to create a result that is choking the lives out of our regions and isn’t making life better for the vast majority of commuters.

The good news is that places that are attempting to reduce trips and congestion by investing in diverse transportation options are actually showing progress. Regions that have been aggressively investing in additional travel options, eliminating trips, reducing trip length, creating more places to live close to jobs or more effectively managing demand have seen their congestion numbers get better, according to the CEOs for Cities report.

All of this is just one more giant sign pointing to the need for a truly reformed transportation program that can more accurately measure the problems we face, prescribe solutions that will work, and get out of the way as we unleash those solutions on the traffic that is killing our productivity and choking our regions while we motor along at 10 mph with no other option.

Increased traffic is hazardous to our health

Much of the discussion around health and transportation has zeroed in on how a lack of travel options and an unwalkable built environment in our communities reduces physical activity. But when traffic is the leading cause of death among children worldwide and the leading cause of death among Americans between the ages of 1 and 34, something far more urgent is at stake. Shouldn’t we be outraged that tens of thousands die in preventable traffic accidents each year?

The Centers for Disease Control deserves credit for prioritizing increased seat-belt use and reductions in impaired driving as paramount to traffic safety. Where CDC and other agencies fall short, as Greater Greater Washington points out, is the role of traffic itself in health outcomes, rather than simply traffic safety. Ken Archer writes:

The flaw in this exclusive focus on traffic safety is that increased safety only matters when vehicle miles traveled (VMT) are kept static or reduced. Instead, safety improvements that reduce fatalities per VMT have been offset by rising VMT.

Ken is exactly right. Under the status quo, vehicle-miles-traveled will continue to rise, offsetting much of the progress we make on safety-related measures. Until we build roads to safely accomodate all users, whether in cars, on foot, bike or transit, Americans will continue to be at risk. Streetsblog asked why traffic reduction isn’t a top public health concern. That’s a question we hope more will start asking.

IBM imagines a smarter planet with smarter transportation

“The systemic nature of urban transportation is also the key to its solution. We need to stop focusing only on pieces of the problem: adding a new bridge, widening a road, putting up signs, establishing commuter lanes, encouraging carpooling or deploying traffic copters.
Instead, we need to look at relationships across the entire system—and all the other systems that are touched by it: our supply chains, our environment, our companies…the way people and cities live and work. Traffic isn’t just a line of cars: it’s a web of connections.
‘Smart traffic’ isn’t yet the norm—but it’s not some far-off vision of tomorrow. In many places, IBM is helping to make it happen today.”
From IBM’s Smarter Traffic page.

Perhaps you’ve seen the IBM commercials touting the fact that for the first time in history, the majority of humanity lives in cities — and solving the challenges facing our growing cities will be more urgent than ever before. One of the 21 programs of IBM’s “Smarter Planet” initiative focuses on traffic, congestion and what’s known as Intelligent Transportation Systems. (Others include cities, buildings and infrastructure.)

Last week, a forum sponsored by IBM as part of their Smarter Planet series that focused on improving transportation systems through technology yielded important lessons from some of our European counterparts.

Two speakers – Dr. Leo Kroon of Netherlands Railway and Gunnar Soderholm of Stockholm, Sweden – were among the highlights of “A Smarter Transportation System for the 21st Century,” held on Capitol Hill last Thursday.

Kroon described the importance of rail in his “tiny country,” whose 16 million people make it extremely dense. According to Kroon, rail market share between some Dutch cities reaches 50 percent, an amount that would be unheard of in the United States. And rather than force anyone onto the train, Kroon says the Netherlands Railways “seduces” them instead, through continued technological improvement that makes travel convenient and a commitment to reliability and affordability.

For instance, Netherlands Railway has introduced a SmartCard system and is improving its monitoring systems to pinpoint its flow of passengers and accommodate them as efficiently as possible.

The report out of Stockholm was even more compelling.

Gunnar Soderholm, head of the city’s Environmental and Health division, explained how a congestion charging scheme went from “biggest political suicide ever in Sweden” to embraced by even the most right-wing parties. The policy itself was made easier to implement than other cities because Stockholm proper is composed of several islands, with easy boundaries around the central business district.

After implementing the policy – in which drivers are charged for bringing autos into the business district during peak hours – the conventional wisdom was that people would need to see numbers showing its impact. According to Soderholm, no numbers were needed. Everyone could see the difference. “It was free flow all the time,” he said. Stockholm saw a 20 percent reduction in traffic, a 30-50 percent reduction in travel time and a 10-14 percent reduction in carbon emissions. Many more Stockholm residents are combining auto use with more walking and bicycling. Revenues from the charge are directed toward transportation infrastructure.

Stockholm is aiming to be fossil fuel free by 2050.

Innovations are also underway here at home. Judge Quentin Kopp, a decades-long transit advocate and former chairman of the California High Speed Rail Authority, explained how his home state has pledged to match dollar-for-dollar every piece of stimulus funding for high-speed rail. Kopp has been on the frontlines of the cause from the beginning, battling with former Republican Gov. Pete Wilson over a commission and, just two years ago, helping to shepherd narrow passage of a statewide ballot measure to fund high speed rail in the State.

Congressman Earl Blumenauer, a Portland Democrat, concluded with a window into how innovation and technology can guide efforts on the Hill. The big question: how does Congress pay for the next transportation bill? Blumenauer is an advocate of a vehicle-miles-traveled-tax and has pushed legislation to allow pilot projects across the country.

There remains great potential to both learn from our friends abroad and build upon successes here at home.

(Graphic below from Smarter Planet’s Transportation page.)

Driving down in 2008, congestion down much more

Interstate 24 Traffic Originally uploaded by Transportation for America

Due to the impact of high gas prices, the economic slowdown, and a growing preference for public transportation and other options for getting around, congestion was down in 2008 over 2007, marking the first two-year decrease in congestion since the Texas Transportation Institute began keeping track in 1982. Today, TTI released their bi-annual Urban Mobility Report today on the state of congestion and traffic in the U.S.

Some key findings:

Travelers spent one hour less stuck in traffic in 2007 than they did the year before and wasted one gallon less gasoline than the year before. The differences are small, but they represent a rare break in near-constant growth in traffic over 25 years.

  • The overall cost (based on wasted fuel and lost productivity) reached $87.2 billion in 2007 — more than $750 for every U.S. traveler.
  • The total amount of wasted fuel topped 2.8 billion gallons — three weeks’ worth of gas for every traveler.
  • The amount of wasted time totaled 4.2 billion hours — nearly one full work week (or vacation week) for every traveler.

One cause of the decrease in congestion is the same cause responsible for the lower numbers of highway fatalities — Americans have been driving less and less. Vehicle miles traveled (VMT) growth rates have been in decline since 2005 and in 2007, total VMT and per capita VMT actually decreased for the first time since World War II. High gas prices and the recent economic downturn have contributed to these declines, but VMT was actually in decline well before the shock of increased gas prices and the recession, and has continued to fall even as gas prices plummeted over the last year.

And while total vehicle miles traveled (VMT) went down just slightly, congestion is down much more significantly.

According to Feburary numbers from INRIX, a reputable traffic statistics service, just a 3.7% drop in vehicle miles traveled in 2008 resulted in a 30% drop in congestion in our 100 most congested metro areas. That means each commuter spent 13 less hours stuck in traffic in 2008 over the previous year. And in slight contrast to the TTI report, the report found that overall, “99 of the top 100 most populated cities in the U.S. experienced decreases in traffic congestion levels in 2008 as compared to the prior year.” Small reductions in how much we drive each year have a much larger impact on congestion.

The best way to reduce congestion and help Americans save money, time and fuel is to get smarter about managing traffic and offer increased options such as public transportation, telecommuting and incentives for carpooling, bicycling and walking. There is ample evidence that shows that reducing peak hour traffic by just a small percentage will dramatically reduce congestion and all of the costs associated with traffic.”
— James Corless, T4 America

There’s no doubt that the sagging economy had a hand in reducing how much we drive. But regardless of the current economy, most Americans seem to be looking for ways to drive less — not more. So what if we invested more in the positive ways to reduce the amount we have to drive by making other options for getting around accessible, convenient, and available to more people?

With public transportation ridership still going up — even as driving is going down — it’s clear that people who have choices for getting around use them. People are looking for other convenient ways to travel that can get them out of traffic and save them time and money.

And as the INRIX numbers show, if we can make it easier to get around and increase the options for doing so, everyone behind the wheel benefits as congestion decreases. (And despite the decrease overall, the current $87 billion in congestion costs isn’t good news, by any stretch of the imagination.)

It’s unquestionable that the recession has had an impact, giving us some momentary slack in congestion. But what will we do with the breather? When the economy begins to pick back up again and people start driving more, will we head straight back into gridlock? With driving down and public transportation up, will we make more investments in the kinds of transportation options people are clamoring for, the kinds of options that can reduce congestion and make travel more painless for everyone?

Or will congestion simply mount as the economy rebounds?

Help Dan. Save Traffic

Dan loves traffic. But Congress could take it all away when they consider this year’s reauthorization of the federal transportation bill. Will they give us the kinds of transportation options that could suck the lifeblood right out of traffic? Or will they simply pump more money into a broken system. Dan is waiting to find out.

From the T4 America Youtube Channel.

The Inauguration: A shining moment for public transportation

Inauguration 2If you were watching television last Tuesday, you saw at least two historic things happen, but there’s a chance that the lesser of them escaped your notice.

What you might have missed was the fact that Washington, D.C. also managed to quadruple the number of people who travel into the city on a typical day — from 400,000 to 1.8 million — without breaking out into total chaos. And that number was quadrupled at on the same day that they closed all Potomac River bridges and banned private vehicles from a large area around the Mall and parade route.

The star performer of the day? What the Washington Post‘s Dr. Gridlock calls “the Washington region’s biggest transportation asset: The Metrorail system.”

By many accounts, it was the largest public gathering in city’s history. And for certain, it was the highest rail ridership day that Metro has ever had in its history. It wasn’t even close. The previous record, actually set just the day before at 866,681 trips, was completely obliterated with a total of 1,120,000 riders on Inauguration Day. There were problems with stations getting closed at times due to crowding, and definitely some packed platforms, but on the whole, Metro stood up to numbers far higher than anyone had ever seen before.

Obama APTA Ad
Even President Obama got there on public transportation

The Post’s Dr. Gridlock wrote a four part post-mortem on “How It Worked,” and his general conclusion? Thousands biked, even more walked, roads and bridges were closed to cars, and embraced the superior carrying capacity of Metro.

Local blog Greater Greater Washington points to last Tuesday’s success as a blueprint for the future of a growing Washington, DC region:

If our region is to grow, we need to help more people reach their jobs. One approach is to add traffic lanes and parking garages at enormous cost, both financial and in lost urban vitality. The other solution is to move people as we did on Tuesday. More people rode the trains. Each vehicle coming into the downtown core carried far more people. Over 2,000 people used WABA’s bike valet. And many more people started their days within walking distance of downtown. Those houseguests raised our population density enormously, enriching our neighborhood businesses besides.

To follow that up, read what Ryan Avent points out about Metro’s ridership these days, especially in light of the city’s population continuing to grow.

And now, of the top 20 ridership days, one was in 2004 (Reagan’s funeral), one in 2007, 16 were last year, and two have already happened this year. And the metropolitan population continues to grow. One might think that WMATA and the District would work to enhance core service, by planning a new core line and by adding streetcar capacity to help with the intracity load.

So what’s the status of expanding and building upon “the region’s greatest transportation asset?” If you’ve seen the transit cuts map, you might already know the answer: Cutting nearly 900 jobs and cutting $73 million in service. That operating assistance sure would have been useful to keeping the economic backbone of the region functioning.

Call your representative today and urge them to support Rep. Nadler’s amendment to increase transit funding in the stimulus. (1/28/09)

Inauguration 3

Photos by Steve Davis