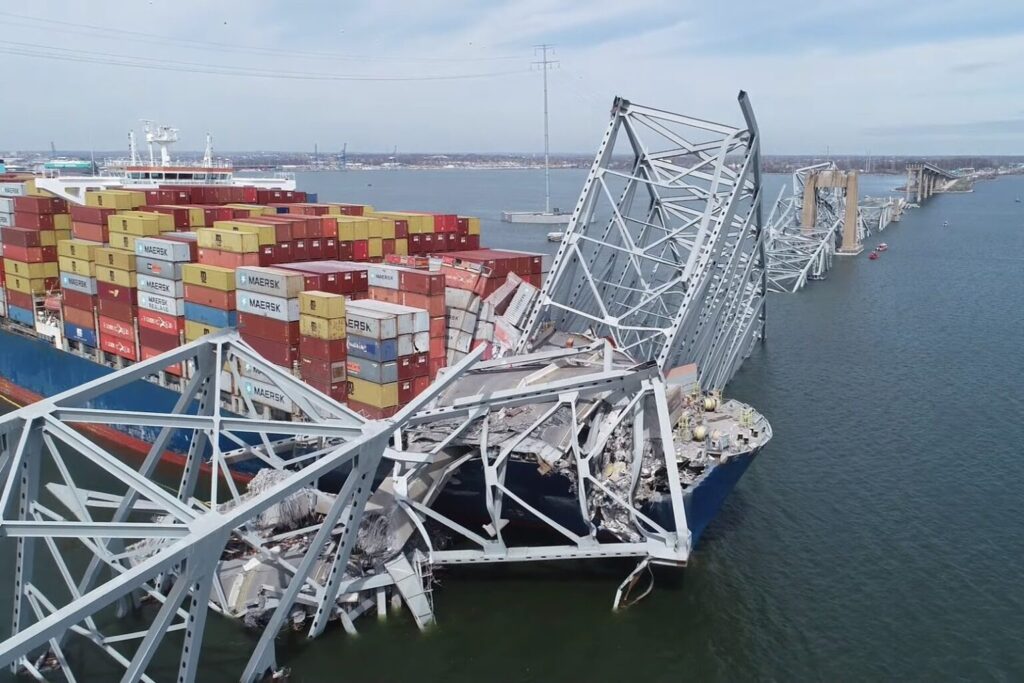
A year after the Key Bridge collapse, the National Transportation Safety Board is urging the owners of 68 bridges across the U.S. to assess their vulnerability to collisions. This moment also presents an opportunity to fundamentally rethink the state of the practice for assessing the health of our nation’s bridges and ensure agencies target taxpayer funds to the bridges that most need repair.
In the days after the Key Bridge collapse, questions were swirling on the state of repair of our bridges and what could be done differently to avoid a bridge collapse. But in the year since, the number of bridges classified as in poor condition has ticked down less than 1 percent according to the U.S. Bureau of Transportation Statistics.
This is not the first bridge collapse in recent history: The Silver Bridge collapse, between West Virginia and Ohio in 1967, brought about the development of the National Bridge Inspection Standards. After the 1980 Skyway Bridge collapse, infrastructure design was altered for future projects to create structural redundancy and fortification. But are our leaders motivated to take similarly bold action today
A year after the Key Bridge collapse, the National Transportation Safety Board (NTSB) is asking states to revisit collision vulnerability assessments of 68 bridges scattered across 19 states. They are also recommending that FHWA, the U.S. Coast Guard and the U.S. Army Corps of Engineers provide guidance to bridge owners on how to reduce the risk of vessel collision. Congress should require this, if the guidance is not forthcoming in the near term.
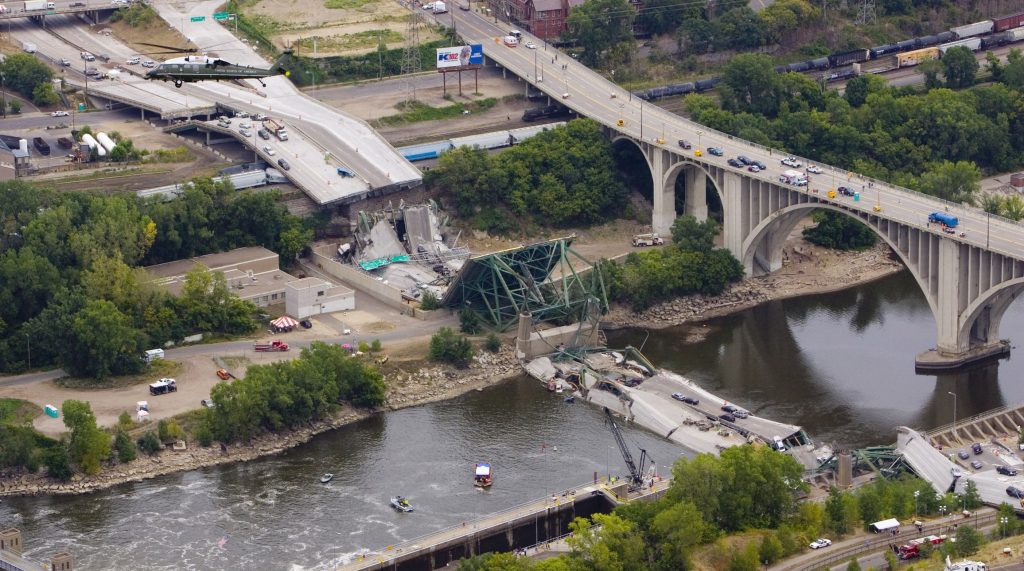
However there is a broader problem: several past bridge collapses were the result of problems undetected by bridge inspections or from DOTs failing to heed the problems identified. In the case of the 2007 I-35W bridge collapse in Minneapolis, the NTSB determined that the bridge failed because of design errors, subpar components, and bridge modifications that adversely affected bridge load capacity. These critical flaws were not caught by bridge inspections, and the NTSB recommended changes to the inspection regime.
In the 2013 I-5 Skagit, WA bridge collapse, the NTSB determined that repeated overhead bridge structure damage was due to low clearance truck strikes and no additional warnings or countermeasures to avoid future strikes. Nine of the 10 inspections before the collapse showed high load bridge strikes, but nothing was done in response to these repeated warnings.
In the 2017 I-85 bridge collapse in Atlanta, the NTSB determined flammable materials that had been improperly stored for five years under the bridge led to an excessive heat fire, impacting the structural integrity of the bridge. The presence of these flammable materials was overlooked by bridge inspectors and not included in their inspection.
Lastly, in the 2022 Pittsburgh Fern Hollow Bridge collapse, the NTSB determined poor quality inspections led to a failure to identify fracture-critical issues and incorrect load rating calculations. They also found insufficient oversight of the City of Pittsburgh’s bridge inspection program by the Pennsylvania Department of Transportation.
These bridge inspection protocols heavily rely on visual inspection, theoretical calculations, limited training and recertification of inspectors, and “engineering judgment” to determine the bridge’s health. In the earlier examples, that approach undercompensated the bridge’s respective poor health and collapse vulnerability. In other cases, bridges are being weight restricted for fear of structural issues when that is not, in fact, the case. For example, 10 bridges with load restrictions in Nebraska were load tested in 2021 across three counties using load testing sensors to emulate loads and assess the bridge’s response. As a result, six of those bridges had their restrictions removed. The standard visual inspection found conditions to be worse than they really were.
We are identifying bridges in need of immediate repair while not recognizing critical needs elsewhere, meaning we are not targeting funding correctly. This is all happening while agencies are spending funds on new roads and bridges that further stretch our resources.
Using technology like load testing sensors (which are widely available and relatively inexpensive) can more accurately assess and identify structural issues invisible to the naked eye. Pairing visual inspections with frequent data collection via sensors can better identify bridge health issues and result in proactive maintenance This fix it first approach would lead to few-to-no bridges in poor condition and no bridge collapses. Furthermore, there is a need to support robust and frequent bridge inspector training, to keep current with the required skillsets and tools to assess bridge health. Looking ahead to the next surface transportation reauthorization, it’s not just about securing more funding—it’s about getting more from every dollar. The next federal transportation bill must set a new standard, prioritizing modern tools for accurate assessments, diligently trained inspector workforce, and a fix-it-first approach to ensure resources go where they’re needed most.
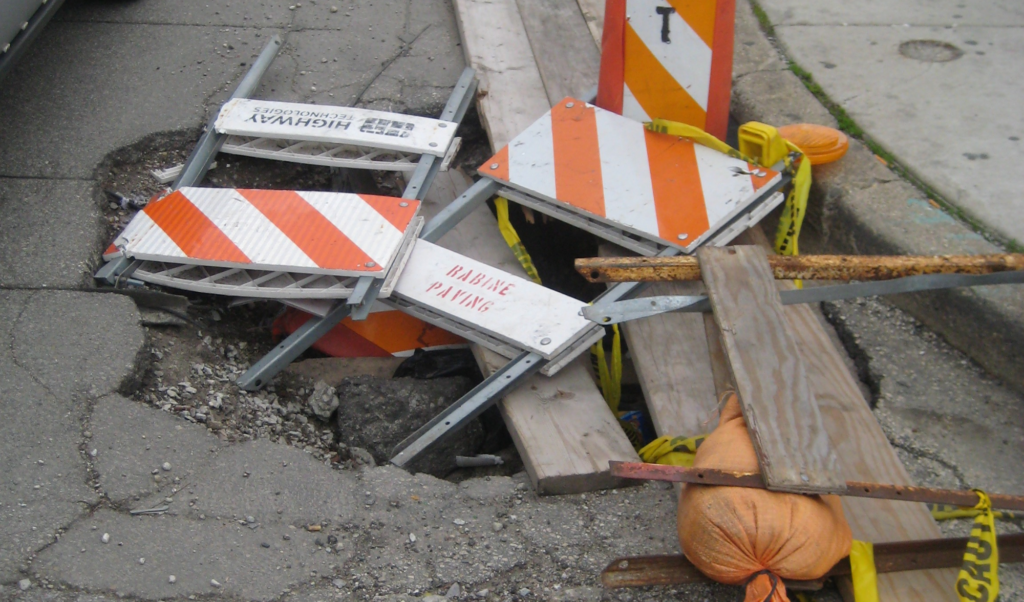
When decision-makers fail to prioritize basic maintenance and repair, everyday Americans pay the price—in increased costs, increased time on the road, and suffering local economies. We can’t keep wasting taxpayer dollars without a clear plan to maintain what we’ve already built.
(Charlie Vinz, Flickr)
We’ve written a lot about how decision-makers justify spending money on expansions instead of repair, even when we have a $830 billion maintenance backlog on existing highways alone. The idea is that when they add a new lane, they are saving travelers time, primarily by allowing drivers to drive faster. If you’ve been following us for a while, you already know that this logic is fundamentally flawed, but let’s set that aside for a moment.
When we expand roadways at the expense of every other way to travel, we create a transportation system that all but requires owning and driving a personal vehicle for essential trips like going to work, school, or the grocery store. When we then fail to maintain those same roads and bridges, we see travel delays in the form of detours and slowed traffic—delays people must suffer through, because they have no other option.
Because the full transportation system is connected, when one intersection is rendered impassable due to poor maintenance, anyone traveling on the roadways around it can experience disruptions, even if those roads are in perfect condition. If time is money (as transportation officials like to believe), this is reason in itself to invest in more transportation options and maintain our existing infrastructure.
This doesn’t even factor in that every dollar we spend on expansion adds to our overall maintenance deficit, as new lanes and bridges have maintenance needs as well. And thanks to induced demand, new lanes often lead to more driving, which leads to even more wear and tear on our roads. These costs, too, will eventually be shouldered by taxpayers.
There are also real, physical costs to poorly maintained roads and bridges. When you don’t maintain the roof of your house, you end up with even more costs as water damages the interior. It’s the same with roads and bridges. Water percolates through cracked and potholed surface pavement leading to worse damage, leading to expensive rebuilds that could have been averted with proper resurfacing and minor repairs. Bridges that aren’t regularly cleaned, sealed and repainted have shorter lifespans leading to more frequent bridge replacements that are very expensive.
Costs accumulate for travelers as well. Driving over potholes risks damage to personal vehicles, which the city and state likely won’t pay. If pavement is in poor condition, risk of crashes can increase. And then there is the physical risk of driving over a poorly maintained bridge, hoping that it won’t collapse. When the Fern Hollow Bridge collapsed in Pittsburgh in 2022 due to lack of maintenance, a bus and six passenger vehicles fell with it, leading to multiple injuries. When a structurally deficient I-35 bridge collapsed in Minneapolis in 2007, 13 people died and 145 more were injured.
You could put it this way: The maintenance costs state and local decision-makers fail to address are all eventually passed on to everyday Americans—to travelers, local business owners, and workers. The costs accumulate in the form of lost time, lost income, damage to personal vehicles, and increased risk of injury. They turn into even more maintenance expenses and higher taxes down the line.
When taxpayer dollars aren’t spent responsibly, we all pay for it, over and over again.
It’s unlikely we’ll see an investment like that again any time soon, which makes our maintenance needs even more concerning. In the next federal infrastructure investment, congressional leaders need to make sure that taxpayer money gets spent wisely. We simply can’t afford to keep this up.
One of our recently launched principles, fix it first, targets maintenance over expansion, advocating for federal highway dollars to be spent repairing old roads and bridges before expanding or building new ones. So, what would it look like in practice to implement this principle into the federal transportation program, to shift our states’ priorities away…
When decision-makers fail to prioritize basic maintenance and repair, everyday Americans pay the price—in increased costs, increased time on the road, and suffering local economies. We can’t keep wasting taxpayer dollars without a clear plan to maintain what we’ve already built.
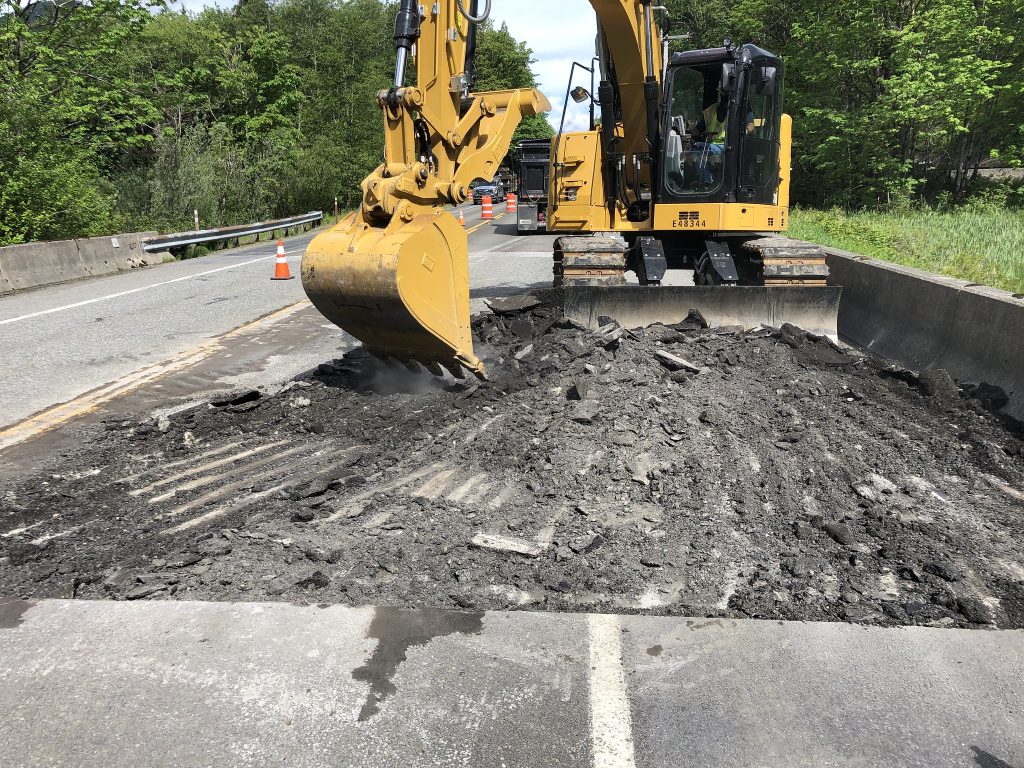
To reshape our transportation system and address staggering maintenance needs, we must prioritize repairing existing infrastructure before expanding our roadways any further.
There is very little new funding in the infrastructure bill specifically dedicated to repair and no new requirements on highway monies for prioritizing repair on roads and bridges. Overall the law doubled down on the practice of giving states immense flexibility with the bulk of their money and then hoping that they use that flexibility to prioritize repair. Advocates should be ready to hold states and metros accountable for making progress.
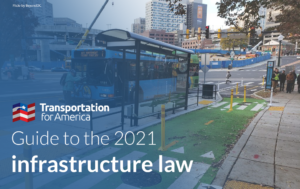
This post is part of T4America’s suite of materials explaining the 2021 $1.2 trillion Infrastructure Investment and Jobs Act (IIJA), which governs all federal transportation policy and funding through 2026. What do you need to know about the new infrastructure law? We know that federal transportation policy can be intimidating and confusing. Our hub for the new law will walk you through it, from the basics all the way to more complex details.
Those are just a few high profile US bridge collapses over the last decade. Many smaller ones have escaped national scrutiny. And of course, who knows how many potential collapses were avoided (good!) through weight restrictions, lane closures, or outright closures that resulted in lengthy detours (bad!).
These collapses all happened for a plethora of overlapping reasons related to engineering, age of infrastructure, design flaws, ineffective inspection systems, and others, but they are also the by-product of our overall reactive vs. proactive approach to repair and our failure to require repair ahead of building new. The House’s five-year INVEST Act would have instituted a fix-it-first requirement, but the Senate and the administration discarded INVEST and ultimately struck a deal to continue the status quo on repair: giving states money and freedom, and hoping they use their discretion to maintain the system.
What’s in the law?
While states are given wide latitude on how to spend their money, they unquestionably will have more money at their disposal for the next five years because nearly all of the core programs that are typically used on repair needs increased in size. There are two major programs worth highlighting:
1) The National Highway Performance Program (NHPP) is one of the two largest sources of funding used for repair—about 53 percent of all states’ base highway formula apportionment (~$147 billion in the new infrastructure law). NHPP funds are intended to be spent on the National Highway System’s roads and bridges, as well as transit or for bicycle and pedestrian infrastructure in an NHS corridor. The easiest way to understand the NHS is that it consists of a spectrum from nearly all multi-lane arterial roads up to interstates, as well as a lot of two-lane rural state highways. Funding for the NHPP went up by 26 percent over the FAST Act, which means more money theoretically available for repair projects if states choose to spend it that way. The infrastructure law did open up NHPP to fund more climate mitigation projects classified as “protective features,” including raising roadways, replacing culverts and drainage, and “natural infrastructure.” Advocates and local leaders—especially in coastal areas—should work hard to make their state or metro area aware that these types of projects are now eligible for NHPP funding. (Relying on the past precedent of emergency aid for repairs after disasters will be risky as climate emergencies become more frequent but funding stays the same.)
2) The Surface Transportation Block Grant Program is exactly what it says: a block grant given to states for all surface transportation needs. This second biggest pot of money states can use on repair is also the most flexible. Not only can these funds be used on repair projects, but they can also go toward transit, biking, walking, and nearly other possible mode of surface travel—though many states do not take advantage of that flexibility. This program represents 23 percent of all highway formula dollars, and was increased by 35 percent from the FAST Act, up to $79 billion in the new infrastructure law.
The $43 billion bridge formula program is “designed” to repair bridges, whether on the National Highway System or what are known as “off-system” bridges owned by counties, cities, or other localities. While states still have to come up with 20 percent of the cost for repairing the bigger NHS and other state-owned bridges, this program can cover 100 percent of the cost of repairing or rehabilitating these locally owned off-system bridges, to try and incentivize more funding toward these vital but smaller bridges—like the Fern Hollow bridge in Pittsburgh that just collapsed—which many states ignore.
The construction of a new highway bridge on a new alignment is an eligible project under the BFP, but FHWA encourages States to first focus their BFP funding on projects that improve the condition of in-service highway bridges classified in poor condition and that preserve or improve the condition of in-service highway bridges classified in fair condition. Note that the FHWA considers the construction of a new highway bridge in a new location, in connection with replacement of an existing highway bridge in poor condition, to be improving the condition of an in-service highway bridge.
While states are free to neglect repair needs on their roads, bridges, and highways, the new infrastructure law does uphold the much stricter existing State of Good Repair programs and requirements for public transit. (Yes, we require state of repair on transit, but not on roads and bridges.) The funding for both transit and rail repair grants was also increased dramatically.
Transit:$3.5 billion for state of good repair grants represents a $1 billion increase over the FAST Act. These formula grants provide funding to repair or replace a wide variety of rail infrastructure (rail itself, signals, stations, navigational systems, etc.) The infrastructure law also created a new $300 million rail vehicle replacement competitive grant program that can be used to replace any rolling rail stock. Larger, legacy rail systems with especially old infrastructure will fare better in the grant process for this new program.
Passenger rail:$53.5 billion for state of good repair grants (up from $6 billion in the FAST Act) within two different programs to improve the state of good repair, improve performance, or expand or establish new intercity passenger rail service, including privately operated intercity passenger rail service if an eligible applicant is involved. Notably, these repair funds (from the Federal-State Partnership for Intercity Passenger Rail, formerly the Federal-State Partnership for State of Good Repair) are closely tied up with the money being used to expand interstate rail service, so regions will need to coordinate their grant applications between connectivity/expansion and their repair needs in order to best utilize these funds. Funds from the Consolidated Rail Infrastructure and Safety Improvement (CRISI) program are more broadly directed toward repair and safety improvement projects.
How could the administration improve these repair provisions?
Unfortunately, the deal the administration struck with Congress limits the extent of their own authority. States control the bulk of the money, with no fix-it-first requirements. Yes, USDOT has urged states to prioritize repair (and climate, equity, etc.) with their huge formula programs. Some governors and AASHTO already responded to that modest request with shock at the suggestion, even though they know they retain the freedom to continue ignoring those needs.
But there are still things the administration can do. They can choose to prioritize repair and modernization (and climate resilience) within their large range of competitive or discretionary grant programs, and prioritize repairing transit/rail infrastructure in communities that need it most or have been historically underserved to serve their equity goals. USDOT could issue guidance or scoping requirements to include identifying climate threats (extreme weather, extreme temperatures) and the frequency the asset will need repair/maintenance based on the design. And they could require this for any project that undergoes a NEPA environmental review.
How can this advance our goals? How can advocates improve outcomes on repair?
When it comes to advocates and local leaders, the greatest potential is with increasing awareness, reporting, and accountability. For example, even though climate-related projects are now eligible for NHPP funds, governors, legislators or the DOT leadership may not realize it or may have zero interest in pursuing those projects. Further, there are very few states that have a pipeline of resilience projects ready to tee up. Advocates should fill that information gap to make the most of the new climate mitigation eligibility within this huge pot of cash, and focus on the projects that would protect and serve the most climate-vulnerable neighborhoods and people.
And lastly, you should be reaching out to every reporter on a transportation beat in your state to remind them of the promises that transportation agencies are making on repair.
When we go in-depth with a reporter who is new (or sometimes even a vet!) on the federal transportation beat, they are often shocked to learn there are no requirements for states to repair things first. Help bring your media along and give them actionable information to hold your decision makers accountable. They have just been given a nearly unprecedented windfall of federal cash for the next five years and have the complete freedom to spend it all on repair projects. If your state makes slow or no progress on repair (or does better in some parts of the state than others) that is due to spending priorities set by the governor, legislature and/or DOT.
Advocates and the media should be holding anyone who fails to move the needle in the right direction publicly accountable.
So what?
As one of our three core priorities, repair was one of our biggest disappointments in the infrastructure law. The last decade has shown us repeatedly that too often states use their flexibility to build new things they can’t afford to maintain while neglecting to properly address their repair needs. This is one of the most fiscally irresponsible things we do with transportation policy. Every dollar spent on a roadway expansion project is both a dollar that was not spent on repair, and a dollar that created decades of future repair costs. When Sen. Manchin talks about being concerned about costs passed to our grandkids, our current approach to repair should be exhibit A.
The administration should use every tool in their arsenal to ensure that the funds they control prioritize repair, while using their regulatory toolbox to nudge states and metros toward the same goal. Advocates can have some of the greatest impact by working to both publicize repair needs (including climate related projects) and hold their decision makers accountable for making progress.
With a massive increase in guaranteed federal funding coming their way, they have no excuses left.
Despite advances in technology, the standard practice for evaluating a bridge’s maintenance needs is a visual inspection, just as it was a half-century ago. To address our nation’s huge backlog in structurally deficient bridges in a more accurate and fiscally responsible way, the federal government should evaluate and speed the adoption of available technologies.
For the past 50 years, trained technicians have inspected highway bridges every two years (or more frequently) to assess the need for repairs or replacement. But in the early 2000s, a review of this practice by the Federal Highway Administration found the process “subjective,” “widely variable,” and incapable of optimizing spending.
Fortunately, there are proven structural monitoring technologies commercially available today that can objectively assess which bridges must be replaced, which replacements can be safely deferred, and which might be able to continue functioning effectively with only minor repairs. This would allow state DOTs or local agencies to better target their repair dollars. But nationally, the norm is still subjective visual inspections.
This is no small issue. There are over 50,000 bridges across the country that are considered structurally deficient today, according to the American Society of Civil Engineers. The rehabilitation & replacement cost for this problem is an estimated $123 billion. But using technologies that are available today could potentially shave billions off that price tag. A number of projects conducted by some transportation agencies have shown that using structural monitoring technology in lieu of relying solely on visual inspections to more precisely assess bridge conditions is highly effective and has saved hundreds of millions of dollars by avoiding unnecessary replacement projects.
We believe that with the right policies and practices in place we can cut the national maintenance backlog in half. Part of the solution will be changing how we allocate resources, and part of the solution could be using the best available technology and data to evaluate the scale of the problem. But the federal government must lead this change for there to be widespread adoption of this technology.
The U.S. Department of Transportation should embark on an effort to evaluate the effectiveness of structural monitoring technologies to more objectively and accurately inspect bridges for safety. And Congress can be part of the solution by providing incentives and funding to spur their adoption.
Change is never easy, especially when it comes to transportation. There are decades of inertia within state departments of transportation which are already tasked with far more than their original mission of yesteryear (building the interstate highway system). But the interstate highway system is complete, the country has changed, and it’s time for U.S. DOT and state agencies to catch up. Facing deficits and uncertainty brought on by the pandemic, there has never been a better time to adopt new technologies that could yield large savings.
Less than a week after the release of The Fix We’re In For — our report on the nation’s bridges showing that one in nine US bridges are structurally deficient — a key Senate committee passed a yearly funding bill that provides new money for repairing these deficient bridges across the country.
The $500 million in the bill dedicated specifically to bridge repair is a step in the right direction toward prioritizing the repair of our more than 66,000 structurally deficient bridges.
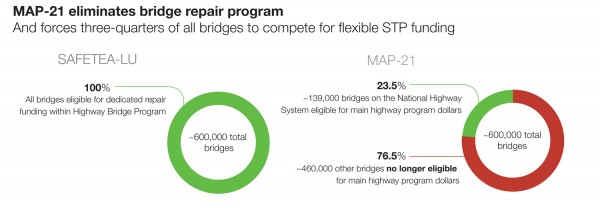
Transportation for America commends Senator Patty Murray, Senator Susan Collins and the rest of the committee for recognizing the importance of investing in all of our bridges — not just a small segment of them. That’s a key difference between this $500 million and the policy created in last summer’s transportation bill (MAP-21.)
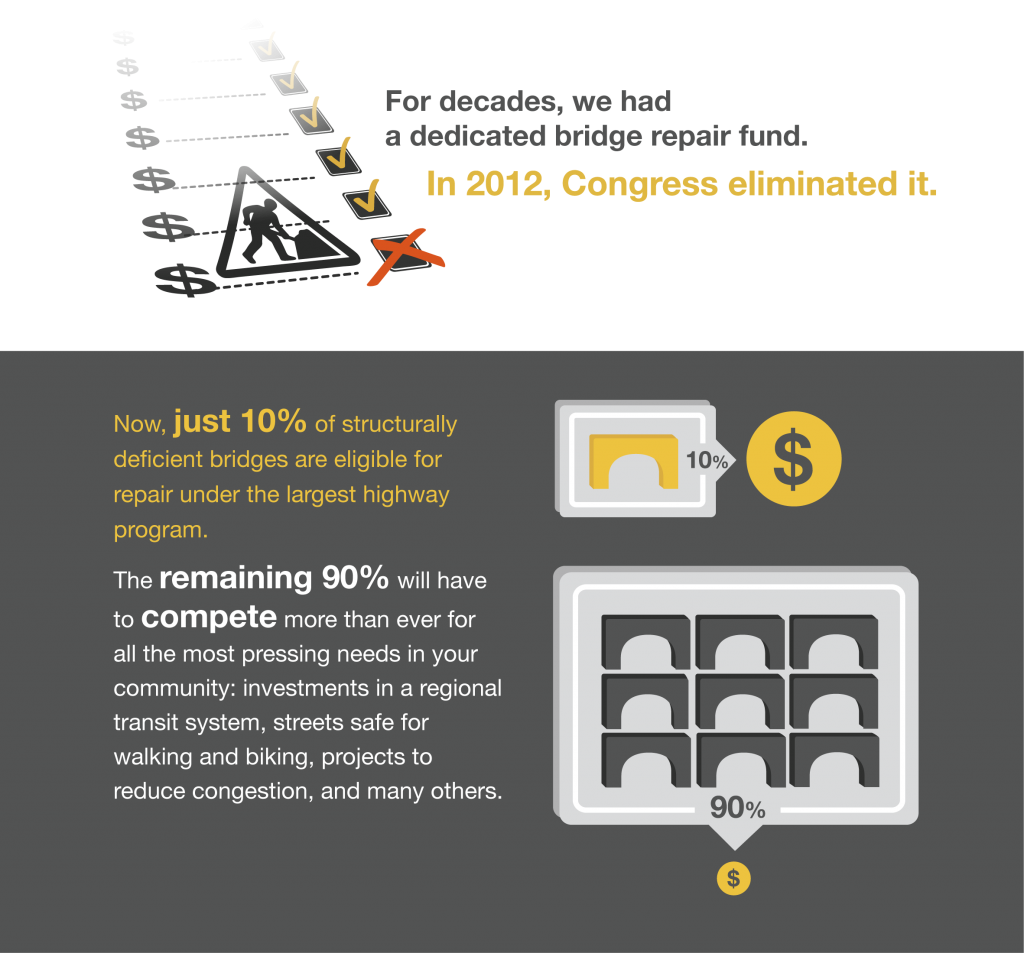
As we pointed out in last week’s report, 90 percent of the country’s structurally deficient bridges were left behind by MAP-21, which made tens of thousands of deficient bridges ineligible for receiving repair dollars from the largest highway program.
For the $500 million for bridge repair in this appropriations bill, almost all highway bridges are eligible to receive dollars for repair, not just a small slice of our country’s bridges. The committee recognizes that the connections these other bridges make in our transportation network are often just as important as our biggest, busiest interstate bridges.
In addition, this money for bridge repair will be provided via a competitive grant program to ensure that it goes to the most vital needs on corridors that are crucial to moving goods and people, in urban and rural areas alike.
Yet new money for bridge repair is far from the only highlight in yesterday’s appropriations bill. There’s also $1.75 billion for rail programs, with $1.45 billion of that intended for Amtrak operations and capital investments – coming a year after Amtrak carried over 31 million passengers and grew their ridership more than 60 percent since 1998, according to the committee release, and another $100 million for passenger rail capital grants to improve service.
The competitive TIGER grant program also got another round of full funding to the tune of $550 million — grants for innovative transportation projects that often cross state lines and combine transit, freight, safety or other diverse uses, and are often hard to fund under older, rigid federal and state programs.
There is also almost $2 billion for investing in new or expanded public transportation across the country through the New Starts transit program.
This bill will head to the full Senate next, but there will be contentious negotiations ahead with the House, which has lower overall funding levels and drastically different ideas for some of these specific programs: No extra money for bridge repair, a significant cut for Amtrak, slightly less money for public transportation and zero dollars for the popular TIGER grant program.
It’s easy to be cynical about our often frivolous media environment these days, but it is heartening to see the seriousness with which outlets of all sizes are treating reports about the need to maintain our aging bridges and other infrastructure. In addition to dozens of newspaper and web reports, more than 500 broadcast outlets have picked up yesterday’s release of the “The Fix We’re in For“, the 2013 edition of our report on bridge conditions nationwide.
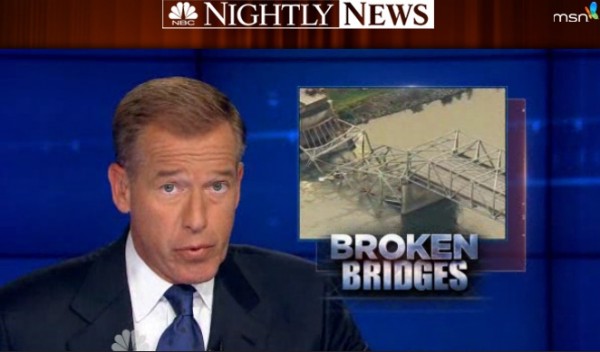
Among the highest-profile, and best, TV stories was certainly this from NBC Nightly News yesterday evening that we embedded in the previous blog post. (Click to watch.)
In the Washington Post, Ashley Halsey looked at the impact that deteriorating bridges can have short of actually falling down:
When big bridges collapse they make news, but it generally escapes notice when decrepit bridges just cause prices to go up on almost anything that gets to the store by truck. …
The group put out a report Wednesday that uses state and federal statistics to put a fresh face on an existing issue, and to raise a question rarely heard above a whisper in Washington because Capitol Hill hasn’t come up with a good answer to it: Where will the $76 billion come from that the Federal Highway Administration says is needed to repair deficient bridges that carry 260 million vehicles each day?
Larry Copeland, writing for USA Today, noted that Congress made changes last year in the federal transportation program, known as MAP-21, that could have a negative impact on the ability of states and localities to return the most threatened bridges to a state of good repair:
In the two-year federal transportation funding bill it passed last year, Congress eliminated a dedicated fund for bridge repair. “The upshot is that bridge repair now must compete with other transportation needs,” the report says. Money previously targeted for bridge repair was rolled into a new National Highway Performance Program, which can be spent only on highways that are part of the National Highway System, which includes interstates and major state highways. Nearly 90% of structurally deficient bridges are not part of the National Highway System.
The Fix We’re In For: The State of Our Nation’s Bridges 2013 is an updated version of the data we released two years ago, and the findings are much the same: Everyday, Americans of all different stripes drive across these deficient bridges, with more than 260 million trips taken on them each day. To put that crazy number in perspective, McDonalds’ restaurants will serve only about 64 million worldwide today. And though we’ve gotten about 0.5 percent better nationally in the last two years, from 11.5 to 11 percent deficient, that’s only a difference of about 2,400 deficient bridges.
As those comments at the very end of the segment point out, we’re better off today than we were a few years ago, so that’s good, right? Well, sure, if you’re content with a rate of improvement that’s slowed to a trickle.
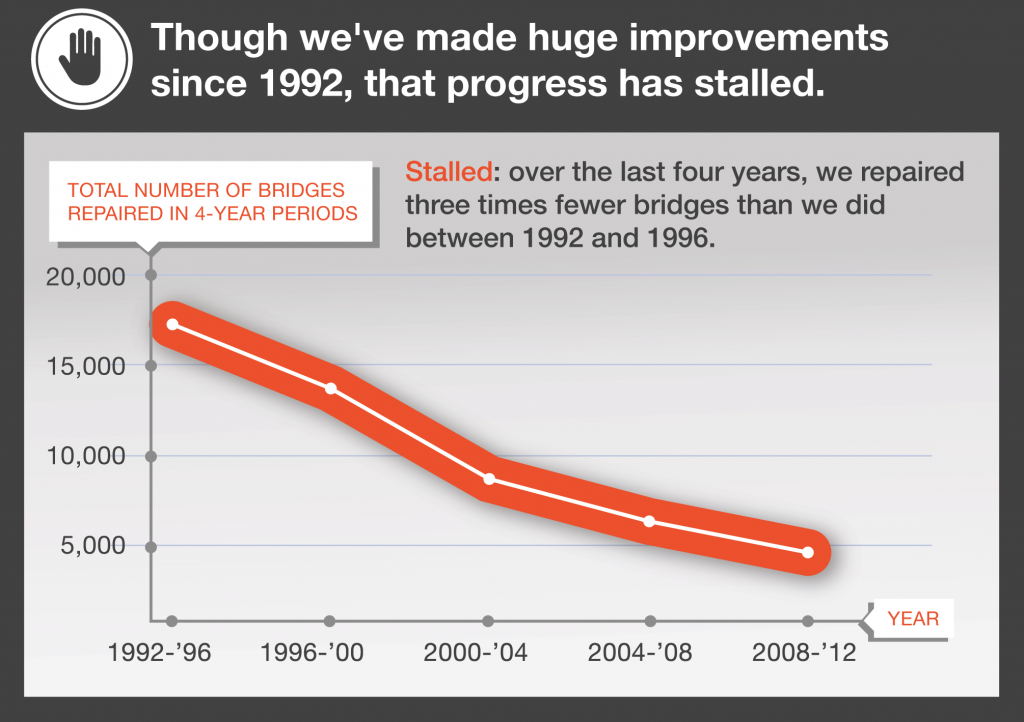
We once made huge progress on repairing our deficient bridges, but today, that progress has almost flatlined. Check out this chart from our report showing the reduction in the number of structurally deficient bridges per four-year period starting back in 1992.
Starting in 1993, shortly after Congress gave bridge repair a greater focus in 1991’s transportation bill (ISTEA), we repaired about 17,000 deficient bridges over the following four years. But in the four-year period from 2009-2012, our log of deficient bridges shrank by only about 5,000 in total. That’s a rate of repair that’s almost three times slower than it was 20 years ago.
If you take a closer look at that improvement over 2011 (about 2,400 fewer deficient bridges), you’ll see that the big improvements made in just two states that heavily prioritized repair, Pennsylvania (-500) and Missouri (-640), account for almost half of that total national reduction of 2,400.
Also keep in mind that the last two years included a heavy load of stimulus spending on repair, and still progress has almost flatlined. Should we be content with hovering around 11 percent of our bridges structurally deficient? Should that be good enough? Can’t we do better?
Considering the dire budgetary straits that many states are in combined with Congress eliminating the dedicated bridge repair program last summer and forcing 90 percent of our deficient bridges to compete with all other pressing local needs for funding, could we finally see a year ahead where the backlog either doesn’t shrink much at all, or even grows somewhat? Certainly.
And Let Congress knowit’s time to win the confidence back of the people and be good stewards of our existing infrastructure, before we build new things that we’ll also have to pay to maintain for decades.
One in 9 bridges are “structurally deficient” as the average age nears 50 years. And more troubled bridges in our big cities than McDonald’s restaurants nationwide
WASHINGTON, D.C. – One in nine of the bridges and overpasses American drivers cross each day is rated in poor enough condition that some could become dangerous or be closed without near-term repair, according to an updated analysis of federal data released today by Transportation for America.
Nearly 67,000 of the nation’s 605,000 bridges are rated “structurally deficient” and are in need of substantial repair or replacement, according to bridge inspections analyzed in The Fix We’re In For: The State of the Nation’s Bridges 2013. Nearly 8,000 are both structurally deficient and “fracture critical”, meaning they are designed with no redundancy in their key structural components, so that if one fails the bridge could collapse. The Federal Highway Administration estimates that the backlog of troubled bridges would cost $76 billion to eliminate.
The report ranks states and the District of Columbia in terms of the overall condition of the their bridges, with one having the largest share of deficient bridges, 51 the lowest. Twenty-one states have a higher percentage of deficient bridges than the national average of 11 percent. The five states with the worst bridge conditions have a share over 20 percent: Pennsylvania has the largest share of deteriorating bridges (24.5%), followed by Oklahoma (22.0%), Iowa (21.7%), Rhode Island (21.6%), and South Dakota (20.3%).
At the other end of the spectrum, five states have less than 5 percent of their bridges rated structurally deficient: Nevada and Florida lead the rankings with 2.2%, followed by Texas (2.6%), Arizona (3.2%), and Utah (4.3%).
“With the collapse of the I-5 bridge in Washington state last month, coming just six years after an interstate collapse in Minnesota, Americans are acutely aware of the critical need to invest in our bridges as our system shows its age,” said James Corless, director of Transportation for America. “Today, though, there more deficient bridges in our 100 largest metropolitan areas than there are McDonald’s locations nationwide.” Put another way, laid end to end, all the deficient bridges would span from Washington, DC to Denver, Colorado or from Tijuana, Mexico to Seattle — more than 1500 miles.
The need is growing rapidly, the report notes: While most bridges are designed to last 50 years before major overhaul or replacement, American bridges average 43 years old. Age is a major factor in bridge conditions. Roughly half of the structurally deficient bridges are 65 or older. Today there are nearly 107,000 bridges 65 or older, and in just 10 years, one in four will be over 65.
Congress has repeatedly declared the condition and safety of our bridges to be of national significance. However, the money to fix them is getting harder to come by with declining gas tax revenues and a fiscal squeeze at all levels of government. At the same time, Congress made the prospects for bridges even more uncertain last year by eliminating a dedicated fund for them in its update of the federal transportation program. The new law also reduces access to funds for 90 percent of structurally deficient bridges, most of which are owned by cash-strapped local governments.
“Unfortunately, the changes Congress made last year left the health and safety of our bridges to compete with every other priority,” Corless said. “When it updates the law again next year, Congress should ensure that we have both adequate funding and accountability for fixing all our bridges, regardless of which level of government owns them.”
Some in Congress have recognized the issues and are moving to address them, among them U.S. Rep. Nick J. Rahall (D-WV), the ranking member of the House Transportation and Infrastructure Committee. “Congress simply cannot keep hitting the snooze button when it comes to needed investment in our Nation’s bridges or think that these aging structures can be rehabilitated with rhetoric,” Rahall said. “That is why I am introducing legislation that provides needed federal funding to start to address the startling backlog of structural deficient and functional obsolete bridges.”
The funding uncertainty comes as the rate of bridge repair has slowed dramatically in recent years.
Investments from the stimulus and ongoing transportation programs helped reduce the share of deficient bridges from 11.5 percent to 11 percent since our last report. But the overall repair rate has dropped significantly over the last 20 years. From 1992-1996 the number of deficient bridges declined by 17,000. However, from 2008-2012 the number dropped by only 4,966 – more than three times slower.
The authors suggest several recommendations to ensure that there is both funding for safe and well-maintained bridges and accountability for getting the job done, including:
Increase investment: Current spending levels are precarious and inadequate. In order to bring our rapidly aging infrastructure up to a state of good repair, Congress should raise new, dedicated revenues for surface transportation programs, including bridge repair.
Restore funding for the 180,000-plus bridges that lost eligibility under the new federal transportation program: Under MAP-21, all of the money previously set aside for bridge repair was rolled into the new National Highway Performance Program, and only 10 percent of deficient bridges – and 23 percent of all bridges – are eligible. Congress must restore funding access for all previously eligible bridges.
Prioritize Repair: Congress should require states to set aside a share of their NHPP funds for bridge repair unless the state’s bridges are certified as being in a state of good repair.
Nearly 67,000 of the nation’s 605,000 bridges are rated “structurally deficient” and are in need of substantial repair or replacement, according to bridge inspections analyzed in The Fix We’re In For: The State of the Nation’s Bridges 2013. Nearly 8,000 are both structurally deficient and “fracture critical”, meaning they are designed with no redundancy in their key structural components, so that if one fails the bridge could collapse. The Federal Highway Administration estimates that the backlog of troubled bridges would cost $76 billion to eliminate.
The report ranks states and the District of Columbia in terms of the overall condition of the their bridges, with one having the largest share of deficient bridges, 51 the lowest. Twenty-one states have a higher percentage of deficient bridges than the national average of 11 percent. The five states with the worst bridge conditions have a share over 20 percent: Pennsylvania has the largest share of deteriorating bridges (24.5%), followed by Oklahoma (22.0%), Iowa (21.7%), Rhode Island (21.6%), and South Dakota (20.3%).
At the other end of the spectrum, five states have less than 5 percent of their bridges rated structurally deficient: Nevada and Florida lead the rankings with 2.2%, followed by Texas (2.6%), Arizona (3.2%), and Utah (4.3%).
“With the collapse of the I-5 bridge in Washington state last month, coming just six years after an interstate collapse in Minnesota, Americans are acutely aware of the critical need to invest in our bridges as our system shows its age,” said James Corless, director of Transportation for America. “Today, though, there more deficient bridges in our 100 largest metropolitan areas than there are McDonald’s locations nationwide.” Put another way, laid end to end, all the deficient bridges would span from Washington, DC to Denver, Colorado or from Tijuana, Mexico to Seattle — more than 1500 miles.
The need is growing rapidly, the report notes: While most bridges are designed to last 50 years before major overhaul or replacement, American bridges average 43 years old. Age is a major factor in bridge conditions. Roughly half of the structurally deficient bridges are 65 or older. Today there are nearly 107,000 bridges 65 or older, and in just 10 years, one in four will be over 65.
Congress has repeatedly declared the condition and safety of our bridges to be of national significance. However, the money to fix them is getting harder to come by with declining gas tax revenues and a fiscal squeeze at all levels of government. At the same time, Congress made the prospects for bridges even more uncertain last year by eliminating a dedicated fund for them in its update of the federal transportation program. The new law also reduces access to funds for 90 percent of structurally deficient bridges, most of which are owned by cash-strapped local governments.
With the second collapse of an Interstate bridge in six years, Americans might expect Congress to leap into action to ensure adequate funding for bridge rehab and replacement. But as we have reminded numerous reporters since an I-5 bridge dropped into Washington’s Skagit River, federal lawmakers took a gamble and eliminated the nation’s dedicated bridge fund last summer.
The bridge fund came into being in 1991, and especially in the first decade afterward, the country made enormous progress repairing deficient bridges. But that progress had slowed to a trickle when Congress took up the transportation funding bill, MAP-21, last summer.
With the I-35W collapse fresh in our minds and progress on repairing deficient bridges slowing, many assumed Congress would think about ways to make bridge repair more of a priority.
Not quite.
Instead, they took a gamble, eliminating the dedicated repair fund so that states could “set their own priorities,” as long as they promised to set targets for the repair of bridges on the National Highway System. That sounds great in principle, until you remember that competition for funds is growing rapidly, with no corresponding drop in the political pressure to build pet projects.
Though they won’t say it out loud, many DOT chiefs like a dedicated maintenance fund because it allows them to say “no” to projects they can’t afford, while helping to ensure existing facilities stay safe and functional. The changes in MAP-21 also don’t give similar attention to bridges not on the National Highway System – 90 percent of all bridges in need of repair – more on this below.
T4America has been a strong advocate of measuring performance against clear targets and goals. But for something as critical as bridge maintenance, there needed to be a well-considered transition period to understand how the new performance management system works, and establish clear targets and guaranteed enforcement mechanisms.
Instead, Congress scrapped the existing bridge repair program and directed USDOT to work with states to cooperate on setting measurable targets for things like bridge condition — but without significant penalties for failure. And considering that MAP-21 is only a two-year bill, states won’t be reporting on these measures until after this bill has already expired.
The second big change made last summer will force state and local communities into painful choices about priorities.
Before MAP-21, all 600,000+ highway bridges were eligible to receive funding for repair under that dedicated bridge repair program.
From the biggest interstate bridge down to that crucial bridge that connects your town across the river to another nearby town, all 66,500-plus deficient bridges could get the dollars dedicated for bridge repair.
Under MAP-21, Congress decided to focus the former bridge repair dollars almost exclusively on a narrow set of roadways known as the National Highway System (NHS). Think of the NHS as the interstates, state highways and most major four-lane and larger highways. The bridges on these roads are our most heavily traveled, no doubt, but they represent only about 10 percent of all structurally deficient bridges.
The other 90 percent will now have to compete with all of the other transportation needs in your community for the flexible funding that can be used on almost anything. And all of those needs will compete for less funding too, reduced from about 60 percent of all funding to 40 percent.
Bridge repair is added into the mix of choices along with regional transit investments, safe streets for all users, congestion relief, other transportation options, and other road repair — leaving communities with tough choices to make.
—-
All this comes as our transportation network begins to show its age. At an average age of 43 years, the typical bridge is nearing the end of its 50-year design life, and many thousands are far older than that. Structurally deficient bridges are more than 20 years older on average.
The federal government should be all about making sure that bridges are being systematically upgraded, repaired or replaced. And in the wake of a calamity like the closure of a key commercial corridor, we Americans ought to be all about letting Congress know we’re willing to pay for a safe and secure transportation network, and making lawmakers pay at the ballot box if they won’t deliver it.
Unsurprisingly, the sudden collapse of the 58-year-old Interstate 5 bridge over the Skagit River in Washington state last Thursday night captured the attention of the country and virtually all major national news outlets. Just like in the days after the Minnesapolis I-35W bridge collapse — though mercifully no one died in this incident — reporters scrambled to understand the issue of bridge condition and asked the same question: “how could this happen, and could it happen again somewhere else tomorrow?”
T4 communications director David Goldberg was on site in Washington and did several interviews on television from the bank of the Skagit River to talk about America’s aging bridges and the 66,000-plus that are structurally deficient across the country.
CNN’s Jake Tapper took up the issue head-on with a live interview on The Lead Friday evening (ignore the Arrested Development video thumbnail…):
TAPPER: The American Society of Civil Engineers gave a C-plus to the 600,000 bridges in the U.S.; 11 percent of them are considered structurally deficient. How worried should Americans be when they drive across bridges?
GOLDBERG: Well, the worry is not so much that they will collapse like this with a lot of frequency, but the problem is that the system is aging and it’s aging pretty rapidly. The typical bridge out there was designed to last 50 years and the average age is 44.
And if you look at the bridges that are structurally deficient, the one in 10 bridges that are rated as structurally deficient, something like the typical age of those is 65 years. And that’s going to be — we’re going to have 65-year-old bridges coming every year from now — now on, because we have been building them like mad since the 1950s. And we frankly haven’t been keeping up with them like we should.
TAPPER: And, David, what should the government be doing that in your view they are not doing enough?
GOLDBERG: Well, there’s a couple things that have happened in recent years that Congress in particular needs to pay attention to, because it’s federal money that pays for the big bridges like this across the country.
And they are the ones that stand to hurt us the most if they fall or if we have to close them. And one thing is that we have to recognize the gas tax receipts are going down. We’re getting more fuel- efficient cars and people are driving less, so we have to figure out a way to replace a lot of that money.
And the other thing that has happened in the last year or so is that Congress actually eliminated the fund that was dedicated to bridge repair and sort of said to states, well, you know, you just decide whether they should be fixed or not. But the problem is we have got political pressure to build a lot of the new projects, which competes with that repair money.
So you get situations like this where bridges should have been replaced. They’re not going to be unless we have a dedicated fund.
TAPPER: So, it sounds like you’re saying that the people who make these decisions need to be a little bit more focused on rebuilding and restrengthening things that already exist, as opposed to pursuing new projects?
GOLDBERG: Well, we certainly need to fix things before we build the new stuff that we can’t afford to maintain. So, we have got to get the money together to fix the things and we have got to make it a priority to fix them, because this can’t happen in America.
And NBC Nightly News also led off their Friday evening coverage with the bridge collapse story.
Have you seen another interesting story on the bridge collapse and what it means for transportation policy in your state or nationally? Send it our way via email or in the comments below.
And in case you still haven’t seen it yet, don’t miss our interactive map (and 2011 report) that allows you to search by address and see the status of all bridges around any U.S. address, with inspection data and sufficiency ratings. We’re hoping to update the map and the report in the coming weeks, so stay tuned.
For Immediate Release
Contact: Stephen Davis
202-955-5543 x242
202-569-8218
steve.davis@t4america.org
or David Goldberg
202-412-7930
Transportation for America issued the following statement following last night’s collapse of the Interstate 5 bridge over the Skagit River near Mount Vernon, Washington.
“The shocking collapse of a busy Interstate 5 bridge over the Skagit River in Washington State highlights the issue of our country’s aging bridges and what we’re doing to address them. Thankfully, no one was killed or even seriously injured in this collapse, which could not be said about the last high profile bridge collapse in Minnesota.
Nationwide, more than one in ten bridges is rated structurally deficient, in need of close monitoring, urgent repairs, rehabilitation or replacement. We take more than 260 million trips over deficient bridges each day. In just our 102 largest metro areas alone, there are more deficient bridges than there are McDonald’s restaurants in the entire country, 18,000 versus 14,000.
While this particular bridge was not considered structurally deficient at the time of its collapse, it is one of thousands that are well past their intended lifespan and carrying far more traffic than intended at the time they were built. The typical bridge is 43 years old with a design life of 50 years.
Considering that progress on repairing deficient bridges has slowed in the last ten years, Congress took a major gamble in last summer’s new transportation law (MAP-21) by eliminating dedicated funding for repairing highway bridges. Now bridge repair is forced to compete with other transportation needs for funding.
At the same time, our chief source of repair dollars – the federal gas tax – is declining as Americans drive more fuel-efficient cars and fewer miles. Congress urgently needs to address both our funding priorities and how we will pay for them in the face of an aging system and growing population, before the next preventable bridge collapse strands commuters, cripples a local economy and claims lives.”
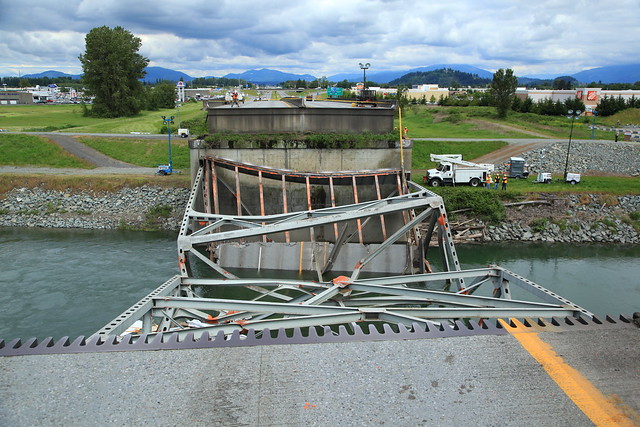
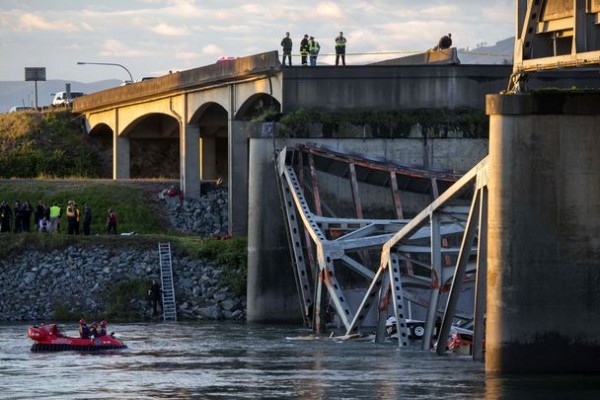
Shortly after the evening commute last night (around 7 p.m. local time) an entire section of the Interstate 5 bridge — both north and southbound lanes — over the Skagit River an hour north of Seattle, Washington collapsed and fell into the river, sending two cars tumbling down into the river, injuring three yet miraculously killing no one. One of those who plunged into the river along with his wife called it a “miracle” that no one was killed or more severely injured.
From the Seattle Times:
Rescuers pulled three people with minor injuries from the water after the collapse, which authorities say began when a semitruck with an oversized load struck a steel beam at around 7 p.m.
That caused a massive piece of the northern side of the bridge to wobble, and then fall into the water, taking with it a gold pickup, its travel trailer and an orange SUV.
Rescuers did not believe there was anybody else in the water but were planning a morning search to be sure.
Seattle Times photo by Dean Rutz. Link to gallery of images here.
Perhaps the most amazing part of this story is that on a bridge that carries more than 70,000 cars daily and at a time of day when traffic could be expected to be moderate at the least, only two vehicles fell into the yawning gap and into the water. Along with everyone else, we at T4 America are relieved that no one died in this tragic bridge collapse.
Just like several years ago in Minnesota, attention quickly turned to the bridge itself. So what do we know about it today?
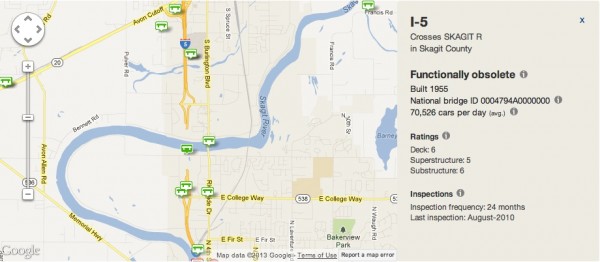
The Interstate 5 bridge over the Skagit River actually predates the creation of Interstate 5. It was built to carry old US 99 over the river in 1955. When Interstate 5 was built in 1957, it largely followed the US 99 corridor and just like many other bridges, this bridge was folded into the interstate system, though it certainly wasn’t built to today’s interstate standards.
Because of that (and likely other design considerations), the bridge was considered “functionally obsolete” by state and federal inspectors, which is a designation that could mean any number of things, none of which have anything to do with structural safety. The lanes could be narrower than today’s standards, the weights allowed could be less than an interstate bridge built today, or built using materials that would be considered obsolete today.
However, the bridge was not considered “structurally deficient” at the time of collapse, which means that a bridge requires repair, rehabilitation or replacement, along with much more regular inspections. To be considered structurally deficient, one of the three major components of a bridge (deck, superstructure, substructure) has to score a 4 or below on a scale of 1-10.
The data in our interactive map is not the most recent release of federal data, but the ratings for this specific bridge have not changed in the federal National Bridge Inventory that was reported in early to mid 2012 by Washington State. WSDOT likely inspected the bridge again sometime in 2012 after they reported annual bridge data to the federal government, and WSDOT is saying publicly today that the bridge was not structurally deficient and was still only considered functionally obsolete.
Here’s the snapshot from our interactive map of U.S. bridges, which you can use to look up the condition of the bridges near any U.S. address.
(Amazingly, you can see that Google Maps has already updated their map to show that Interstate 5 no longer crosses the Skagit River.)
It’s hard to accurately describe how crucial this interstate connection is. I-5 runs from Canada to Mexico within the U.S. and touches almost every single major city on the west coast. It’s a vital corridor not only commuters but also for freight traffic — 12 percent of the daily traffic on this bridge was truck traffic. And this is the main route from Seattle up to Vancouver, certainly a direction that many Seattle region residents might have been planning to travel for the long holiday weekend starting this afternoon.
Those plans are surely on hold, and the ripple effect for freight and other travel up and down the west coast will be felt for some time to come as Washington authorities decide how to handle this painful gap in their transportation network.
We will be back later this morning with a short statement, and follow us along on twitter at @t4america for other news and developments.
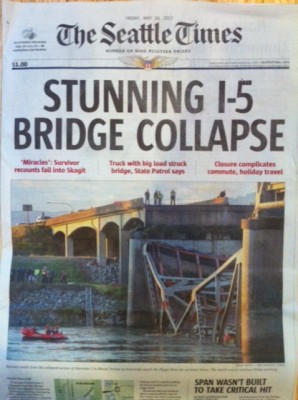
PS, here’s the cover of the Seattle Times this morning.
Update: this post incorrectly said the bridge 63 years old at first publication. That has been corrected.


 Despite advances in technology, the standard practice for evaluating a bridge’s maintenance needs is a visual inspection, just as it was a half-century ago. To address our nation’s huge backlog in structurally deficient bridges in a more accurate and fiscally responsible way, the federal government should evaluate and speed the adoption of available technologies.