


The devastating state impacts of ending federal support for transportation
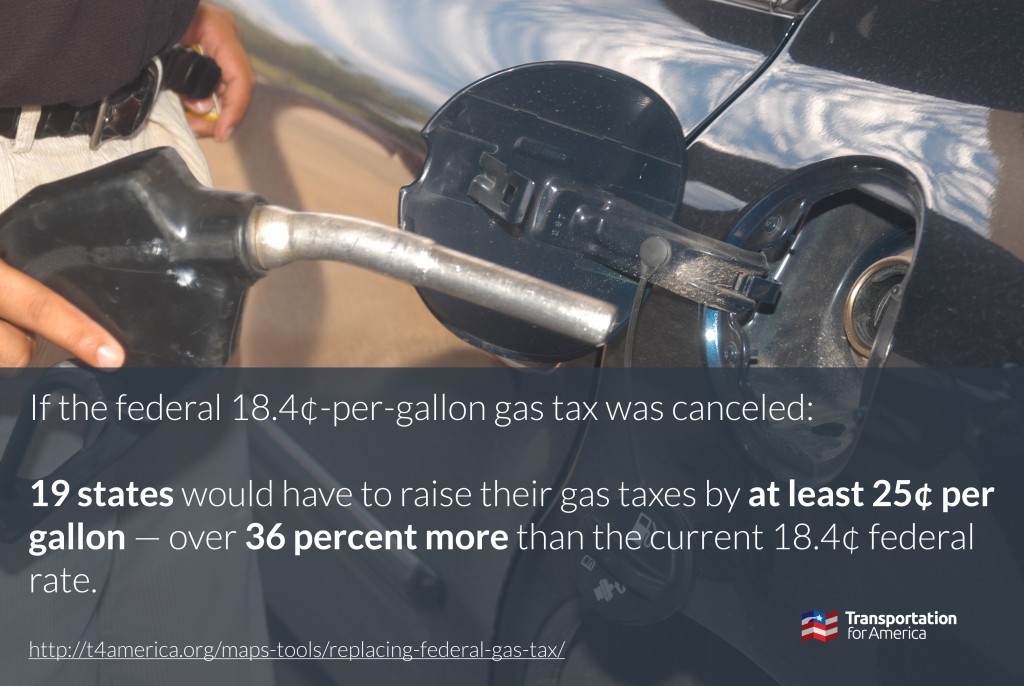
Congress has seen various proposals floated to scale back federal investment in transportation, including a plan to end the 18.4¢-per-gallon federal gasoline tax and shift full responsibility to the states. The data and graphics in this analysis demonstrate what that move would mean for taxpayers, who would have to make up the difference in each state…or accept multi-million dollar decreases in funding and deteriorating conditions on an annual basis.
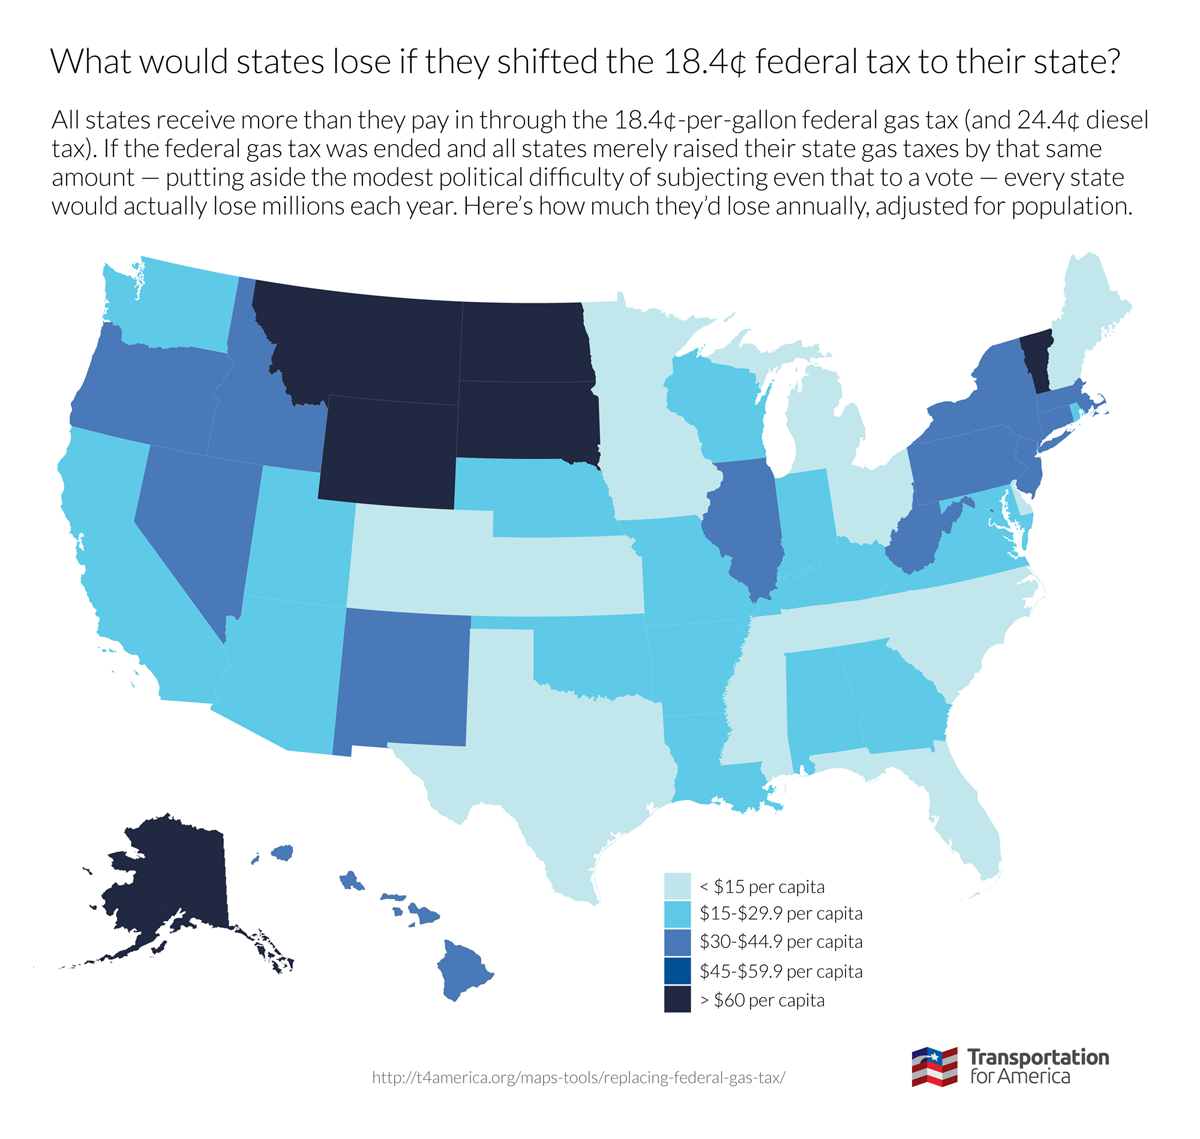
There’s a reason you don’t hear state politicians routinely calling for the end of the federal transportation program and the gas tax. That’s because every single state receives more in federal transportation funds than they pay into the federal system — in part because Congress has been transferring billions from the general fund to make up for slackening gas tax receipts and the fact that the gas tax hasn’t been raised in more than two decades.
At least 16 states have moved to raise their own transportation revenues since 2012, leading some in Congress to claim that those moves show states would be fine with accepting the full burden. But ending federal support would be a nightmare for governors and legislators, who would have to choose between slashing repair and investment or trying to push through massive tax increases to replace federal revenues.
States also would fare poorly under proposals to eliminate federal contributions for public transportation, as two proposals in Congress would do, according to an analysis from the American Public Transportation Association, resulting in “an average 43 percent reduction in a community’s capital improvement funding” for transit.
No matter how you slice it, dramatically reducing federal dollars, whether for roads or transit, would have devastating impacts on state’s population centers – the places where commerce happens and revenues are generated. Going in the other direction however, by increasing investment available to states and local communities, would help keep roads and transit in good repair while we build for the future economy.

(The Transportation Construction Coalition released a similar analysis a few weeks ago, but, unlike the analysis here, it did not include the 20 percent of the transportation program that supports public transportation. -Ed.)
Share this
The data
How much would states have to increase their fuel taxes to compensate if the federal transportation program and gas/diesel taxes were canceled? The table is sortable by clicking on each column.
| State | Increase in state gas tax required (per gallon) | Increase in diesel tax required (per gallon) | What states lose if 18.4¢ federal rate is converted to 18.4¢ state gas tax | Losses per capita |
|---|---|---|---|---|
| Alabama | $0.21 | $0.28 | $92,958,563 | $19.17 |
| Alaska | $1.13 | $1.51 | $68,722,303 | $93.28 |
| Arizona | $0.22 | $0.29 | $115,379,205 | $17.14 |
| Arkansas | $0.23 | $0.30 | $81,571,932 | $27.50 |
| California | $0.26 | $0.34 | $970,555,075 | $25.01 |
| Colorado | $0.21 | $0.28 | $64,684,248 | $12.08 |
| Connecticut | $0.35 | $0.47 | $156,442,727 | $43.50 |
| Delaware | $0.36 | $0.47 | $46,142,721 | $49.32 |
| Dist. of Col. | $2.18 | $2.90 | $22,899,559 | $34.75 |
| Florida | $0.21 | $0.28 | $260,170,628 | $13.08 |
| Georgia | $0.22 | $0.30 | $212,528,576 | $21.05 |
| Hawaii | $0.38 | $0.51 | $49,587,863 | $34.93 |
| Idaho | $0.27 | $0.36 | $64,789,084 | $39.64 |
| Illinois | $0.29 | $0.38 | $437,830,250 | $33.99 |
| Indiana | $0.21 | $0.28 | $112,263,885 | $17.02 |
| Iowa | $0.20 | $0.27 | $41,234,303 | $13.27 |
| Kansas | $0.21 | $0.27 | $40,331,520 | $13.89 |
| Kentucky | $0.22 | $0.30 | $102,269,368 | $23.17 |
| Louisiana | $0.22 | $0.29 | $92,620,985 | $19.92 |
| Maine | $0.19 | $0.26 | $9,725,196 | $7.31 |
| Maryland | $0.23 | $0.31 | $131,528,456 | $22.01 |
| Massachusetts | $0.29 | $0.38 | $218,727,364 | $32.43 |
| Michigan | $0.20 | $0.27 | $91,380,891 | $9.22 |
| Minnesota | $0.21 | $0.28 | $75,635,998 | $13.86 |
| Mississippi | $0.20 | $0.27 | $40,991,102 | $13.69 |
| Missouri | $0.22 | $0.30 | $144,589,995 | $23.85 |
| Montana | $0.47 | $0.62 | $96,948,960 | $94.72 |
| Nebraska | $0.21 | $0.27 | $30,582,110 | $16.25 |
| Nevada | $0.27 | $0.36 | $88,981,354 | $31.34 |
| New Hampshire | $0.21 | $0.28 | $19,154,354 | $14.44 |
| New Jersey | $0.30 | $0.40 | $373,633,032 | $41.80 |
| New Mexico | $0.24 | $0.32 | $69,144,829 | $33.15 |
| New York | $0.41 | $0.54 | $738,211,255 | $37.38 |
| North Carolina | $0.20 | $0.26 | $72,547,484 | $7.30 |
| North Dakota | $0.24 | $0.32 | $45,656,978 | $61.74 |
| Ohio | $0.20 | $0.27 | $130,394,149 | $11.25 |
| Oklahoma | $0.22 | $0.29 | $88,684,116 | $22.87 |
| Oregon | $0.26 | $0.35 | $120,404,625 | $30.33 |
| Pennsylvania | $0.27 | $0.36 | $433,100,081 | $33.87 |
| Rhode Island | $0.49 | $0.65 | $53,101,060 | $50.32 |
| South Carolina | $0.19 | $0.25 | $15,239,265 | $3.15 |
| South Dakota | $0.36 | $0.48 | $68,923,987 | $80.79 |
| Tennessee | $0.19 | $0.26 | $47,619,529 | $7.27 |
| Texas | $0.19 | $0.25 | $96,335,195 | $3.57 |
| Utah | $0.23 | $0.31 | $66,003,884 | $22.43 |
| Vermont | $0.50 | $0.67 | $46,334,846 | $73.95 |
| Virginia | $0.22 | $0.29 | $165,226,933 | $19.84 |
| Washington | $0.24 | $0.32 | $165,100,610 | $23.38 |
| West Virginia | $0.38 | $0.51 | $109,061,556 | $58.94 |
| Wisconsin | $0.21 | $0.29 | $100,624,806 | $17.48 |
| Wyoming | $0.29 | $0.38 | $57,492,793 | $98.42 |
