
Released today: Key policies to reinvigorate our nation’s transportation program

Building from conversations with business, civic and elected leaders in communities throughout the country, Transportation for America has developed a platform of seven broad policies to reboot the nation’s federal transportation program and put it, and the nation, on a sound footing.

The nation’s trust fund for transportation is teetering on the brink of insolvency, potentially bringing scores of projects planned for the next fiscal year to a grinding halt. Lawmakers in Congress need to pass a new federal transportation bill before it expires in September.

Even more needs to be done.  While MAP-21 made important changes to the federal transportation program, the program still needs a reboot in the update due this fall.

Our cities, towns and suburbs across the country — the local centers of commerce that form the backbone of America’s economy—are also facing serious challenges: They know they must have top-notch transportation networks to attract talent, compete on a global scale and preserve their quality of life. They know they need to get workers of all wage levels to their jobs. They also know they need to eliminate crippling bottlenecks in freight delivery. These communities are stretching themselves to raise their own funds and to innovate, but without a strong federal partner the twin demands of maintaining their existing infrastructure and preparing for the future are beyond their means.

These challenges, as difficult as they are, present an opportunity to re-evaluate—and reinvigorate— the federal transportation program in ways that will boost today’s economy and ensure future prosperity.

The local leaders we’ve been speaking with have made it clear that if Congress wants support for raising more revenue for transportation, they need to give these folks at the local level more reasons to believe that it will be to their benefit.

Q: So how do we improve their confidence that more money for transportation will flow down to the level where it’s needed the most?

A: By adopting policies to refocus the federal transportation program on innovative, locally driven transportation solutions. For example, the second group of policies from our platform:

Spur local initiative and innovation through competition and incentives

When communities are given the opportunity to compete for federal funds, they work harder to put forward projects that maximize return on investment, provide creative solutions, and involve a diverse range of stakeholders. The next bill should:

  • Establish a national program of merit-based grants to help state and local applicants accomplish projects that fix existing infrastructure and improve critical links for moving people and freight;
  • Within states, give local communities increased access to federal funds, through mechanisms such as state-administered competitive grants or additional sub-allocation of funds, to help them meet pressing local transportation challenges; and
  • Reward communities that take action to address long-term transportation challenges – such as raising local revenues – with opportunities for additional funding.

Here’s what T4America’s Beth Osborne had to say about using competition and incentives to direct more money down to the local level while also generating better projects in the Atlantic Cities just this week:

At the moment, though, these centers of our economy have access to only a fraction of the money they pay into the nation’s transportation program. What would they do with the money if they had access to more of it? We have had a chance to see over the last five years with the TIGER program, which I helped oversee during my time at U.S. DOT. …Many excellent projects made the cut, and made a big difference. …All solved multiple problems at once, and almost none would have been funded under existing silos. The big lesson: Competition spurs innovation that formula funds never ever will. Competition generates incredible excitement and a desire to outdo your neighbor. As a result, federal dollars are made to go farther, more non-federal funds are brought in from both public and private sources, and every penny is targeted to accomplish multiple goals.

Visit t4america.org/policies to view the rest of the full platform and learn more about the proposals reflecting the needs expressed by local leaders across the country. They are reaching for economic opportunity with forward-looking plans, and going to voters to raise revenue, but they lack the access to enough resources to build the necessary 21st century infrastructure. Our communities need a dependable federal partner.

Incorporating their proposals into MAP-21′s replacement will help their cities, towns and suburbs prosper and flourish as places where businesses can thrive and people of all incomes and ages can live healthy and productive lives.

The backlog of our country’s deficient bridges is indeed shrinking, but barely

We hope you had a chance to check out our new report released yesterday on the state of our nation’s bridges? 1 in 9 US bridges — about 66,500 in total — are rated structurally deficient and in urgent need of repairs, maintenance or even replacement.

The Fix We’re In For: The State of Our Nation’s Bridges 2013 is an updated version of the data we released two years ago, and the findings are much the same: Everyday, Americans of all different stripes drive across these deficient bridges, with more than 260 million trips taken on them each day. To put that crazy number in perspective, McDonalds’ restaurants will serve only about 64 million worldwide today. And though we’ve gotten about 0.5 percent better nationally in the last two years, from 11.5 to 11 percent deficient, that’s only a difference of about 2,400 deficient bridges.

Check out this piece from NBC Nightly News last night.

As those comments at the very end of the segment point out, we’re better off today than we were a few years ago, so that’s good, right? Well, sure, if you’re content with a rate of improvement that’s slowed to a trickle.

We once made huge progress on repairing our deficient bridges, but today, that progress has almost flatlined. Check out this chart from our report showing the reduction in the number of structurally deficient bridges per four-year period starting back in 1992.

5 - Slowing Progress repairing bridges

Starting in 1993, shortly after Congress gave bridge repair a greater focus in 1991’s transportation bill (ISTEA), we repaired about 17,000 deficient bridges over the following four years. But in the four-year period from 2009-2012, our log of deficient bridges shrank by only about 5,000 in total. That’s a rate of repair that’s almost three times slower than it was 20 years ago.

If you take a closer look at that improvement over 2011 (about 2,400 fewer deficient bridges), you’ll see that the big improvements made in just two states that heavily prioritized repair, Pennsylvania (-500) and Missouri (-640), account for almost half of that total national reduction of 2,400.

Also keep in mind that the last two years included a heavy load of stimulus spending on repair, and still progress has almost flatlined. Should we be content with hovering around 11 percent of our bridges structurally deficient? Should that be good enough? Can’t we do better?

Considering the dire budgetary straits that many states are in combined with Congress eliminating the dedicated bridge repair program last summer and forcing 90 percent of our deficient bridges to compete with all other pressing local needs for funding, could we finally see a year ahead where the backlog either doesn’t shrink much at all, or even grows somewhat? Certainly.

It’s time to #FixOurBridges, folks.

Tweet about the report, share our infographic (the chart above is included), share the photos on Facebook, and help spread the word far and wide. And don’t forget about our interactive map that lets you map all the bridges near you and locate the deficient bridges.

And Let Congress know it’s time to win the confidence back of the people and be good stewards of our existing infrastructure, before we build new things that we’ll also have to pay to maintain for decades.


One in 9 bridges still “structurally deficient” as average age nears 50 years

One in nine of the bridges and overpasses American drivers cross each day is rated in poor enough condition that some could become dangerous or be closed without near-term repair, according to an updated analysis of federal data released today by Transportation for America.

McDonalds vs trips on deficient bridges

New data and report: https://t4america.org/resources/bridges

Nearly 67,000 of the nation’s 605,000 bridges are rated “structurally deficient” and are in need of substantial repair or replacement, according to bridge inspections analyzed in The Fix We’re In For: The State of the Nation’s Bridges 2013. Nearly 8,000 are both structurally deficient and “fracture critical”, meaning they are designed with no redundancy in their key structural components, so that if one fails the bridge could collapse. The Federal Highway Administration estimates that the backlog of troubled bridges would cost $76 billion to eliminate.

The report ranks states and the District of Columbia in terms of the overall condition of the their bridges, with one having the largest share of deficient bridges, 51 the lowest. Twenty-one states have a higher percentage of deficient bridges than the national average of 11 percent. The five states with the worst bridge conditions have a share over 20 percent: Pennsylvania has the largest share of deteriorating bridges (24.5%), followed by Oklahoma (22.0%), Iowa (21.7%), Rhode Island (21.6%), and South Dakota (20.3%).

At the other end of the spectrum, five states have less than 5 percent of their bridges rated structurally deficient: Nevada and Florida lead the rankings with 2.2%, followed by Texas (2.6%), Arizona (3.2%), and Utah (4.3%).

“With the collapse of the I-5 bridge in Washington state last month, coming just six years after an interstate collapse in Minnesota, Americans are acutely aware of the critical need to invest in our bridges as our system shows its age,” said James Corless, director of Transportation for America. “Today, though, there more deficient bridges in our 100 largest metropolitan areas than there are McDonald’s locations nationwide.” Put another way, laid end to end, all the deficient bridges would span from Washington, DC to Denver, Colorado or from Tijuana, Mexico to Seattle — more than 1500 miles.

The need is growing rapidly, the report notes: While most bridges are designed to last 50 years before major overhaul or replacement, American bridges average 43 years old. Age is a major factor in bridge conditions. Roughly half of the structurally deficient bridges are 65 or older. Today there are nearly 107,000 bridges 65 or older, and in just 10 years, one in four will be over 65.

Congress has repeatedly declared the condition and safety of our bridges to be of national significance. However, the money to fix them is getting harder to come by with declining gas tax revenues and a fiscal squeeze at all levels of government. At the same time, Congress made the prospects for bridges even more uncertain last year by eliminating a dedicated fund for them in its update of the federal transportation program. The new law also reduces access to funds for 90 percent of structurally deficient bridges, most of which are owned by cash-strapped local governments.

We’ll have much more later today, but don’t miss the new data, new report, new interactive map and infographic over at the home for the bridge report.


What happens when driving rates continue to drop?

Anyone who follows this blog, or transportation discussions in general, is well aware that the miles driven per American has been dropping in recent years and that the millennial generation (16-34) is leading the charge. Indeed, the typical American drives less today than at the end of Bill Clinton’s first term.

But how likely is that trend to hold in the future? And if it does, what does that say about what we should be building, and how we will pay for it, if not with the gas taxes raised from driving? A report out today from the U.S. PIRG Education Fund and Frontier Group seeks to answer the first question, and to fuel a conversation about the second.

None of the likely scenarios sees miles of driving returning to the heights of previous trends.

None of the likely scenarios sees miles of driving returning to the heights of previous trends. 

The short answer to Question 1: No plausible scenario sees per capita driving rates continuing their formerly inexorable climb, and all fall well below current government projections. And no, the authors do not assume that we are entering permanent economic recession, because the underlying are likely to trends persist whatever the strength of the economy:

Millennials. Americans under 35 drive nearly one-fourth less now than those who where the same age a decade ago. There are myriad likely reasons: The cost of car ownership, their tendency to live in more urban locales, reduced employment rates during the recession, etc. But the authors site many reasons why their driving rates may remain lower than previous generations, even during child-bearing years.

Baby boomers. The post-war generation drove workforce participation rates to unheard of levels, and now those workers are nearing the end of their commuting years. And while self-driving cars might allow granny to keep motoring, they will not replace those commute trips.

Technology. We already know the Internet allows work-from-anywhere and online shopping, replacing trips for those purposes. But now mobile tech makes riding transit far more accessible, and enables transit use to be complemented by a burgeoning array of options: Zipcar, Car2Go, bike share, Lyft, Scoot, etc. 

Vehicle operating costs. The era of dirt cheap motoring really does seem to have come to a close. It’s not just gas prices, which have helped fuel much of the recent shift; they’ll stay high for a while. But more and more tolls are coming into our lives, parking is astronomical, insurance is usurious. As long as options are available and cheap, a lot of households will own one car rather than two, and leave the one they have parked, until they decide they don’t need it.

[See how these trends are playing out in Charlotte in the NY Times’ excellent piece on 1A of today’s edition.]

Based on these and other factors, authors Phineas Baxandall and Tony Dutzik ran three scenarios for the future. None assumed a wholesale continuation of the depressed driving rates among millennials; all forecast younger folks to drive more in the child-rearing years. Still, none of the scenarios approached a return to the yearly mileage growth of the previous 60 years, and all fall below current government projections.

What does this mean for the future of our transportation programs? A lot less money, for one thing, unless we change our dependence on the gas tax:

Coupled with improvements in fuel efficiency, reduced driving means Americans will use about half as much gasoline and other fuels in 2040 than they use today, making the real value of gas taxes fall as much as 74 percent.

Indeed, we are already seeing the impact of that fall-off. The tightening revenue suggests, first, that we should make sure we are setting aside existing dollars to ensure the good repair of our existing system. Second, we should review projects in the pipeline that assume escalating rates of driving. Third, we should help the metropolitan regions and mid-sized cities – our economic production zones – that are trying to give their citizens more reliable and affordable options. All of this suggests that we need shift to a mix of revenue sources to build a unified transportation fund that can cover all our infrastructure needs. You’ll be seeing a lot more from us on those ideas in the weeks and months to come.

Examining the progress made — and still needed — in communities across the country

Reconnecting America today released a trove of data measuring access, walkability, affordability and livability in an ambitious report dubbed Are We There Yet? Creating Complete Communities for 21st Century America.

Though not (yet) in common parlance, some planners and advocates have used “complete communities” to connote neighborhoods that offer access to jobs, a range of housing types and costs and transportation options that begin and end with a safe walking trip.

This report analyzes 366 metro areas to identify where they have complete communities, as well as “opportunity areas” that have the bones that can be fleshed out as complete communities. Amassing a wealth of indicator statistics, the report then gives every region a letter grade in four areas: Living, Working, Moving and Thriving.

For “living”, the authors looked at indicators such as how many homes were within easy reach of a rail line or bus rapid transit, how many were living in “opportunity areas”, etc. Similarly, “working” statistics examined how many jobs are within reach of transit and walkable neighborhoods, and how densely jobs are concentrated. “Moving” looks at how robust the transit network is and how safe or dangerous the streets are for people on foot, among other indicators. And “thriving” assesses health measures, such as asthma and obesity rates and the prevalence of food deserts and fast food outlets.

Under this grading system, among regions over 3 million, New York and San Francisco each get straight A’s. Riverside, CA, gets all D’s, while Atlanta and Dallas each get a C and three Ds. Valedictorians among those 500,000 to 3 million include Portland and San Jose, while Richmond and Greenville, SC join the remedial class.

While the letter grades offer easy comparisons and potential bragging rights, it is the aggregation of all these indicators in one place that makes the report interesting and valuable to those looking to make – and track – progress in their own communities.

U.S. communities step up, hoping a strong federal commitment to infrastructure will follow


Is the era of massive, transformational infrastructure investment over? Or are we merely in a transitional phase as the gas tax loses its former power and we debate both new revenue sources and even more importantly, new priorities, for the next generation of transportation investment?

One thing is certain: as Congress is finally close to passing a transportation bill more than 953 days after it first expired, many cities and communities have charged ahead with more “fine-grained” approaches to transportation funding and construction. These cities and regions have a sharp understanding that the choices made about infrastructure today affect their economies for years to come and are taking steps to make those needed investments today.

But will they be enough without the strong federal partner we’ve had for the last 50 years leading the way?

That remains to be seen, according to this compelling new report from the Urban Land Institute out yesterday, which lays out the state of infrastructure investment here and around the world. But it also points out innovative ways to take the situation we have — flat-lined federal investment and no likely windfall of cash for large scale infrastructure anytime soon — and do all we can with the dollars we have to build the system that will carry us deep into the 21st century.

One key change ULI suggests we might see is one we’ve been pushing for from day one at T4 America — and also in the current House/Senate conferencemeasuring the performance of the dollars we spend to see if they’re helping us meet our goals, and holding states accountable if they don’t. “Ironically, fiscal constraints finally may compel some better results,” they say, “figuring out what matters most, and what will get the best bang for the buck, becomes even more urgent.”

The report is a good overview of the state of our country’s infrastructure, how we fund it, and the challenges we’re currently facing right now — all of which are things we’ve all heard regularly. There’s been no shortage of reports and calls to action and reminders of the sorry state of our country’s infrastructure over the last few years. Which is why the most exciting parts of this report chronicle all the different ways that states, cities and local communities are stepping out on their own, raising funds from innovative sources, casting their own vision for transportation, and hoping that the federal government will soon again reaffirm its commitment as a strong financial partner.

As we’re fond of pointing out, when there’s transparency and accountability for exactly what transportation dollars are going to buy — this new transit line, that new busway, this new bridge project — transportation ballot measures pass close to 70 percent of the time, even when voters are taxing themselves. Check out this graphic from the report on transportation ballot measures.

Click to enlarge.

There’s also a great section on Measure R and America Fast Forward, Los Angeles’ innovative plan to build 30 years of transit projects in 10 years. Two-thirds of L.A. voters approved a 30-year sales tax as a dedicated funding stream for the program that will also be used to leverage what they hope will be loans and low-cost financing from the federal government. This L.A. story, just like so many others of innovation highlighted in the report, are indeed examples of innovation, but examples that urgently need federal help and partnership to truly succeed. They’re stepping up with innovation and local funding, but they can’t go it alone.

Let’s hope that Congress passes a strong transportation bill soon and affirms a new role for the federal government in both supporting and rewarding the kind of innovation highlighted in this report that’s beginning to bubble up around the country.

Read the full report here.

Young people leading the downward trend in driving, report finds

A fascinating new report from U.S. PIRG, “Transportation and the New Generation: Why Young People Are Driving Less and What It Means for Transportation Policy” examines a phenomenon many thought we’d never see: A drop in miles driven by those traditionally most eager to drive, young people recently eligible to drive. From the report:

From World War II until just a few years ago, the number of miles driven annually on America’s roads steadily increased. Then, at the turn of the century, something changed: Americans began driving less. By 2011, the average American was driving 6 percent fewer miles per year than in 2004.

The trend away from driving has been led by young people. From 2001 and 2009, the average annual number of vehicle-miles traveled by young people (16 to 34-year-olds) decreased from 10,300 miles to 7,900 miles per capita – a drop of 23 percent. … Young people are driving less for a host of reasons – higher gas prices, new licensing laws, improvements in technology that support alternative transportation, and changes in Generation Y’s values and preferences – all factors that are likely to have an impact for years to come.

The report closes with a discussion of some of the implications for transportation policy — and funding — if the trends toward less driving-intensive lifestyles stays with this young cohort and those that follow.

Such a shift in future transportation trends would shake the foundations of transportation policy-making. For example, to meet the demand for alternative transportation, federal, state and local governments would need to prioritize investment in public transportation, bike lanes, sidewalks and other transportation alternatives. To meet the demand for walkable neighborhoods in close proximity to transit, government officials would need to ensure that land-use and transportation policies were aligned to support the development of these communities. To compensate for the declines in gas-tax revenues, decision-makers would need to find alternative sources of funding for road and bridge maintenance or boost the gasoline tax to levels that may further discourage driving.

Ensuring economic prosperity for the future by investing in transportation

We’ve fallen behind the world on investing in transportation and our physical infrastructure, but Building America’s Future lays out a clear path forward to help restore America’s prominence and lay a strong foundation for our economic future.

Falling Apart and Falling Behind lays out the economic challenges posed by our ailing infrastructure, provides a comparative look at the smart investments being made by our international competitors, and suggests a series of recommendations for crafting new innovative transportation policies in the U.S. This report frames the state of our infrastructure in terms of the new economic realities of the 21st-century economy and presents the challenges we currently face.

America’s railroads — once the fastest and most comprehensive in the world — opened up the interior of the country but America truly forged its status as a world economic superpower in the decades following World War II as our booming country awash with wealth embarked upon building new infrastructure, airports and an interstate system that was the envy of the world.

There was a time when we led the world in the very real physical infrastructure that drives economic success in our cities and states but those days are behind us as we’re failing not only to build the next generation of transportation systems, but failing to even properly maintain our past investments to ensure they continue serving us and our economy.

The last great vision for transportation our country rallied behind was a national interstate system laid out in the 1950s, but we’ve been rudderless for the last 20 years since completing that system with no grand vision. While we’ve been treading water and spinning our wheels, other countries have been investing the kind of money we once did in their transportation systems, positioning them to succeed for years to come.

This report from BAF is a concise summary of the problem we face and the perhaps obvious solution staring us in the face: If we want to continue leading the world in economic dominance, we’ve got to lead the world in investing in our transportation networks — and casting a vision for the next 50 years of investment.

Read the report here, and you can see an interview with two of the BAF co-chairs, Mayor Michael Bloomberg and Governor Ed Rendell yesterday on MSNBC’s Morning Joe.

New report highlights mounting challenge of aging bridges

One in 9 rated “structurally deficient” as average age nears 50 years. In state rankings, Pennsylvania, Oklahoma and Iowa have largest backlog of deficient bridges

WASHINGTON, D.C. – One in nine of the bridges and overpasses American drivers cross each day is rated in poor enough condition that they could become dangerous or be closed without near-term repair, according to a report released today by Transportation for America.

Nearly 70,000 bridges nationwide are rated “structurally deficient” and are in need of substantial repair or replacement, according to federal data. The Federal Highway Administration (FHWA) estimates that the backlog of potentially dangerous bridges would cost $70.9 billion to eliminate, while the federal outlay for bridges amounts to slightly more than $5 billion per year.

The report, The Fix We’re In For: The State of the Nation’s Bridges, ranks states in terms of the overall condition of the state’s bridges, with one being the worst, 51 being the best. Twenty-three states across the country have a higher percentage of deficient bridges than the national average of 11.5 percent.

The five states with the worst bridge conditions have over 20 percent structurally deficient bridges: Pennsylvania has the largest share of deteriorating bridges at 26.5 percent, followed by Oklahoma (22.0%), Iowa (21.7%), Rhode Island (21.6%), and South Dakota (20.3%).

At the other end of the spectrum, five states have less than 5 percent of their bridges rated structurally deficient: Nevada leads the rankings at 2.2 percent, followed by Florida (2.4%), Texas (3.0%), Arizona (3.0%), and Utah (4.5%). The table on the bottom of the main report page shows all 50 states and the District of Columbia ranked by their percentage of structurally deficient bridges, with “1” being the worst conditions and “51” the best.

“Since the 2007 collapse of the I-35W bridge in Minneapolis, Americans have been acutely aware of the critical need to maintain our bridges,” said James Corless, director of Transportation for America. That need is growing rapidly, the report authors noted, as the average age of bridges passes 42 years for bridges that mostly were designed to have a 50-year lifespan before reconstruction or replacement.

“As Congress takes up the next six-year transportation bill, it is imperative that we devote a larger share of funding to protecting our bridges” Corless said. “Americans also want to see more accountability for maintaining our infrastructure: 64 percent of voters say that the way government currently spends money on building and maintaining our transportation infrastructure is inefficient and unwise, according to a February poll for the Rockefeller Foundation.”

Hit the jump to see the full state rankings

(more…)

National report and interactive map shows the state of our nation’s bridges

69,223 bridges – representing more than 11 percent of all U.S. highway bridges – are classified as “structurally deficient,” requiring significant maintenance, rehabilitation or replacement, according to a new T4 America report released today, The Fix We’re In: The State of Our Nation’s Bridges.

Those are the facts, and 69,000 bridges sure sounds like a lot, but what does that look like in real terms? Where are these bridges? Does your city or state have a lot of deficient bridges, or does the state do a good job taking care of them? Those questions are going to be much easier to answer with our online tools accompanying the report, launching today at t4america.org/resources/bridges.

We’ve taken the whole federal bridge database and put it online in a map, so you can type your address, and see all the bridges within a ten-mile radius. Structurally deficient bridges will show up as red icons. Click any bridge and you’ll get more information about it, including its rating in a box on the right.

Curious about how your state stacks up? Click on “By State” and click your state to see a quick overview of their performance, including the best and worst five counties, as well as their rank nationally and total percentage of structurally deficient bridges.

The national report and all 51 state reports are being officially released today at noon with a national telebriefing, but you can go ahead and check out the map and data now on our site. (Media members? Contact david.goldberg@t4america.org if you want information on the telebriefing.)

Check out the map today and please spread the word about it. We’ll be posting several times throughout the day with more information about the national report, which is available for download now — as well as reports for all 50 states and D.C.

Share this
on Twitter
           Share Share this
on Facebook

New report assessing the condition of our nation’s bridges coming Wednesday

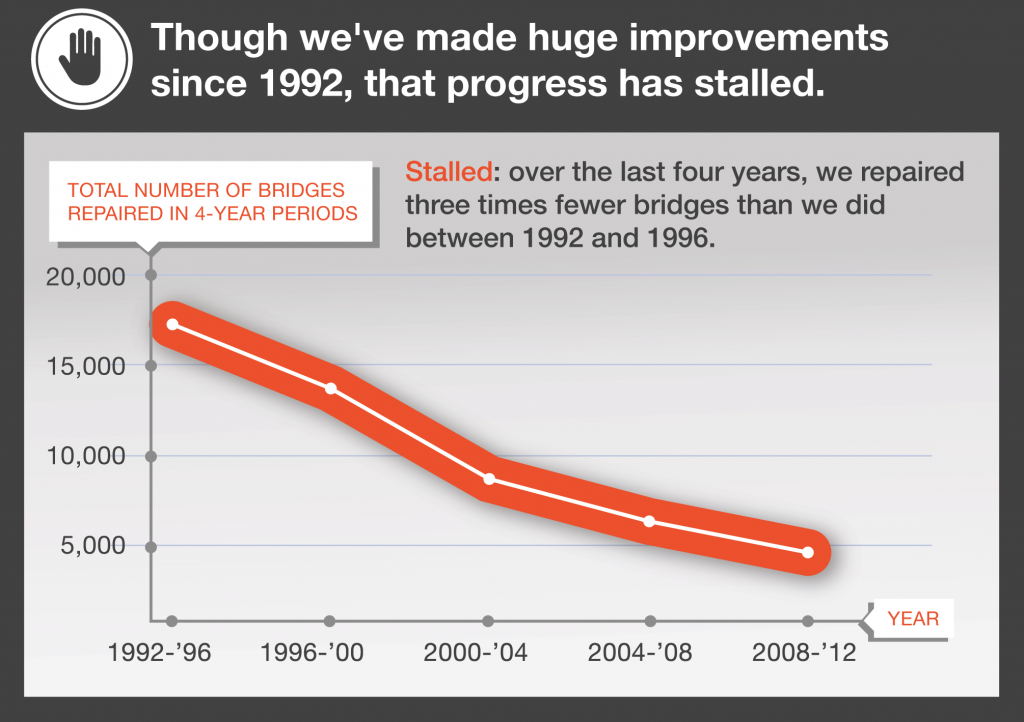
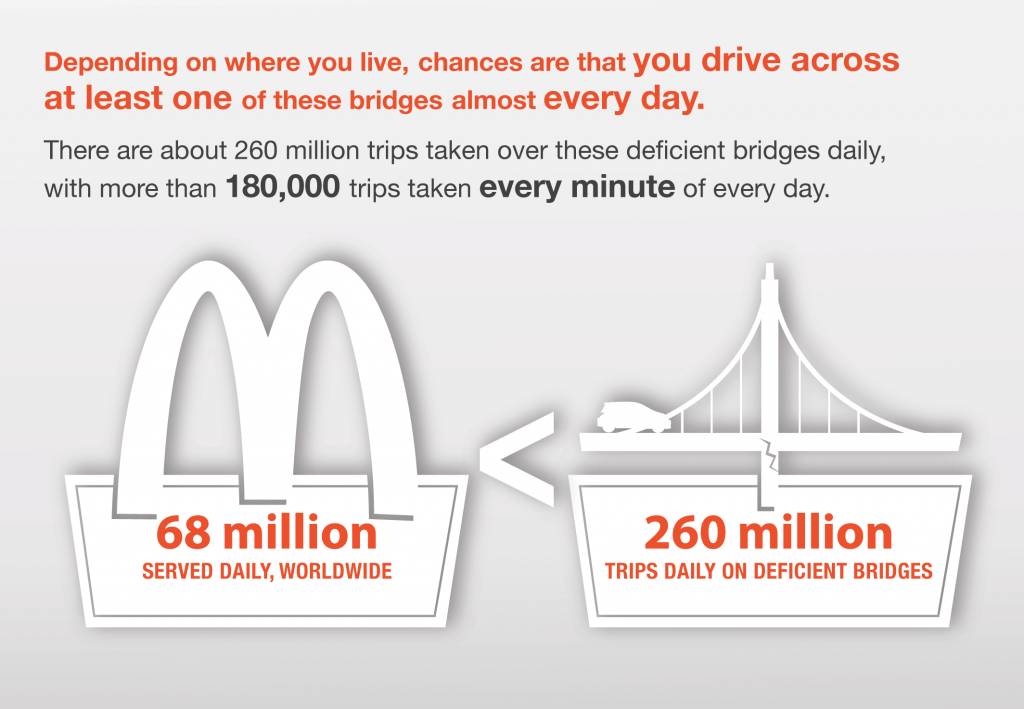
A report being released Wednesday by T4 America chronicles the state of our nation’s bridges, with accompanying data and reports for all 50 states and the District of Columbia. Our country is facing a backlog of deficient bridges that need repairs and maintenance to stay open and safe, with needs far greater than what we’re currently spending.

If you’ve been paying attention to stories about our infrastructure at any time in the last few years, it won’t come as a surprise to you that our transportation infrastructure isn’t in the best shape. Every year, headlines are made when the American Society of Civil Engineers rates our roads or bridges with grades that we’d ground our children for bringing home on their report cards. Most of the year, though, transportation infrastructure isn’t at the forefront of our minds, even though we depend on it every day.

But no event in recent memory jolted us into paying attention quite like the collapse of the I-35W bridge in Minneapolis three years ago this summer. After that event, there was renewed interest in assessing the condition of our bridges from governors demanding audits down to everyday drivers avoiding deficient bridges. But as the months went by, we went right back to taking these vital pieces of infrastructure for granted. So where do we stand today, almost three years later?

Wednesday’s report will answer questions such as:

  • How many bridges are in urgent need of repairs or maintenance?
  • What states are the best and worst when it comes to the condition of their bridges?
  • What counties in each state are the best and worst?
  • How much money are we spending on repairing our bridges, and is it enough?
  • Are we fixing our existing bridges before we spend money on new roads and highways?

We’ve already released the state-level reports in California, Florida, Illinois, Michigan, Minnesota and South Dakota. The rest of the states will be released on Wednesday with the national report, as well as a nifty interactive mapping tool that will allow you to find all the bridges near you and see how they rate. Check right here on Wednesday morning first thing for the report and the interactive mapping tools. Follow us on Twitter to get a stream of statistics about bridges throughout the week.

Reporter or media? Email David Goldberg for information about the national telebriefing and report details.

“Transportation 101” provides a primer on the federal transportation program

• Executive Summary (900k pdf)
• Full Document (2.2 mb pdf)

One of the primary motivations of the Transportation for America campaign is our belief in building a transportation system that meets 21st century challenges.

But understanding how current federal transportation policy works — much less how to go about changing the current system — requires a sometimes painful amount of context. We know it’s not always the easiest issue to follow and a lot of people tend to use complicated jargon and acronyms that confuse even the veterans sometimes. Advocates and legislative staffers who are new to transportation policy often have a lot of catching up to do, and it’s difficult even for folks who have been around awhile to know all the details.

So we put together “Transportation 101: An Introduction to Federal Transportation Policy” to provide some clarity and help document where we’ve been, where the money comes from, how the program works (or doesn’t work) the process of reauthorization and the new (and old) challenges facing us as Congress debates a new transportation bill.

The report was debuted and distributed during a packed briefing on Capitol Hill in the Cannon House Building this morning. We were lucky enough to have some notable panelists speaking at the event, including Roy Kienitz, Under Secretary for Policy at U.S. DOT; former Virginia Secretary of Transportation Pierce Homer; and Mayor Patrick Henry Hays of North Little Rock, Arkansas to kick it off with a short session giving an overview of the federal, state and local roles in transportation policy.

So if you want to learn more about things like the history of the federal transportation program, how the Interstate System was started, how earmarks came to be so prevalent or how the federal role in funding transportation has changed throughout the years, we hope you find Transportation 101 useful.

(And about that jargon and those acronyms…there’s a glossary in the back.)

DSC_0056 Originally uploaded by Transportation for America to Flickr.

Debunking some myths about the gas tax in a new report

A new report out today contains some fascinating facts about the federal gas tax – a subject sure to be of great contention as this new Congress tries to decide whether to raise it and how best to spend it.

Did you know, for example, that the original tax on gasoline was imposed to help reduce the federal budget deficit during the Hoover administration, and wasn’t dedicated to highways until creation of the interstate highway program in 1956 — and that that exclusive dedication only lasted until 1973? And did you know that the “interstate” highways are used far more for local travel than for long-distance travel? According to the report, two of every three miles driven are on urban segments of the system.

These are just two of the interesting findings in “Do Roads Pay for Themselves? Setting the Record Straight on Transportation Funding,” from the U.S. Public Interest Research Group. Since World War II, the authors calculate, the amount of money spent on roads has exceeded the amount raised through gasoline taxes by $600 billion, “representing a massive transfer of general government funds to highways.” Only about half the cost of road construction and maintenance is covered by gas taxes today, the report says, and this will only get worse as cars become more fuel efficient and gas tax receipts plateau.

The point, made here again as it has been by the U.S. General Accounting Office and many others elsewhere, is that every form of transportation is subsidized. Given that fact, and because no one mode of travel meets every person’s needs in every community, the authors conclude: “America should invest in transportation projects that bring the greatest net benefits to the greatest number of people, regardless of how they are paid for.”

Debunking the congestion index used to justify the policies that keep us stuck in traffic

Interstate 24 Traffic Originally uploaded by Transportation for America to Flickr.

The cycle is familiar by now. A study tells us what we all know: our roads are congested. We pour billions into new roads and lanes to “reduce congestion.” Then the study comes out two years later and just as before, our roads are still congested. There’s a call for new roads, new roads open up, we drive further and further, congestion goes up. Rinse and repeat.

Every two years, nearly every major media outlet in the country reports on a “congestion index” study that ranks metro areas and cities by their relative amount of traffic congestion. But a significant new report from CEOs for Cities suggests that there’s a fundamental flaw in that study from the Texas Transportation Institute, and by failing to accurately measure congestion or pinpoint what is producing it in our cities, we’re failing to truly understand the problem.

And when you don’t understand the problem, how can you ever really fix it?

Noah Kazis at Streetsblog most succinctly describes how the TTI study fails to see the whole picture:

Imagine two drivers leaving downtown to head home. Each of them sits in traffic for the first ten miles of the commute but at that point, their paths diverge. The first one has reached home. The second has another twenty miles to drive, though luckily for her, the roads are clear and congestion doesn’t slow her down. Who’s got a better commute?

Shockingly, the standard method for measuring traffic congestion implies that the second driver has it better. The Texas Transportation Institute’s Urban Mobility Report (UMR) only studies how congestion slows down drivers from hypothetical maximum speeds, completely ignoring how long it takes to actually get where you’re going. The result is an incessant call for more highway lanes from newspapers across the country.

The reason why we find ourselves in this situation is because our current federal transportation policies virtually guarantee it. There’s no financial incentive for anyone to measure congestion accurately or improve it — states just get a big load of federal transportation money with few strings attached. Congestion doesn’t get better in large part because states and metro areas aren’t required to reduce congestion or try to shorten or reduce trips with their federal money.

If a state wants to spend some of their federal money on a new comprehensive metro transit system to provide drivers some relief by giving them an additional option as well as taking cars off the road, the process takes years longer and is far more complex. What state, given the choice, would choose to invest in projects that take 4 times longer to get approved and require more local money to build? (Transit projects have about 50% of the cost paid by the federal government, highways get around 80%.)

As this new study demonstrates, the lack of proper metrics to measure success (or mostly failure) is emblematic of the need for reform.

If the ultimate point is to make smart transportation policy, we need to look at a lot of different factors that affect people’s lives. Fixating solely on interstate throughput, while failing to offer other travel and living options, has led our state departments of transportation to invest billions to create a result that is choking the lives out of our regions and isn’t making life better for the vast majority of commuters.

The good news is that places that are attempting to reduce trips and congestion by investing in diverse transportation options are actually showing progress. Regions that have been aggressively investing in additional travel options, eliminating trips, reducing trip length, creating more places to live close to jobs or more effectively managing demand have seen their congestion numbers get better, according to the CEOs for Cities report.

All of this is just one more giant sign pointing to the need for a truly reformed transportation program that can more accurately measure the problems we face, prescribe solutions that will work, and get out of the way as we unleash those solutions on the traffic that is killing our productivity and choking our regions while we motor along at 10 mph with no other option.

Housing and transportation squeeze hitting rural America, new reports concludes

When the Center for Neighborhood Technology released its revised Housing and Transportation Index last week, much of the focus naturally tilts toward cities due to the measurement of metropolitan areas. But CNT’s rural companion report on transportation costs in less-populated areas deserves ample attention as well.

The transportation challenges for rural America have more to do with factors like access and opportunity than congestion and traffic. With volatile energy prices and longer distances between employment, groceries and health services, transportation choices are essential. More than 1.6 million rural households do not have access to a car, making routine trips a strain on a family’s time and budget. For those who do drive, high gas prices take a big chunk out of monthly incomes. Rural residents with cars drive about 17 percent more miles each year than their urban counterparts.

CNT’s analysis finds rural residents feeling squeezed in every corner of America, from Alaska to Alabama. In the areas near Billings, Montana, average annual household gas expenses have reached $5,300 per year, up from just $2000 per year just a decade ago. Costs shot up $3,200 between 2000 and 2008 in Hattiesburg, Mississippi. In the rural pockets surrounding Las Cruces, New Mexico, costs were up $3,100. In the image below, turquoise  indicates Billings-area communities where yearly housing and transportation costs exceed the 45 percent threshold.

The CNT formula defines true affordability as less than 45 percent of household income going toward housing and transportation costs combined.

The website features profiles of communities in both rural and metro areas alike.

CNT’s three recommendations for inclusion in a new transportation bill are: 1) making transportation costs as transparent as possible; 2) using a similar yardstick as the true affordability in future policies and funding priorities for transportation; and 3) increasing incentives for projects that increase transit options and proximity to employment and housing. Support for passenger rail and intercity buses — both heavily-relied upon in sparser parts of the country —can and should fit under these policy umbrellas.

But rural livability is much more than just a discussion topic in Washington D.C.  Stephen Lee Davis of Smart Growth America (and a Transportation for America colleague,) recently wrote about his experience living in Bentonville, Arkansas, a medium-sized town known best as the world headquarters for Wal-Mart Stores. In a two-part series on the Smart Growth America blog, Steve questioned the political figures who see livability as disconnected from America’s rural areas and small towns:

…for me and my wife and many others living in the older part of the city [street grid] in those weeks [in 2005] with astronomical gas prices, a pretty normal life was still possible, even while trying to cut back driving significantly to save money. Several weekends in a row, we parked our cars entirely, and managed to do our grocery shopping, go to church, visit friends, or listen to bluegrass in the square on a Friday night without having to get in either of our two cars. We walked 5 minutes to the grocery store. We biked to Walmart a handful of times — receiving many strange looks in the process. We went to eat at a new restaurant on the square. We went hiking on a short trail in the woods right on the edge of downtown. We went to the library.

Sounds pretty “livable,” right?

…and explained how current transportation policy has failed the residents of towns like Bentonville.

People who live in classic American small towns like Bentonville know a thing or two about livability. There’s nothing “livable” about being stuck in your subdivision that got built too far from town, work or school when gas prices get too high. Nor is it “livable” to have the federal government incentivizing (through money to the State DOT) the widening of highways into the county to encourage more sprawl outside of town even as the city is clamoring for more investment inside of it.

Like their urban counterparts, many residents in rural areas and small towns hope to preserve what they love about their way of life while making it easier to get by — and get around. CNT’s work helps to bring those challenges to light and move policy in a direction that produces results.

New poll shows Americans strongly support public transportation; more walking & biking

American voters overwhelmingly support broader access to public transportation and safe walking and biking, according to this new national poll conducted for Transportation for America and released to the media today this afternoon. With the Senate Environment and Public Works Committee ramping up efforts to draft a new long-term transportation bill before the end of the year, the results should be instructive to Senators.

You can read the full details about the poll, including a full presentation on the findings at https://t4america.org/resources/2010survey

More than four-in-five voters (82 percent) say that “the United States would benefit from an expanded and improved transportation system,” including modes of transportation like rail and buses. An overwhelming majority of voters agree with this statement — no matter where they live. Even in rural America, 79 percent of voters agreed with the statement, despite much lower use of public transportation compared to urban Americans.

Some in Washington believe that building or expanding more roads is the best way to tackle congestion — but the majority of Americans don’t agree with them. Three-in-five voters choose improving public transportation and making it easier to walk and bike over building more roads and expanding existing roads as the best strategies for tackling congestion. (59% to 38%).

Click the graphic to read more about the poll. Find something interesting or surprising? Share it with us in the comments.

Reconsidering how we measure housing affordability by including transportation costs

Americans have spent the last several decades moving farther and farther away from urban centers, in search of affordability. Rapidly growing communities ranging from the sunbelt cul-de-sacs of greater Phoenix to the exurban fringes of Northern Virginia have sold people on a lower cost of living. The decades of “drive-til-you-qualify” resulted in millions moving out for supposedly cheaper housing. Broadly speaking, we have been buying what they are selling. But was it actually more affordable?

New research from the Center for Neighborhood Technology, with funding from the Rockefeller Foundation, turns the conventional wisdom about affordable housing on its head. Rather than considering solely housing prices as a measure of affordability, CNT computed a formula that factors in transportation costs, yielding a very different portrait of affordability. They redefine true affordability as less than 45 percent of income for housing and transportation costs combined. (Typical affordability falls around 30 percent or less of income.) By this expanded measure, 48,000 communities deemed affordable by conventional metrics are actually unaffordable. The percentage of affordable communities drops from almost 70 percent by traditional measurements to just below 40 percent.

This release expands CNT’s previous work on this tool from just the biggest 52 metro areas to 337 metropolitan statistical areas across the U.S. So what does “location efficiency” mean?

While the concept of energy efficiency is a familiar term, locations can be efficient too. Compact neighborhoods with walkable streets, access to transit, and a wide variety of stores and services have high location efficiency. They require less time, money, and greenhouse gas emissions for residents to meet their everyday travel requirements.

The contrast between two communities – the Mt. Washington neighborhood in Pittsburgh, Pennsylvania and the Southern California suburb of Palmdale – provides a telling snapshot of affordability and “location efficiency.”

In Mt. Washington, perched above downtown Pittsburgh across the river, residents enjoy walkable streets, ample open space, a vibrant business district and close proximity to schools. Transit ridership is above average for the region, with 23 percent of workers using transit for the daily commute, and residents spend an average of $474 a month on transportation. The average combined housing and transportation cost, according to CNT’s formula, was 39 percent of income. In low-density Palmdale, the fastest growing city in Los Angeles County in 2009 but miles from the heart of L.A., only 4 percent of workers use public transportation for their daily commute and average transportation costs per month are nearly $900. According to CNT’s formula, average housing and transportation costs require 54 percent of income.

Palmdale, California, left, and Mt. Washington pictured with the blue areas showing places where housing + transportation costs total more than 45%. Screenshots from CNT.

Penny-wise and pound-foolish (or pound-fuelish) is how the report’s describes many Americans’ approach to affordability. So how can we increase people’s options, raise awareness of hidden transportation costs and encourage a broader view perspective on affordable housing?

CNT has three suggestions.

First, transportation costs should be as transparent as possible. A bill sponsored by Congressman Earl Blumenauer would do just that by requiring transportation costs to be disclosed in real estate transactions.

Second, future policies and investments in transportation should measure true affordability with this new yardstick. The Livable Communities Act, sponsored by Senator Chris Dodd of Connecticut, would move us in that direction.

And third, federal transportation law ought to provide more funding and incentives to increase transportation options and greater proximity between housing, transit and jobs. These changes must be included in the next reauthorization of the transportation bill, which Congress just extended to the end of 2010.

With low-income and impoverished residents increasingly concentrating outside of central cities in areas where transportation costs are much higher, we need to invest in the kinds of transportation options that will keep them from getting stranded when gas prices go up.

The good news is that many public officials get it. Transportation Secretary Ray LaHood has expressed his desire to broaden the criteria for transportation projects, and a new partnership between the Environmental Protection Agency, DOT and Housing and Urban Development is included in President Obama’s 2011 budget. As Elana Schor said on Streetsblog this morning, this data is “aimed at encouraging the Obama administration to update its measurement of affordability, a goal embraced by the heads of the three agencies participating in the inter-agency sustainability work.”

Ron Sims, deputy secretary at HUD, said the Center’s report “demands that we address the issue of transportation costs and the built environment so people can make a better decision about where they live and what they can afford.”

We echo that demand.

The potential economic and personal impacts of oil dependence

There isn’t a state in the union that doesn’t depend on oil for transportation. But states have varying levels of dependence, making some far more vulnerable to dramatic economic impacts as the price of oil goes up or down — depending on how many options consumers have for getting around.

Continuing the recent theme of the transportation challenges facing our small towns and rural areas comes this new report from the National Resources Defense Council analyzing the vulnerability of each of the 50 states to changes in oil prices. The research is timely with the national price for gasoline reaching $2.79 a gallon this week, the highest level since October 2008 according to the Energy Department, and likely to rise higher as we head into the summer driving season.

Percent of Income Spent on Gasoline by the Average Driver, 2008. Graphic from NRDC

As the graphic shows, drivers in some states would have to spend a larger share of their income on gasoline and are more vulnerable to oil price shocks. The five states that are most hurt by higher fuel prices are Mississippi, Montana, Louisiana, Oklahoma and South Carolina. Drivers in these states would have to spend as much as 11 percent of their annual income on gasoline, or about $3,345 on average, if the price returned to $4 a gallon.

Compare this list with the five least vulnerable states — New York, Connecticut, Massachusetts, Maryland and New Hampshire — which have historically had a variety of transportation options to choose from, from private cars to public transportation and commuter trains, as well as development patterns that have produced walkable neighborhoods where residents can safely walk or bike for short trips. States that can find ways to provide residents with multiple options for getting around will be better off financially in the long run.

Already, people living in urban areas that have access to a wide array of transportation options spend 4% or less of their income on gasoline, while some rural residents reportedly spend over 13% of their income on fuel. And a study comparing 10 statewide averages, 12 major metro areas, and 29 counties that are at least 25% Native American found that households in rural areas spend almost 30% of their income on fuel, compared to metro area averages as low as 2.6% in some parts of the country. (pdf)

With the Energy Department forecasting gas prices topping $3 a gallon this spring and summer, residents in areas that have few options for getting around besides getting into the family car could find themselves with an unfortunate choice: Spend more of their income on transportation, or be stranded without any other options.

Increasing access and mobility is not an exclusively urban or a rural agenda. It should be a national goal that we work toward using a variety of policies, including fixed route and paratransit bus services, intercity and commuter rail services, intelligent transportation solutions, telecommuting and complete streets safe for walking and biking.

Speeding up, cleaning up freight movement in the U.S.

Container trucks on an American highway Originally uploaded by futureatlas.com

Since Chairman Oberstar introduced the Surface Transportation Authorization Act (STAA) last summer, we’ve increasingly heard that addressing freight congestion is going to be a major component of any national transportation policy.

Projections of the increase in freight movement in the next few years are huge — total freight movements are projected to increase by 92% in the next 30 years, according to a comprehensive congressional study. Congestion on the railroad network is also forecast to spread — by 2035, thirty percent of the rail network, or 16,000 miles, will experience unstable flows and service break-down conditions.[i] Considering the strong efficiency advantage of freight rail, that’s very bad news.

We face a choice in how the nation will step up to meet the coming demand for moving goods — and how clean those solutions will be. The upcoming reauthorization of the federal transportation bill is a great opportunity to help achieve a smarter, greener freight system. The innovative freight projects highlighted in this week’s “Good Haul” report by the Environmental Defense Fund demonstrates the practical solutions that are economically smart, protect us from harmful air pollution, and provide jobs for American workers. We have a golden opportunity to focus investments on projects that use the existing freight system more efficiently and grow the economy, while improving air quality and meeting big-picture national goals.

We need to recognize the connections between goods movement systems and public health and fast track the innovative solutions that tie transportation investments that improve efficiency with those that also improve air quality. The Good Haul report demonstrates that there have been innovative projects to address both these concerns and that some regions around the country are leading the way — but none of the practices in the case studies reflect current accepted standards or federal policy.

It’s time for the nation as a whole to refocus on options to invest in clean green freight.

Here’s a glance at a few of the 28 case studies highlighted in the report:

  • In Chicago, the CREATE program aims to reduce congestion and improve air quality by streamlining four major rail lines. Chicago handles 30% of rail freight revenue and expects to see an 89% increase in rail traffic over the next 30 years. The program will result in $1.12 billion in health care savings from improved air quality and will generate economic activity valued at more than $525 million. The program expects to create 2,700 annual jobs.
  • In Southern California, the Ports of Los Angeles and Long Beach launched the Clean Air Action Plan in 2006, which cleans up all areas of port activity: ships, trucks, cargo handling equipment, locomotives — even tug boats. The plan has already taken 2,000 dirty diesel trucks off the road and has created more than 3,000 jobs at the Port of LA, alone.
  • In Seattle, BNSF Railway installed four electric wide-span, rail-mounted gantry cranes at the Seattle International Gateway (SIG) intermodal facility. The cranes’ wide footprints allow them to span three tracks, stack containers and load and unload both trucks and railcars. The cranes produce zero onsite emissions and have increased throughput by 30% at the facility.
  • In the East, the Port of Virginia’s Green Goat hybrid yard switcher, a rail locomotive that moves short distances within a rail yard, provides fuel savings between 40-60% and is predicted to reduce nitrogen oxide and particulate matter emissions between 80-90% annually.
  • Along the Gulf, SeaBridge freight, a coastal shipping service between Port Manatee, Florida and Brownsville, Texas avoids an average of 1,386 miles of congested highways. Compared to trucking, one SeaBridge barge has the capacity to remove 400,000 truck highway miles on a single one-way voyage.

[i] Association of American Railroads, National Rail Infrastructure Capacity and Investment Study prepared by Cambridge Systematics, Inc. (Washington, DC: September 2007), figure 4.4, page 4-10.

Cleaner buses can create jobs, improve the environment

A new study by Duke University illuminates the fact that thousands of green jobs are waiting to be tapped in transit bus manufacturing — if the federal government will make a sustained commitment to investing in public transportation.

The Duke University Center on Globalization, Governance and Competitiveness released a new report this morning during a briefing at the Natural Resources Defense Council that evaluated the many U.S. job opportunities that can reduce carbon emissions in public transit buses. Jobs in and related to public transportation are some of the lowest hanging fruit in the push for green jobs, so what’s keeping the domestic manufacturing industry from ramping up?

The U.S. market for heavy-duty transit buses is small, currently delivering 5,000 to 5,500 buses per year. U.S.-based firms dominate the North American bus market, with an 88% share in total buses and a 51% share in heavy-duty transit buses. Under current U.S. transportation policy, which favors highway spending and de-emphasizes public transit, bus orders are small and sporadic; this makes it difficult for the bus industry to grow.

Buses and Jobs — Duke CGGC report
Non-comprehensive chart of the domestic supply chain for buses. From the Duke CGGC report, p.30

The report is well worth a read, but for a much simpler case study of what this means in real life, consider one piece of the complex supply chain for transit buses that we tend to take for granted: seats. On a crowded bus or train, you may not get the chance to sit in one, but when you do, you probably don’t think about the design or innovation that went into that seat. It probably didn’t occur to you that seats can add hundreds or thousands of pounds of weight that the bus needs energy to carry.

David McLaughlin, vice president of the American Seating Company, a U.S.-based manufacturer of seats for buses and railcars (among many other things), made it clear at this morning’s briefing that increased investment in transit would be good for business. But he also stressed that those benefits are not limited to American Seating alone. As a result of the stimulus bill from 2009, McLaughlin’s company calculated $2.9 million in new business, the bulk of which resulted from seat orders for buses and railcars ordered by transit agencies across the country with stimulus dollars.

“$2.9 million means 11 new jobs for us at American Seating,” he said. In another internal study, His company discovered that 1 job at American Seating sustained roughly 6 others in their immediate supply chain.

Take those two facts together and you begin to see the economic impact of the small public transit investment in the stimulus — and what could happen on a much larger scale. American Seating, just one manufacturer of one particular component that goes into transit vehicles, created the equivalent of 11 jobs through the stimulus. Those 11 jobs create or sustain 66 more at the company that supply them.

Stimulus spending will not be enough, however. Although the economic activity resulting from the stimulus was important, McLaughlin said his business needs investment that is reliable, consistent and predictable — like the funding that could result from a full six-year transportation bill. Stable funding sources will fuel the research and development that can cut seats weights even further and enable buses to use less energy.

“The stimulus package has been a good thing, but what we really need is sustained predictable investment, so we can make the investments we need to make to ensure our viability. This isn’t just a public issue, it’s a public-private issue.  …It’s jobs,” he said.

The message from all fronts this morning was consistent. To spur job creation through manufacturing cleaner transit buses, the industry needs reliable, predictable investment and government policies that encourage innovation. Increasing the available federal funding for new transit lines and rolling stock is one aspect. Ensuring operation of these new transit lines remains affordable is another. Both are needed. As the report says:

If federal, state and local policy were to shift to a clear, sustained commitment to public transit, the nation would have the manufacturing capability to meet the resulting increased demand for transit buses. However, the transit bus industry is unlikely to have significant market growth in the absence of several major changes: better management of public transit funds and improved coordination with manufacturing firms; significant, sustained public funding; and perhaps most important, a comprehensive transportation policy shift that encourages public transit use.

Or, in other words, give transit agencies money to buy new rolling stock — and the money to operate them — and you’ll be creating green jobs on Main Street all across America. Buy new hybrid buses for New York City or San Francisco to reduce emissions there, and support new jobs in towns like Grand Rapids, Michigan that need jobs more than anything.