 About Steve Davis

Stephen Lee Davis is the AVP for Transportation Strategy at Smart Growth America.

Newspaper editorial boards urge action on repairing bridges

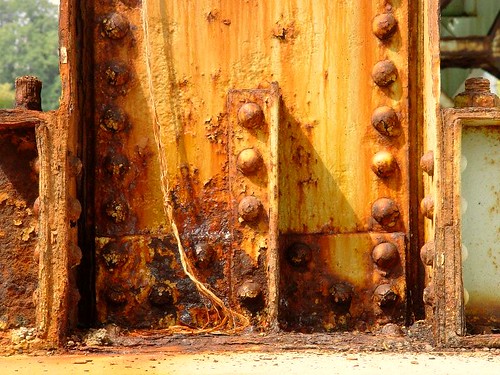
Pittsburgh Bridge Originally uploaded by mikeyexists to Flickr.

In the days since our comprehensive bridge report (The Fix We’re In For) was released, at least one governor has promised action and several newspaper editorials have urged their states to prioritize repair and address the growing backlog of deficient bridges.

In Pennsylvania, with the worst bridges in the country, there was little surprise that the report would make big headlines. New Governor Tom Corbett told the Pittsburgh Post Gazette that his transportation secretary will be creating a task force to look at the issue and come up with funding strategies to repair bridges — even telling the Tribune Review he’d consider selling state-owned liquor stores to pay for it. He’s also pledging to continue an accelerated bridge repair program created under former Governor Ed Rendell that has helped in recent years.

Today, the Post Gazette published an editorial on the issue focusing on what the state can do to help move Pennsylvania down the rankings in the coming years.

As if Gov. Tom Corbett doesn’t have enough financial challenges, last week brought a reminder of another problem that is not going away and will only get worse. According to Transportation for America, a coalition of groups working for national transportation reform, Pennsylvania still leads the nation in structurally deficient highway bridges.

What is depressing about this finding issued last Wednesday is that Gov. Ed Rendell made a priority of fixing bridges. By selling bonds and using federal stimulus funding, the Rendell administration did a lot of good work on bridges, without which the situation would be more dire. But, as this report shows, it’s hard to make up for years of neglect…

…The fact that Pennsylvania remains No. 1 in bad bridges can’t be blamed on Mr. Corbett, but the headlines that would come if a Minneapolis-type bridge disaster happened here would be part of his legacy. This latest report is a reminder that finding creative funding for bridges isn’t just a challenge — it’s a necessity.

As the Post Gazette hints at, states have a lot of power within the federal framework to do a better job with repairing their bridges. As our report notes, states aren’t even required to spend all of their bridge repair money on bridges. But a large part of the solution to this problem will come from Congress and the next multi-year transportation bill. That bill must provide more funding for bridge repair and it should hold states accountable for fixing their bridges with that money.

Until then, states with older infrastructure and a large backlog of deficient bridges, like Pennsylvania, will be fighting this battle at a bit of a disadvantage.

(Ed. note: The Times-Picayune in New Orleans offered a similar editorial)

National report and interactive map shows the state of our nation’s bridges

69,223 bridges – representing more than 11 percent of all U.S. highway bridges – are classified as “structurally deficient,” requiring significant maintenance, rehabilitation or replacement, according to a new T4 America report released today, The Fix We’re In: The State of Our Nation’s Bridges.

Those are the facts, and 69,000 bridges sure sounds like a lot, but what does that look like in real terms? Where are these bridges? Does your city or state have a lot of deficient bridges, or does the state do a good job taking care of them? Those questions are going to be much easier to answer with our online tools accompanying the report, launching today at t4america.org/resources/bridges.

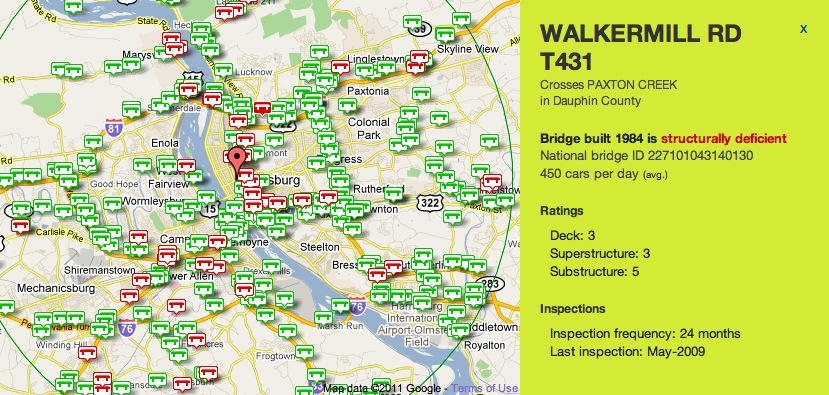
We’ve taken the whole federal bridge database and put it online in a map, so you can type your address, and see all the bridges within a ten-mile radius. Structurally deficient bridges will show up as red icons. Click any bridge and you’ll get more information about it, including its rating in a box on the right.

Curious about how your state stacks up? Click on “By State” and click your state to see a quick overview of their performance, including the best and worst five counties, as well as their rank nationally and total percentage of structurally deficient bridges.

The national report and all 51 state reports are being officially released today at noon with a national telebriefing, but you can go ahead and check out the map and data now on our site. (Media members? Contact david.goldberg@t4america.org if you want information on the telebriefing.)

Check out the map today and please spread the word about it. We’ll be posting several times throughout the day with more information about the national report, which is available for download now — as well as reports for all 50 states and D.C.

Share this
on Twitter
           Share Share this
on Facebook

New report assessing the condition of our nation’s bridges coming Wednesday

A report being released Wednesday by T4 America chronicles the state of our nation’s bridges, with accompanying data and reports for all 50 states and the District of Columbia. Our country is facing a backlog of deficient bridges that need repairs and maintenance to stay open and safe, with needs far greater than what we’re currently spending.

If you’ve been paying attention to stories about our infrastructure at any time in the last few years, it won’t come as a surprise to you that our transportation infrastructure isn’t in the best shape. Every year, headlines are made when the American Society of Civil Engineers rates our roads or bridges with grades that we’d ground our children for bringing home on their report cards. Most of the year, though, transportation infrastructure isn’t at the forefront of our minds, even though we depend on it every day.

But no event in recent memory jolted us into paying attention quite like the collapse of the I-35W bridge in Minneapolis three years ago this summer. After that event, there was renewed interest in assessing the condition of our bridges from governors demanding audits down to everyday drivers avoiding deficient bridges. But as the months went by, we went right back to taking these vital pieces of infrastructure for granted. So where do we stand today, almost three years later?

Wednesday’s report will answer questions such as:

  • How many bridges are in urgent need of repairs or maintenance?
  • What states are the best and worst when it comes to the condition of their bridges?
  • What counties in each state are the best and worst?
  • How much money are we spending on repairing our bridges, and is it enough?
  • Are we fixing our existing bridges before we spend money on new roads and highways?

We’ve already released the state-level reports in California, Florida, Illinois, Michigan, Minnesota and South Dakota. The rest of the states will be released on Wednesday with the national report, as well as a nifty interactive mapping tool that will allow you to find all the bridges near you and see how they rate. Check right here on Wednesday morning first thing for the report and the interactive mapping tools. Follow us on Twitter to get a stream of statistics about bridges throughout the week.

Reporter or media? Email David Goldberg for information about the national telebriefing and report details.

Americans want Congress to ‘fix it first’, invest in and improve our transportation system

I-5 Repair Originally uploaded by WSDOT to Flickr.

In the midst of the fervor about the House’s budget resolution for 2011 released Friday, and the President’s budget proposal for 2012 dominating the news today, a new bipartisan poll from the Rockefeller Foundation contains compelling arguments from a majority of Americans in favor of increased and accountable investment in transportation.

The poll shows unequivocally that voters from across the political spectrum are tired of bickering and want Congress to seek compromise. And almost nowhere else is their desire for cooperation and solutions greater than with the issue of transportation infrastructure.

Americans largely see investments in transportation as a way to improve the economy and make communities safer, while improving the quality of life for more people. They clearly see a need for reform when it comes to paying for and choosing the transportation projects we need, according to the results.

This poll shows that we believe strongly that providing a safe transportation systems that works is a primary role of our government, and that it should be above partisan divisions, more than most other issues. The Administration’s budget proposal, released this morning, also delivers on the desire reflected in the poll to prioritize the maintenance of what we’ve already built, and for giving local communities more say in how they solve their transportation issues and build for the future.

It’s fitting that the release of this poll is sandwiched between the House’s 2011 plan to gut transportation spending and the Administration’s 2012 plan to invest more money in transportation (within a budget laced with overall cuts). This poll makes it abundantly clear that the House 2011 budget resolution – which would cut support for communities that want better public transportation and safer streets — is at dramatic odds with the desires of a majority of Americans.

Here are some of the detailed top-line findings from the poll:

Should Congress find some way to work together on the issue of transportation? 71 percent of voters say there should be common ground on this issue — higher than other major issues — while 19 percent say leaders should hold fast to their positions, which is lower than other major issues.

The connection between investing and building the economy: Four in five (80 percent) voters agree that federal funding to improve and modernize transportation “will boost local economies and create millions of jobs from construction to manufacturing to engineering.” Just 19 percent disagree with this. 79 percent agree that “in order for the United States to remain the world’s top economic superpower, we need to modernize our transportation infrastructure and keep it up to date.” Only 19 percent disagree.

What should greater investment on transportation net us in the end? What would the benefits be? Voters’ top goal by far is “safer streets for our communities and children.” 57 percent say this should be one of the top-two priorities if more money is invested in infrastructure. The second-highest priority for voters overall (32 percent) is “more transportation options.” In addition, 85 percent agree that “spending less time in traffic would improve quality of life, make communities safer, and reduce stress in people’s daily lives.” Moreover, the vast majority also believe the country (80 percent) and their own community (66 percent) would benefit from an expanded and improved public transportation system.

What should we change about how we invest money in transportation? Two-thirds of respondents favored 9 of 10 reforms offered, with 90 percent supporting more accountability and certification that projects are delivered on time and fit into a national plan. Among the specific reforms to the system that were proposed, 86 percent supported a “fix it first” policy that focuses on maintaining existing transportation systems before building new ones.

This poll was conducted by two Republican and Democratic polling firms from Jan. 29-Feb 6 2011. Disclosure: T4 America is a grantee of the Rockefeller Foundation.

House budget for the rest of 2011 has deep cuts for transportation

On the Friday before the President releases his budget for 2012 (forthcoming sometime this morning), the House Appropriations Committee, led by Chairman Hal Rogers (R-Ky.) released their funding proposal to carry the government through the rest of 2011.

Quick refresher: The government is currently operating under what’s known as a Continuing Resolution (CR) that expires in March. Congress has been under pressure since late in 2010 to pass a full budget, but have been passing Continuing Resolutions due to an inability to agree on and pass a budget. These CRs basically continue funding levels from the 2010 fiscal year until Congress manages to pass a budget for 2011. Or they pass a CR with cuts and lower funding, which is what the House has proposed.

The 2011 budget that passed out of the Appropriations Committee Friday afternoon has some significant cuts for transportation, and some of them mirror the proposal that came from the Republican Study Committee a few weeks ago. There are a lot of cuts to very worthwhile programs across the board, but here are some of the highlights (lowlights?) for transportation:

  • New Starts, the program that funds new transit construction, gets cut by $430 million. There is also a rescission of about $300 million in unspent 2010 (fiscal year) funds.
  • High-speed rail is cut completely and the CR would rescind essentially all funds from 2010. Other than the money already spent, this entire program is eliminated.
  • The innovative TIGER program is eliminated completely and the unspent/unobligated FY10 funds are rescinded.
  • Amtrak appears to be mostly intact, avoiding the cuts that were proposed by the GOP study committee.

These cuts target exactly the kinds of projects that can create the most jobs and can help get our economy moving. Costs for labor and material are low right now, making it a prime time to spend on infrastructure, and we know that spending on public transportation creates more jobs than other types of transportation spending.

While these cuts are indeed severe and may get some support in the House, this proposal will still have to make it through the Senate.

We’ll be back later today with some information on how you can contact your Representative and urge them to reject these cuts to critical transportation projects.

Proposed budget would gut transit spending, passenger rail funding

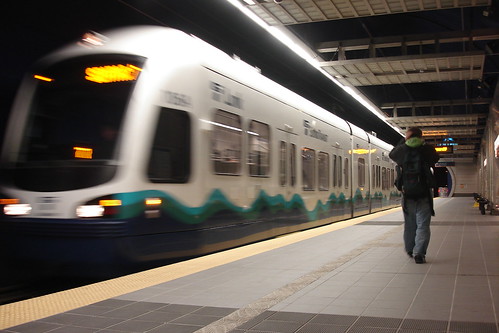
Sound Transit underground Originally uploaded by Transportation for America to Flickr.
A Seattle Sound transit light rail car moves through a tunnel south of downtown. Sound Transit’s new line was funded in part by the federal New Starts transit program.

The budget proposal from the Republican Study Committee, which consists of 165 of the 242 GOP House members, released a week or so ago, calls for completely eliminating the main federal transit program, zeroes out Amtrak, cuts all funding for the metro system in the nation’s capital and slashes $2.5 billion in high-speed rail grants.

This shortsighted proposal would derail with uncanny precision exactly the kind of investments that are most critical for creating jobs and developing a 21st Century transportation infrastructure. And as far as transportation spending goes, these are some of the investments that create the most jobs per dollar spent.

The proposal eliminates New Starts, the transportation program that funds all new transit projects in the country, and slashes high-speed rail funding — the same program touted by President Obama to great fanfare in last week’s State of the Union.

It even chops all federal funding for Washington DC’s transit authority, the very transit system that these legislators’ staff and neighbors rely on every day to get to and from work.

This budget is a trial-balloon for the budget fight to come. We need to waste no time making it clear that these kinds of cuts are short-sighted and unacceptable.

Sign our petition objecting to this assault on public transportation funding. We’ll deliver the petition with your signature along with a letter from us and our partners to lawmakers. (Are you a T4 America partner who wants to sign your org onto the letter? Contact Heather Brutz for more info.)

The lawmakers who crafted this budget clearly aren’t aware that millions of Americans — including their own constituents — rely on passenger rail and the types of transit projects these programs fund.

These are also the very projects that pay some of the most far-reaching economic dividends. Study after study has shown that every dollar spent on public transportation generates more jobs than any other form of transportation spending. This proposed budget cuts the investments that create the most jobs – an especially poor decision in the face of a recovering economy.

We can keep this proposal from becoming law if we speak up now and make it clear that Americans aren’t going to sit by as federal investments in transit are gutted.

Sign our petition to protect federal support for transportation and jobs!

So what do you want from transportation?

We noticed that the folks at AASHTO are asking all their visitors to weigh in and “tell Congress” what they want to see in a transportation bill, and more broadly, what they think we need to be building and doing with our transportation dollars.

During the six-week campaign, people can use AASHTO’s Facebook page to post YouTube videos and written comments about their transportation priorities, ideas, and personal stories. Already a number of people have weighed-in on their concerns, from traffic congestion and safety, to high-speed rail and job creation through greater investment in transportation projects.

To view or post your comment, go to http://www.transportation.org/IToldCongress.

We like their idea and encourage you to weigh in with them.

As some of our polls and other groups’ polling have shown, Americans have a pretty good idea what we want to spend our money on. We want to have more options for getting around. Nobody wants to be stuck with only one way to get where they need to go. We need to do a better job of fixing what we’ve already got before we spend money on a lot of expensive new things. Travel should be safe, no matter whether we’re in a car, on a train or on foot or bike. Our communities need to have the power to build what we need to get us where we need to go.

So go and tell AASTHO: What do you want?

Blaming the pedestrian won’t solve the problem

Walking in the ditch Originally uploaded by Transportation for America to Flickr.
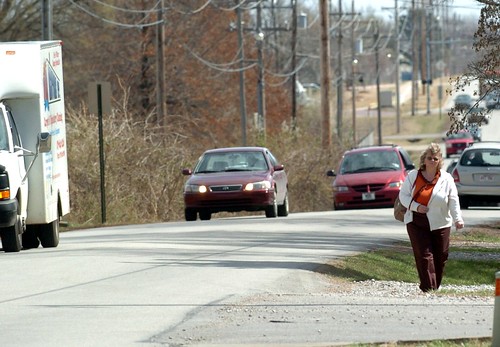
If this woman got hit by car, it’s probably her fault, right? Photograph by Stephen Lee Davis/Transportation for America.

We noted on Twitter this morning a story in the USA Today about pedestrian deaths increasing in 2010, halting a decline that had been going on for quite a few years. The USA Today story took the angle offered from the head of a state safety association (Governors Highway Safety Association) that pedestrians are at fault for the increase in deaths. The Washington Examiner, not to be outdone, took some comments from the head of the association to baselessly suggest that more pedestrians are being killed because of the First Lady’s “Let’s Move” campaign to get more people active and walking to stem the obesity epidemic.

That’s right, it has nothing to do with things like 4 -and 6- and 8- lane arterials with no sidewalks and crosswalks a mile apart running through our communities. Or streets built without sidewalks. Or 55 mile per hour speed limits on roads where people need to walk. Or curved right turn lanes that allow cars to make turns at intersections at 30 mph. It has nothing to do with roads that are dangerous by design, leading to thousands of avoidable fatalities every year.

Automatically blaming the pedestrian is shameful and the GHSA should take their time to study the issue more carefully. Pedestrians are dying by the thousands, and it’s not because they’re using an ipod while crossing the street or trying to get more exercise at the First Lady’s urging. It’s because our basic choices about road design have left far too many without a safe place to walk, putting too many pedestrians in harm’s way.

We’d laugh at the GHSA’s silly suggestion, but we’re talking about a crisis that’s resulted in 76,000 deaths in the last 15 years. It’s no laughing matter.

UPDATE: The GHSA told the Atlantic that they were misquoted by the Examiner. They don’t refute a possible link, but they do say they support Michelle Obama’s program, adding that if more people are walking, they need to be aware.

Harsha said her primary concern for pedestrians was the increased use of electronic devices like iPods that can block out sound and make walkers unaware of oncoming traffic. The organization has received anecdotal evidence of pedestrian injuries caused by people walking into traffic.

It’s good they clarified, but it still sounds like they don’t quite grasp the main cause of death for pedestrians: Roads that are dangerous by design and unsafe for pedestrians. “Distracted” pedestrians aren’t the real culprit here.

TBD, a local DC news site, shared the pitch that they got from the GHSA, which is likely where the “Let’s Move” connection originated:

“Why the increase? We don’t really know but speculate that it could be a couple factors. One is the possible increase in distracted pedestrians and distracted drivers. We’ve been focusing on the drivers, but perhaps we need to focus some attention on distracted walkers! Additionally, Mrs. Obama and others have been bringing attention to ‘get moving’ programs, so perhaps pedestrian exposure has increased.”

Do you know a good job-creation story from the stimulus?

The $787 billion stimulus from 2009 included roughly $30 billion for transportation, and $8 billion specifically for transit. Also, large transit agencies had the flexibility to use a portion of their stimulus money to operate trains and buses, in many cases keeping already painful cuts and fare increases from getting any worse.

So here’s the call: Did you get a job or keep a job by virtue of the spending on transit in the stimulus? We want to hear from you and hear your story. Are you building railcars or buses? Some other part of the supply chain for transit?

Share your story with us directly at info@t4america.org. And pass this along to anyone you know who might have a story to share with us.

What do the House rule changes mean for transportation spending?

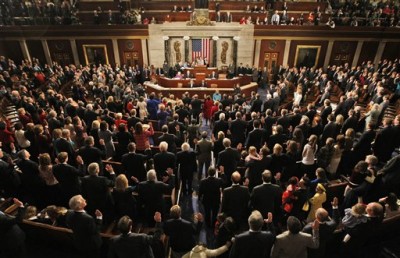
Earlier this week the House adopted rules for this new session of Congress. It’s a bit of inside baseball that can be hard to decipher, but these rules determine how bills are considered by lawmakers and what bills can and cannot do. Streetsblog Capitol Hill covered this issue on Monday and today, but it’s worth a closer examination.

One of the new rules will definitely have two significant impacts on transportation spending.

First, it would subject transportation spending to the annual appropriations process. Basically this means that instead of having transportation funding be more or less automatically tied to spending determined by the six-year transportation law, appropriators in Congress would decide funding levels each year — likely lower than what the transportation bill “authorized” and potentially leaving money unspent in the highway trust fund each year.

Since 1998 during the last two transportation laws (SAFETEA-LU and TEA-21), appropriators have been required by House rules to fund overall transportation programs at the aggregate levels written into the authorization, like current law SAFETEA-LU. This change will allow congressional appropriators to fund transportation below funding levels authorized in the transportation law or even below gas tax receipts.

While the new rule won’t actually allow diversions of transportation dollars to non-transportation uses as some highway advocacy groups claimed last week, it nevertheless poses some significant issues. It would have an impact on the economy and on local projects that rely on the certainty of guaranteed funding to bid out contracts and build projects. It could create even more uncertainty than we already have with the continued stopgap extensions.

There’s no doubt that the highway trust fund isn’t covering what we need to spend as general funds have been used to shore up the trust fund in the past few years. But cutting transportation spending even further won’t solve the real problems, namely that the money — whether it’s more or less than before — is too often given out to states with no strings attached and no accountability for what that money should accomplish.

We need a better program that spends money wisely to meet the needs we have in 2010, not just a cheaper one.

Second, the new rule would prohibit the Appropriations Committee from funding any program not specifically authorized in law. This means that innovative programs that were created outside the six-year transportation authorization like TIGER or the Bush Administration’s Urban Partnership Program wouldn’t receive funding from the trust fund because they were new programs not included in the transportation authorization. (The UP program was the source of funding for congestion pricing in New York, before that project fell apart locally.)

In the last 8 years, both Republican and Democratic presidents have developed creative programs like these to better address our nation’s transportation needs. If this rule had been in place these two programs would not have been funded and projects like the Norfolk-Southern’s Crescent Corridor and Minneapolis’s I-35 multimodal corridor improvements among others could not have moved forward.

Could another new passenger rail line be facing the ax?

An Amtrak passenger train heads back to Chicago with a heavy load of passengers. Photo by David Johnson/NARP

UPDATE (1/21/11): The Iowa House approved a measure to cut the funding. It will likely move to the Senate. If you live in Iowa, use this link to contact your Rep and Senator today to tell them you support this important line.

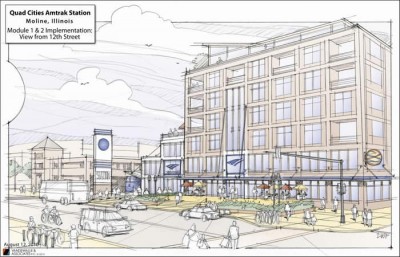
Potentially following in the footsteps of Wisconsin and Ohio, the Republicans in the state legislature are considering the possibility of killing Iowa’s portion of a planned higher speed passenger rail line from Chicago to Iowa City that would pass through the Quad Cities and the new Moline (Ill.) multimodal transportation hub funded by a TIGER grant.

Just after the last round of TIGER grants were announced, Iowa and Illinois received a joint $230 million grant from the Federal Railroad Administration — separately from the DOT’s high-speed rail program — to start new 110 mph service from Chicago to Iowa City; service that could eventually connect to Des Moines and Omaha and lay the groundwork for a true 220 mph high-speed system connecting Iowa to the hub (Chicago) of the midwest’s high speed network.

The feds have committed $230 million of the $310 million that the two states were asking for on this project, leaving the states to come up with the rest. Iowa had committed around $10 million toward the gap, but state Republicans are currently working on a budget that would cancel that funding and result in all sorts of dilemmas for the project. From the Des Moines Register:

The Republican-sponsored budget package would not provide any state money needed to establish and subsidize operations for the route, almost certainly forcing the Iowa Department of Transportation to return a federal grant of $81.4 million already awarded for the passenger train project.

Where the story on this project differs from similar recent stories in Wisconsin and Ohio of grants going back to Washington is that this project spans two states for an interstate rail line. Illinois will be able to keep their share of the grant, which is larger since the bulk of the route spans their state, but what will happen to the route? Will it simply stop at the border at the new Moline multimodal hub? What about the future of a Omaha/Des Moines/Iowa City connection to Chicago? Will it bypass important Iowa cities?

It’s imperative that the Iowa legislature and Governor Branstad follow through on their state’s commitment to build this valuable new service. Following the path of I-80 and I-88, it would hit all the major population centers of Iowa on it’s way to and from Chicago.

Could this be the new terminal of the line intended to travel into Iowa? Photo of the planned Moline (Illinois) multimodal center.

The silliest comment of the day comes from Senate Minority Leader Paul McKinley, who somehow manages to compare the benefits of a ditch being dug and filled in to an invaluable direct transportation connection to the economic engine of the Midwest.

“I can hire someone to dig a ditch, hire somebody to fill it in, and somebody would claim it creates a job, but does it really accomplish anything?” McKinley said. “I think that’s the question we have to ask ourselves about passenger rail to Chicago.”

The legislative session hasn’t started yet, so it may be premature to jump to any conclusions yet as the Iowa Chamber said, but as the recent cuts in Wisconsin and Ohio showed us, it’s important that these leaders hear from supporters early and often — long before a decision is made. And incoming Governor Terry Branstad has thus far pledged to keep the issue nonpartisan and examine the project fairly and honestly. He needs to be held to that promise.

Iowa residents: Call and write your state legislators and Governor Branstad and tell them that this project is crucially important to Iowa’s future. You can use this page to look up their phone numbers and emails.

Smarter transportation case studies — innovation from around the world

When a resource is scarce, the first step is always to make sure that you’re using that resource to its fullest. A quick glance at a congested road, a street with no parking or a jam-packed rush hour train might tell you that there’s no excess capacity going unused, but is that really true? While we continue to push for a greater investment in transportation overall to expand options for all Americans, are there ways to better use the resources that we’ve already got?

Our new report on smarter mobility released today demonstrates how existing and emerging technologies can squeeze more capacity from over-burdened highways, help commuters avoid traffic delays and expand and improve transportation options, all while saving money and creating jobs.

Many of these smart transportation solutions are already fueling innovation throughout the country, through both the public and private sector. These 14 case studies from around the U.S. and the world demonstrate the community benefits smart mobility solutions are giving regions, cities, and businesses. You can read all of these examples immediately by downloading the full report, but for those of you who find a 38-page report a little intimidating, we’re going to publish the case studies as a series so you can get them in bite-sized chunks one day at a time. Check back each day for a new story.

These 14 examples are classified into five broad areas of innovation, which can be identified with the colored banners at the top of each page to help quickly see what kind of innovation this case study demonstrates.

1. Making transportation systems more efficient. Ensuring that the resources we’ve already invested in are fully utilized is the first step. Already, many regions use digital technologies to collect information about highway networks and manage the flow on and off of major road facilities. For example, by controlling “ramp meters” and synchronizing traffic lights, Minneapolis-St. Paul was able to increase freeway volume nine percent and increase peak period throughput 14 percent.

In Detroit, Michigan, advanced traveler information systems, highway advisory radio, ramp metering, and variable message signs increased average vehicle speeds by 5.4 mph, decreased trip times by 4.6 minutes, and reduced commuter delay by 22 percent. Technologies that pre-empt traffic signals can also improve travel times for bus rapid transit and light rail. More broadly, IT systems are beginning to integrate transportation networks and services.

2. Providing more travel options. Before the Internet, providing services to help people share cars or rides was cumbersome, if not impossible. Now, on-line databases can be used to match riders to van pools and car pools, and to support car-sharing and bicycle-sharing services that allow one person access to a variety of cars or bikes any time of the day or night.

These allow for on-demand reservation of the vehicle type needed, at just the moment they are needed. In the Denver metropolitan area, vanpools offer an alternative to driving for groups of commuters who live and work near each other, and who travel more than 15 miles to work. Vanpooling also allows an opportunity to save money by splitting a low monthly fare.


3. Providing travelers with better, more accurate, and more connected information. The more information people have, the more efficiently they can plan their travel and choose and connect the modes and services and routes that best suit their circumstances. Computerized vehicle tracking and information delivery can let public transportation riders know in real time — via electronic signs, smart phones or other means — exactly when to expect their bus or train.

Users of the Advanced Traveler Information Service in the Washington, DC region were able to reduce the frequency of early and late arrivals by 56 and 52 percent, respectively. Bicyclists too can use personal technology to find safe and efficient bike routes in unfamiliar places, and to connect up with a wider range of transportation options door-to-door.

4. Making pricing and payments more convenient and efficient. When resources are scarce or in high demand, pricing is one of the best ways to allocate their use. This is true of parking, where smart meters can vary prices by demand to always keep a minimum of spaces vacant, and collect fees using a wide variety of payment media. Variable tolls can help to regulate the flow on freeway lanes. The New Jersey Turnpike Authority reports that their EZ Pass system reduces toll station traffic delay by 85 percent.

Electronic benefit cards can be a convenient way for low-income people to pay for a variety of subsidized goods, including public transportation, with a single card or their phone.

5. Reducing trips and traffic. Sometimes the smartest trip is the one not taken. A growing number of Americans use technology to work from a variety of remote locations, allowing them to shift their commutes to times when there is less traffic or avoid traveling to an office altogether. Employers at the national retailer Best Buy famously increased company savings by letting employees set their own hours and decide when, where, and how to get their jobs done. An infinite variety of work arrangements are now available to many Americans, who may use more than one in any given week.

Eliminating trips is not only limited to work. You can now access banks, shopping, medicine, and education services online or over the phone, which can help us do things without going out the door. Smart technology helps users make wise choices about when, where, how and whether to travel.

—-

Read the full series here: Smart Transportation Case Studies

Debunking the congestion index used to justify the policies that keep us stuck in traffic

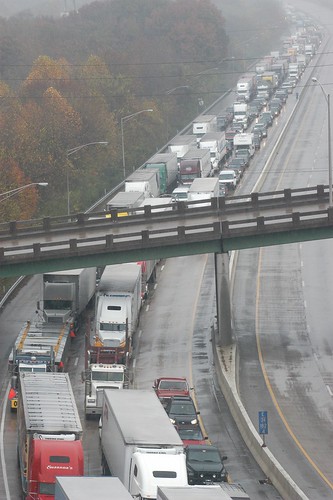
Interstate 24 Traffic Originally uploaded by Transportation for America to Flickr.

The cycle is familiar by now. A study tells us what we all know: our roads are congested. We pour billions into new roads and lanes to “reduce congestion.” Then the study comes out two years later and just as before, our roads are still congested. There’s a call for new roads, new roads open up, we drive further and further, congestion goes up. Rinse and repeat.

Every two years, nearly every major media outlet in the country reports on a “congestion index” study that ranks metro areas and cities by their relative amount of traffic congestion. But a significant new report from CEOs for Cities suggests that there’s a fundamental flaw in that study from the Texas Transportation Institute, and by failing to accurately measure congestion or pinpoint what is producing it in our cities, we’re failing to truly understand the problem.

And when you don’t understand the problem, how can you ever really fix it?

Noah Kazis at Streetsblog most succinctly describes how the TTI study fails to see the whole picture:

Imagine two drivers leaving downtown to head home. Each of them sits in traffic for the first ten miles of the commute but at that point, their paths diverge. The first one has reached home. The second has another twenty miles to drive, though luckily for her, the roads are clear and congestion doesn’t slow her down. Who’s got a better commute?

Shockingly, the standard method for measuring traffic congestion implies that the second driver has it better. The Texas Transportation Institute’s Urban Mobility Report (UMR) only studies how congestion slows down drivers from hypothetical maximum speeds, completely ignoring how long it takes to actually get where you’re going. The result is an incessant call for more highway lanes from newspapers across the country.

The reason why we find ourselves in this situation is because our current federal transportation policies virtually guarantee it. There’s no financial incentive for anyone to measure congestion accurately or improve it — states just get a big load of federal transportation money with few strings attached. Congestion doesn’t get better in large part because states and metro areas aren’t required to reduce congestion or try to shorten or reduce trips with their federal money.

If a state wants to spend some of their federal money on a new comprehensive metro transit system to provide drivers some relief by giving them an additional option as well as taking cars off the road, the process takes years longer and is far more complex. What state, given the choice, would choose to invest in projects that take 4 times longer to get approved and require more local money to build? (Transit projects have about 50% of the cost paid by the federal government, highways get around 80%.)

As this new study demonstrates, the lack of proper metrics to measure success (or mostly failure) is emblematic of the need for reform.

If the ultimate point is to make smart transportation policy, we need to look at a lot of different factors that affect people’s lives. Fixating solely on interstate throughput, while failing to offer other travel and living options, has led our state departments of transportation to invest billions to create a result that is choking the lives out of our regions and isn’t making life better for the vast majority of commuters.

The good news is that places that are attempting to reduce trips and congestion by investing in diverse transportation options are actually showing progress. Regions that have been aggressively investing in additional travel options, eliminating trips, reducing trip length, creating more places to live close to jobs or more effectively managing demand have seen their congestion numbers get better, according to the CEOs for Cities report.

All of this is just one more giant sign pointing to the need for a truly reformed transportation program that can more accurately measure the problems we face, prescribe solutions that will work, and get out of the way as we unleash those solutions on the traffic that is killing our productivity and choking our regions while we motor along at 10 mph with no other option.

Once a critic, now a supporter, Ohio Rep. helps make complete streets bill bipartisan

Rep. Steve LaTourette (R-OH) probably learned the hard way earlier this year that safe, accessible streets for bikers, walkers and all users don’t tend to have any party affiliation, and he is to be commended for proving his support for complete streets by signing onto the House complete streets bill last week, becoming its first Republican cosponsor.

On behalf of our thousands of supporters from communities across the country who think that it’s important that our transportation network be safe and usable by everyone, we’d like to thank Rep. LaTourette for signing on to the Complete Streets Act of 2009, making the bill bipartisan in the House. He joins sixty other co-sponsors in supporting good transportation planning practices that ensure that the safety of everyone using the road will be taken into account – whether they are driving, bicycling, walking, or catching the train or bus.

For some strange reason at the federal level, complete streets have been unfortunately maligned as a partisan issue, with Republicans in Congress hesitant to formally support the principles in a bill, resulting in the strange dynamic of Congress being far behind the curve of their state and local counterparts where politicians and leaders of all stripes have supported complete streets from the state level on down to the big city, metro area, county and small town — no matter their party affiliation.

“With 23 states and more than 140 local governments adopting Complete Streets policies, it has become clear that this is not a partisan issue – and that this is a change in transportation priorities that Americans want to see nationwide,” said Barbara McCann, Executive Director of the National Complete Streets Coalition.

Charlotte Complete Streets-East Boulevard Originally uploaded by Complete Streets to Flickr.
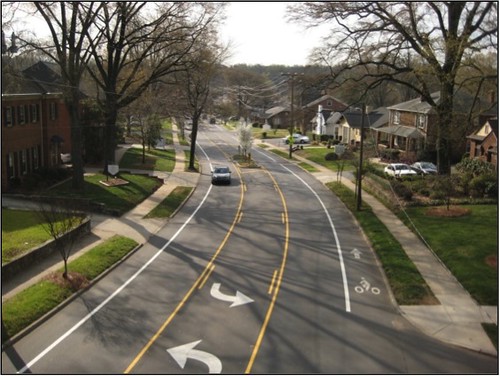
Before its road diet, Charlotte’s East Boulevard was a four-lane, undivided road, that carried over 20,000 per day! Now, East Blvd–with its bike lanes, center turn lane, and curb ramps — is a complete street. Photo: Charmeck.org

We’d certainly like to hope that Rep. LaTourette’s signature on the bill — a product of responding to the voice of his local constituents — will open the floodgates for more House Republicans to support a bill and an idea that has broad support across the country in the local areas they represent. We’re sure there are dozens of House Republicans who are supportive of this idea but have been hesitant to be the only member of their party on the bill at such a polarized time in D.C.

When Rep. LaTourette made his comments back in April of this year about biking and walking to Secretary LaHood in a hearing, he was overwhelmed by the outpouring of comments from residents of his district who agreed with the Secretary that it was high time to treat biking and walking as legitimate and equal forms of transportation.

So local advocates from Walk and Roll Cleveland worked with Mr. LaTourette to bring him on board, sharing information with him about the economic benefits of building infrastructure to serve bicyclists and pedestrians and local bicycle shop owners also visited him. It certainly didn’t hurt that the Ohio Department of Transportation has been showing interest in developing a statewide policy, according to the folks at the National Complete Streets Coalition, or that Cleveland’s metropolitan planning organization adopted a policy 7 years ago.

Members of the National Complete Streets Coalition were pleased with the development.

“In signing on to the Complete Streets bill, Rep. LaTourette has started what could become a significant step toward safer more user-friendly streets for everyone, whether they walk, drive or ride,” said AARP Senior VP for Government Relations and Advocacy David Sloane. “Many Ohioans have seen the benefits of Complete Streets policies in their hometowns; AARP looks forward to the rest of the nation sharing that opportunity.”

Are you represented by someone who hasn’t yet signed onto the Complete Streets Act of 2009? Follow the lead of these Ohio advocates and start calling your representative and organizing meetings to help them see that this idea has broad support back home where their votes are.

Being able to use a street safely — no matter your age, ability or mode of transport — isn’t a partisan idea. Help get that message across in Washington.

Learn more from the National Complete Streets Coalition.

DOT poised to move on a long-term transportation bill in 2011?

When President Obama made his announcement on Labor Day about investing in infrastructure, most media outlets focused in directly on the $50 billion amount that would be spent up front to jumpstart infrastructure investment — something we already noted last week. But he also talked about the need for a reformed long-term transportation reauthorization, the full six-year bill that would provide certainty for job creation and the economy.

Here’s a quote from the release that accompanied the President’s speech:

The President proposes to pair this with a long-term framework to reform and expand our nation’s investment in transportation infrastructure. Since the end of last year, when the last long-term surface transportation legislation expired, these investments have been continued on a temporary basis, even as the trust fund to finance them has fallen into insolvency. If we are to enjoy the benefits that come from a world-class transportation system, Congress must enact a long-term reauthorization that expands and reforms our infrastructure investments and returns the transportation trust fund to solvency.

So the million dollar question has been, when will we see this bill? With Congress unlikely to pass anything of substance between now and the election and an already full docket for the likely lame duck session to follow, what is the administration or USDOT saying about moving a bill forward?

As much progress as has been made by the House transportation committee thus far, introducing a full bill proposal all the way back in July of 2009, both chambers have been waiting for the White House to declare the transportation bill a priority and to put their significant weight behind it. Now it sounds like that day could be just a few months away.

In a meeting with advocates this week, Secretary LaHood said that they have the go-ahead from the White House to move a six year bill in 2011, with a full proposal accompanying the President’s budget request for FY12 in February, according to USDOT sources.

The question remains as to whether or not that will be a full bill, or merely the administration’s principles for a bill, but in either case, this is at least a glimmer of light at the end of the tunnel for our long wait for a transformational transportation bill. Which, we remind you, expired one year ago in just a few days. (See the clock above on our web site.)

Don’t let transportation get lost in the political shuffle; send a letter to your local paper

Newspaper pile Originally uploaded by Valerie Everett to Flickr.

When President Obama announced his vision on Labor Day for investing in 21st century infrastructure, he put our country on the right path toward smart transportation reform — a path that could transform communities across America and create desperately needed jobs.

But his bold vision to invest in safer streets, road and bridge repair, and high speed rail immediately came under fire from many of the usual suspects who prefer the current system of earmarks and oil industry tax breaks.

We need to respond to these attacks on transportation reform – publicly and quickly – to show the country and our lawmakers that the plan’s supporters greatly outnumber its critics.

Take 5 or 10 minutes and write a letter to the editor of your local paper today

Letters published in local papers are read carefully by members of Congress and their staffs – they represent the pulse of their communities. Getting a flood of supportive letters published will go a long way in helping shore up support for a transformational change in our country’s approach to transportation.

Plenty of old guard transportation insiders in Washington, DC – from the highway lobby to the oil companies – would love to see us pour twice as much money into the same old broken system, but we stand with Americans who want accountability for how we invest in transportation, ensuring that we invest in things that can get us moving again and create the most jobs.

Write your letter of support now – we’ll give you talking points to make it fast and easy, and we can even send your letter for you! Use our tool to write and submit a letter to your local paper.

USA Today on infrastructure spending: what do Americans want?

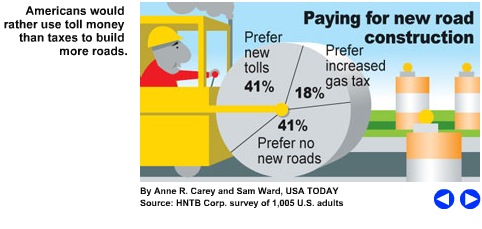
USA Today had a timely graphic up yesterday, considering the continuing media coverage around President Obama’s recent proposal for infrastructure spending and a reformed long-term transportation bill.

First, the graphic:

Though we can’t see the rest of the questions or the context, it affirms a few things we already know about Americans’ attitudes about transportation — as evidenced in our own 2010 national poll — and how to fund what we need.

While Americans are actually voting in favor of taxing themselves to improve transportation in state and local ballot measures at a rate of about 70 percent, they often know exactly what they’re going to get in those cases: a new bridge, an expanded transit system, a system of repaired roads, or the like. But the federal program is much fuzzier in most people’s minds. The current system is broken and unaccountable, and putting more money into a broken system is like trying to bring more water up from a well using a bucket with a hole in it.

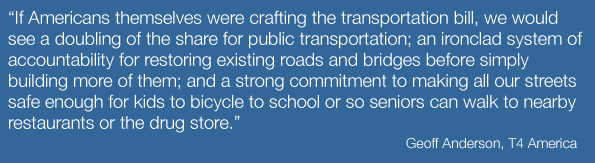
As James Corless wrote in an Infrastructurist guest post yesterday, “Some of the old guard transportation insiders in D.C. would be thrilled with doubling the overall size of our transportation program and pouring more money into the same broken system, but Americans know better. They want more accountability, safer streets, and more transportation options so seniors can maintain their independence and low wage workers can get to jobs.”

It’s also interesting that the sentence to the left of the poll summarizes it as “Americans would rather use tolls than taxes to build more roads,” when it could have just as easily been “Americans are OK with building no new roads if it means raising the gas tax or instituting tolls to pay for them.”

Maybe the poll asks the wrong question?

We’re not in favor of a moratorium on any new roads whatsoever, but this survey clearly reinforces the fact that Americans in urban and rural areas have moved beyond the idea that the solution to every transportation problem can and should be a new road.

We cooperated on a poll in 2009 with the National Association of Realtors, showing that Americans don’t think expanding roads and highways are the best use of scarce transportation dollars:

“As the federal government makes its plans for transportation funding in 2009, which ONE of the following should be the top priority?”

Maintaining and repairing roads, highways, freeways and bridges Expanding and improving bus, rail, and other public transportation Expanding and improving roads, highways, freeways and bridges Not sure
50% 31% 16% 3%

And as our 2010 poll showed, more than four-in-five voters (82 percent) say that “the United States would benefit from an expanded and improved transportation system, such as rail and buses” and a solid majority (56 percent) “strongly agree” with that statement. Fully 79 percent of rural voters agree as well, despite much lower use of public transportation compared to Americans in urban areas.

If you saw this graphic and your curiosity was piqued, perhaps it’s worth going back and poking through our national poll for a fuller picture.

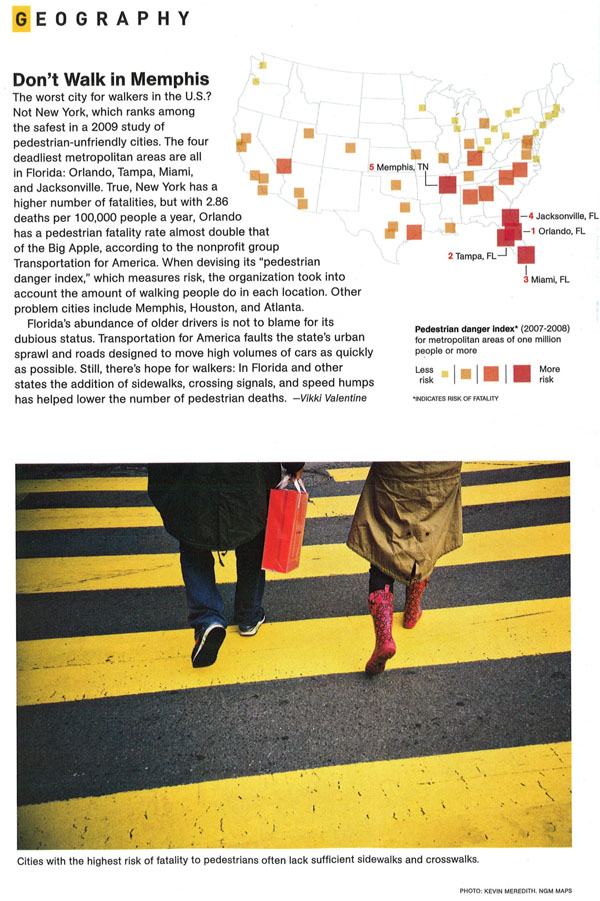
National Geographic on Dangerous by Design

We mentioned this on Twitter when the issue came out back in July, but National Geographic had a nice one-page feature on Dangerous by Design, our study from 2009 ranking metro areas on their relative danger to those on foot and bike, focusing on Florida’s overall risk based on having 4 of the top 10 most dangerous metros. In the last 15 years, more than 76,000 Americans have been killed while crossing or walking along a street in their community, and it’s high time that more attention was paid to this preventable loss of life that we far too often ignore or simple believe to be inevitable.

Click the image to download a PDF of the one-page article, and while you’re at it you could just go ahead and subscribe to one of our country’s best magazines for only 15 bucks.

Access denied: gaining a disabled person’s perspective

We’ve talked a bit here for nearly two years about the need to make our streets safe and accessible for all users — whether young, old, walkers, bikers, drivers, or wheelchair users. Almost every time we post pictures like this or this showing inaccessible conditions on our streets, it’s a reminder of how shocking it is that we build infrastructure in our communities that is almost impossible for certain citizens to use comfortably or at all.

Yesterday, we got an invite to add one of our photos to a Flickr group we’d not noticed before. Taking a few moments to scan through all 50 or so pictures can give you fresh eyes for looking at the streets and sidewalks around us.

Some of the problems in these photos are certainly systemic issues with how we build and design our streets or other public spaces. Some others, like having doors open outward, result from a lack of understanding or a failure of design. Until you’ve been in a wheelchair trying to get down the street to the movie theater or the drugstore, you probably don’t notice doors that are slightly too narrow, ramps that are too steep, or sidewalks without entry ramps.

They’re not all transportation-related, but this group’s photos are well worth a look.

Wildkat: Access Denied!

Walk Score expands into Transit Score; housing plus transportation costs

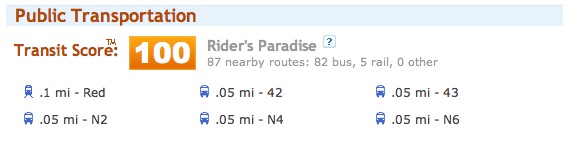
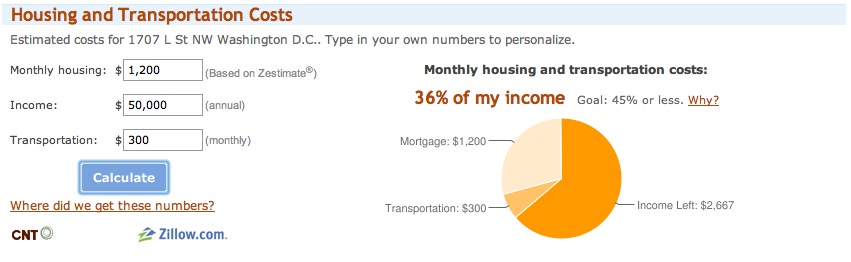
An exciting new service that launched this morning from our friends at Walk Score will help people all across the country find out how transit-accessible a home or a neighborhood is while gaining a better understanding of the true cost of buying a home — the cost of housing plus transportation.

Starting today, when you visit Walk Score you’ll also get information about nearby transit options, commuting details, and the expected cost of housing plus transportation. Some of the new features:

  • A Transit Score for the 40+ cities that provide open transit data. See the list of cities here
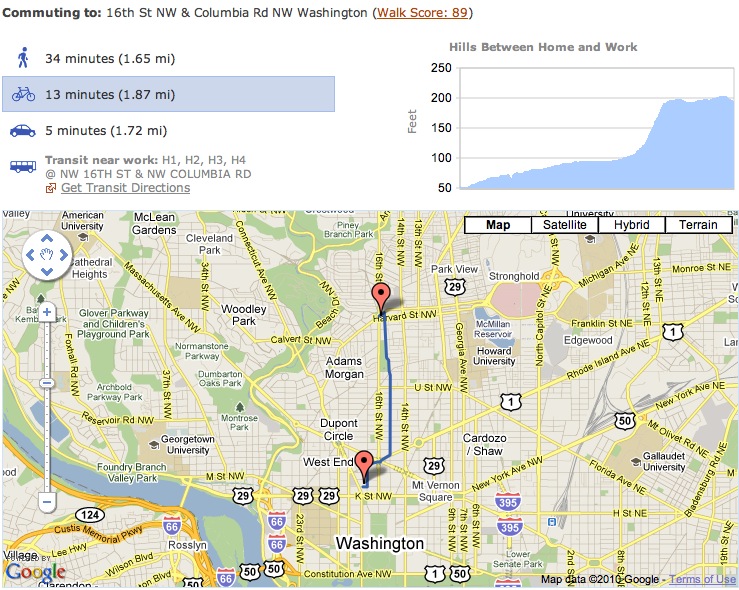
  • By entering a work and home address, you can get custom commute reports for all cities showing hills on your route for biking or walking, nearby transit lines, and travel times and directions based on mode. Select walking, biking, transit or driving and see the route update dynamically. (See example below)
  • They’ve also joined with the Center for Neighborhood Technology to allow users to calculate their expected transportation costs to give a fuller picture of the cost of a home.
  • They’re partnering with the real estate site ZipRealty to have this provided with all of ZipRealty’s home listings. So anyone looking for a home on their site will get exposed to these ideas on a regular basis.

Together with the Center for Neighborhood Technology, Walk Score and CNT have done more than almost anyone to help raise the visibility of the issue of housing and transportation costs in the minds of consumers and adding transit to the mix is the next obvious step. After all, you may live in a neighborhood with a 75 Walk Score but you’re a five minute walk away from a bus or train that can take you to a neighborhood with a 100 Walk Score in just a few more minutes. Being able to walk to and use a variety of of other transportation options expands your “walkshed” — something that Walk Score doesn’t recognize on its own.

When you search for the Walk Score now, you also get a Transit Score. And if you live in one of the 40 cities with open transit data, you can enter a second address and get a commute report, complete with directions. As an example, here’s a commute from a neighborhood north of downtown D.C and the T4 America office., where some of our staff live and ride their bikes to work. Click on the bike commute, and it shows you the profile of the hills, the time and mileage, and the route on a map:

These commute reports will be available for all cities, though the transit data will be left off for cities without open data.

Now I know what you’re thinking: only 40 cities with transit data? Indeed, Transit Score unfortunately only has access to a limited set of open transit data, because not all agencies have chosen to open up this publicly-owned data as a public resource. But there’s hope. You can petition your local transit agency to release their data publicly to make exciting tools like this and others possible. Visit www.citygoround.org to see a list of the 695 agencies with no open data and find information on how to request your local agency provide that data. (Read our post about the release of CityGoRound.)

Transit Score was supported by the Rockefeller Foundation, and had this to say in the official press release this morning:

“The Rockefeller Foundation’s transportation initiative is committed to helping Americans re-think our transportation future as a way to expand economic opportunity, and we are excited about the potential impact Transit Score will have in helping Americans make more informed decisions about where they will live and work,” said Benjamin de la Pena, Associate Director at The Rockefeller Foundation. “Transportation costs are often the second highest expense for working Americans and Transit Score will give families more control over their household budgets by providing them with information about their transit choices.”

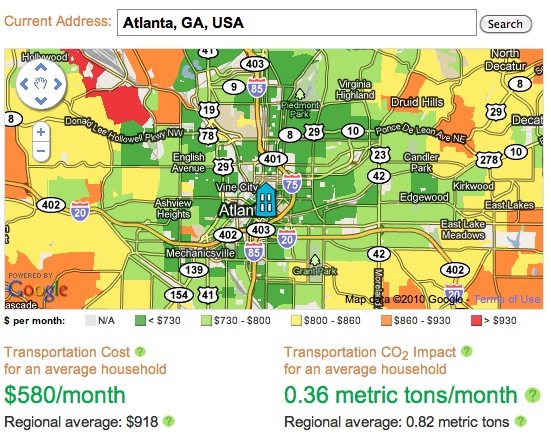
The housing+transportation calculator is cool, but at the risk of going on too long on a Monday morning, if you really want to dive into finding out more about housing and transportation costs today, you need to check out Abogo from the Center for Neighborhood Technology. Type in an address, and it gives you the cost you can expect to pay for transportation at that address and an estimate on emissions. With one glance at the color, you can see where transportation costs are low, and where they are higher, helping to make a more informed decision.

These kinds of tools are certainly important for helping consumers make more informed decisions when purchasing a house, but the greatest value is really what they do to help shatter the myth that the cost of a home is the only major cost of a home. With multiple trips taken each day to all the places we need to go, the locations of our homes have profound impacts on our pocketbooks, wallets and time. We applaud Walk Score, Transit Score and CNT for working hard to make the case that we need more walkable, transit-accessible places in our communities — and that the market is demanding them.