


The Fix We’re In For: 2015 Bridge Conditions
Do you drive on deficient bridges?

Updated with current 2015 data from USDOT. Enter an address to locate nearby bridges and see which ones are structurally deficient — bridges requiring significant maintenance, rehabilitation or replacement.
2015 State Reports

OREGON: Click to view the 2015 state report for Oregon. Released June 11, 2015
MINNESOTA: Click to view the 2015 state report for Minnesota. Released April 30, 2015
Tell Congress to fix it
Add your name to the growing list of Americans calling on Congress to fix it for America and give us safe, affordable and timely transportation options that we need
2013 National Report Resources
Visualizing the 2013 numbers
Click to see the infographic, learn more, and share it with your friends.
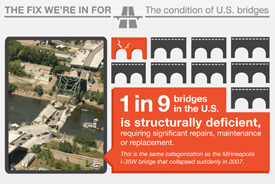
Please note: This infographic is sourced from 2013 data and accompanied our 2013 national report release.
Looking for our last national report?
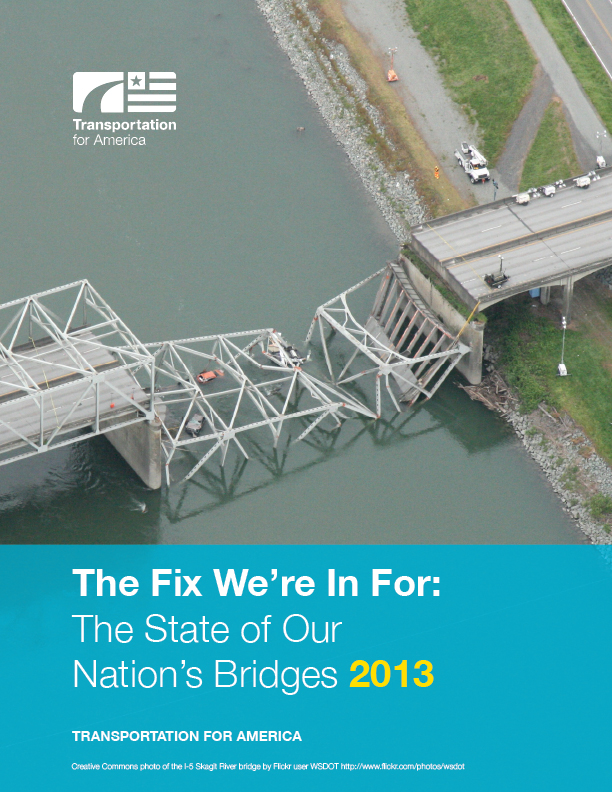
Read the last national report from 2013. 11 percent of all U.S. highway bridges are structurally deficient— bridges requiring significant maintenance, rehabilitation or replacement.
