
The loss of transportation choices in the U.S.

A person wearing a hood and heavy coat faces a busy street filled with cars and stoplights with no way to cross

Investments and policies that support car travel at the expense of all other transportation options have helped create a culture of driving in the U.S. Investing in a variety of transportation choices, like opportunities to bike, walk, and take public transit, would improve safety and accessibility for all.

A person wearing a hood and heavy coat faces a busy street filled with cars and stoplights with no way to cross
(Viktor Nikolaienko, Unsplash)

The ghost of walkable streets’ past

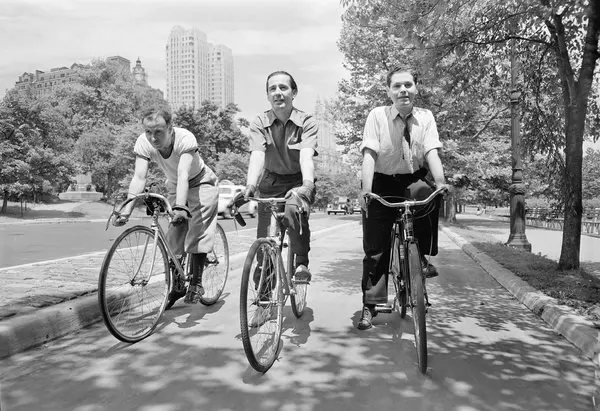
Before the car started to take off in the early 1930s, streets were for everyone. Wagons, walkers, bikers, horses, they all utilized the street to get to daily activities and destinations. Pre-Industrial Revolution Americans would walk between 10,000 and 18,000 steps per day, and high rates of walking and biking to work or school continued throughout the late 60s. Because the street was so widely used by many different forms of transport, it functioned as a public space, a place where children could play as much as cyclists could bike to the store.

Three cyclists travel down a wide path in this black-and-white photo
NYC Parks Photo Archive

When cars began rising in popularity in the 1920s, they entered a space not designed for them, posing a danger to other travelers. The public grew alarmed at rising death tolls and vehicle crashes, calling for reduced vehicle speeds and more protections from the car. Automakers, dealers, and enthusiasts flipped their narrative, advocating for legislation and funding campaigns that sought to regulate and restrict where people could walk and bike.

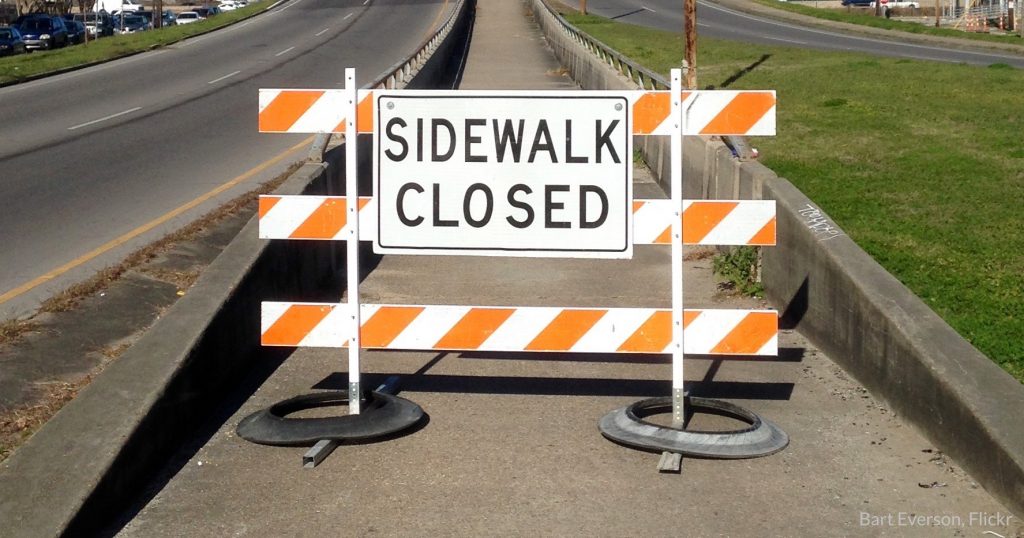
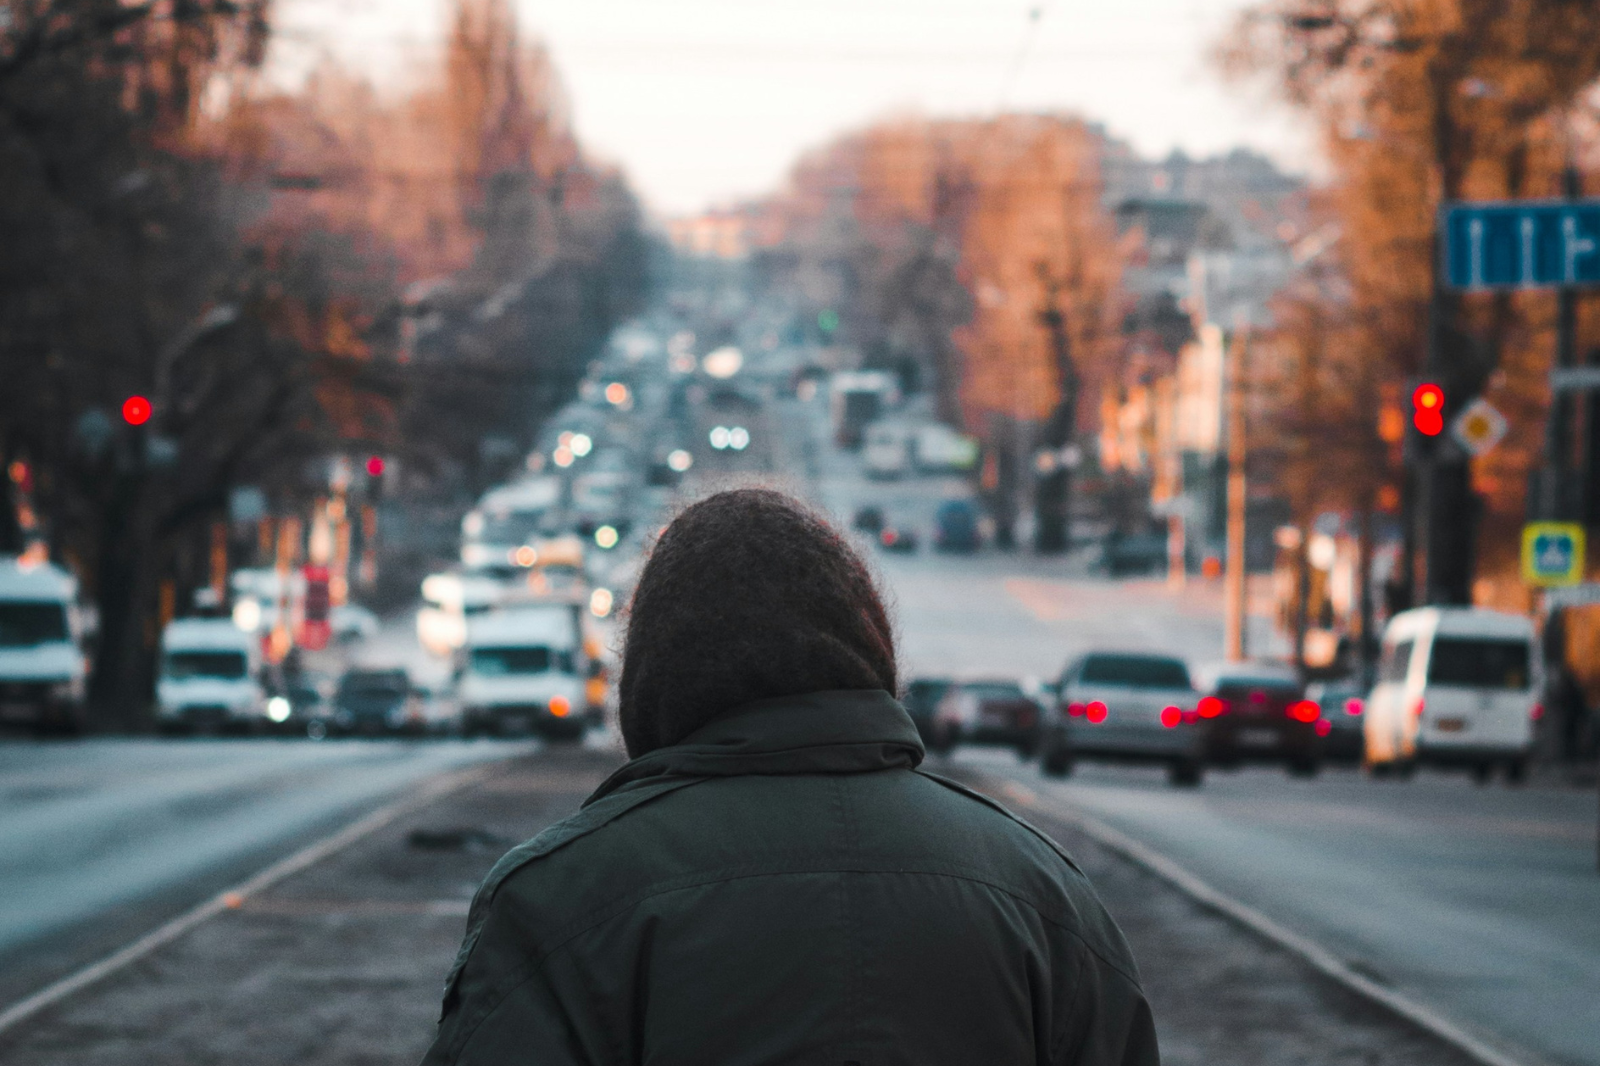
The latter campaign succeeded, but it didn’t make our streets safer. Instead, streets ultimately became a place where quick, convenient car travel is often prioritized over the safety and comfort of all other road users. In 2022, the number of people hit and killed while walking reached a 40-year high.

The illusion of choice

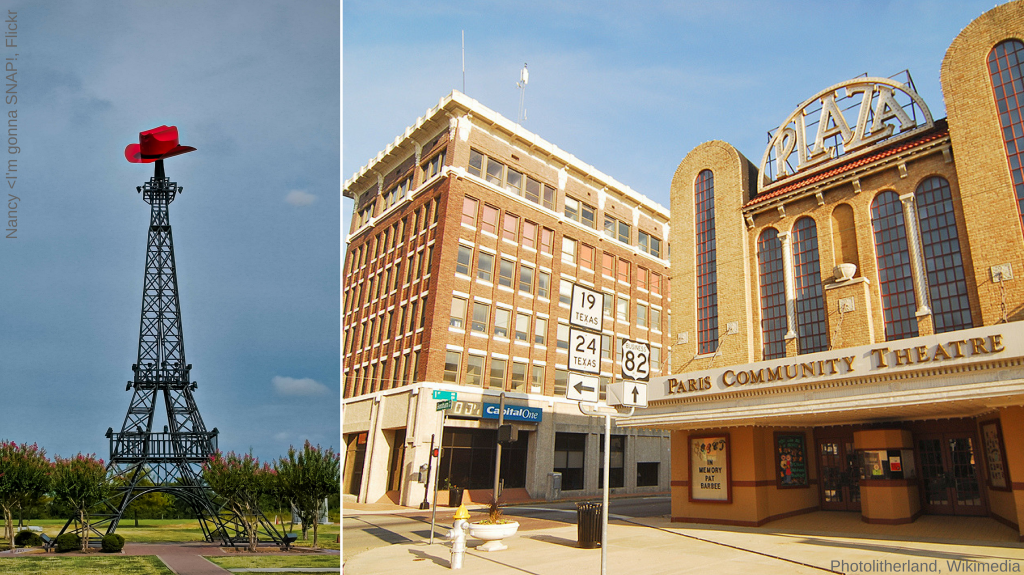
Post-WWII in the United States was a time of world-building, of focusing on creating a brighter future for the country in the aftermath of destruction. The infrastructure that came along with this shift made suburban lifestyles the ideal, and the car a symbol of freedom. A combination of economic incentives and a deprioritization of dense, mixed-use development led to sprawling cities with destinations spread far apart, connected by high-speed roadways.

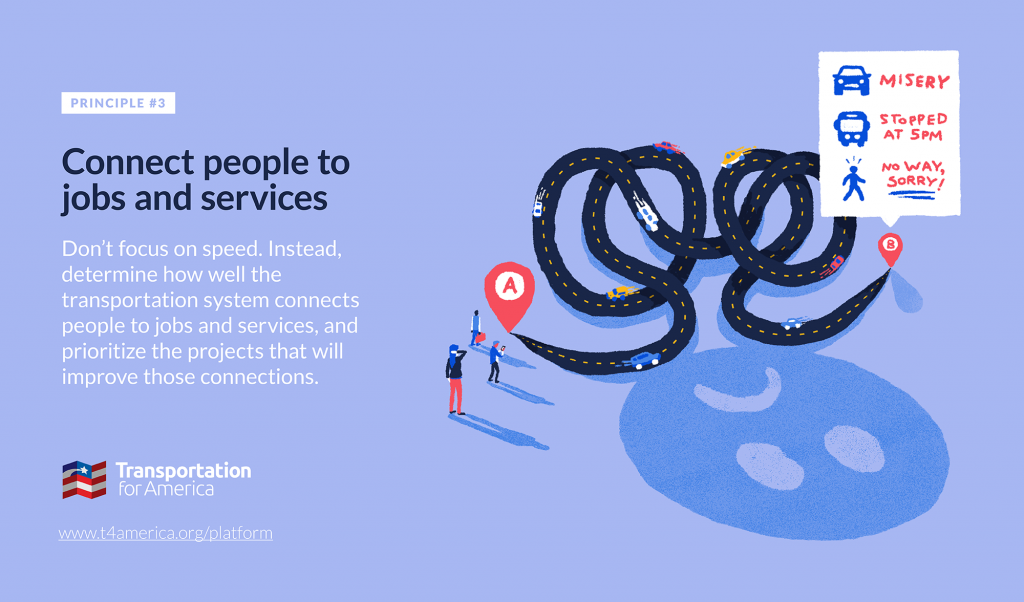
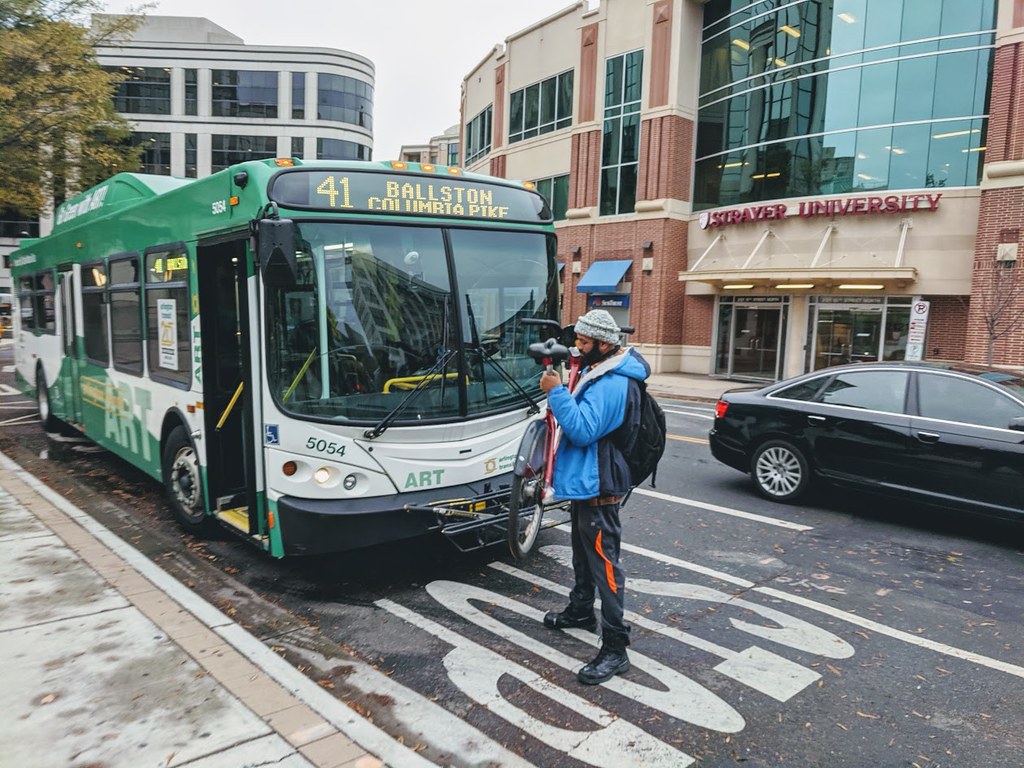
Today, Americans are driving more for the same basic tasks. Research from Transportation for America and Third Way found that households in both rural and urban areas are driving significantly farther per trip as of 2017 than they were in 2001 to accomplish their commutes and daily tasks. Often, driving is the only convenient, safe, and reliable transportation option available, requiring households to shoulder the cost of a vehicle in order to access their daily needs. When people can’t afford regular access to a vehicle, when their car breaks down, or when they otherwise don’t have the ability to drive, they must navigate a transportation system that wasn’t built for them.

A lack of safe transportation options leads to reduced access to economic opportunity, increased risk of being hit by a vehicle, and higher rates of air pollution. These trends are felt by everyone, but they have the harshest impact on low-income communities and communities of color.

We need Complete Streets

Decisions made in the past have left our streets incomplete, prioritizing one way of travel over a wealth of other options. Complete Streets are streets that are safe for all users and that connect community members to the resources they need. This blog is the first installation of a four-part series on the Complete Streets movement. Keep an eye out for our next blog, where we’ll dissect the origins of the Complete Streets movement and what it aims to achieve.

Reducing emissions with better transit, part two: Improve transit access

Increasing funding for transit operations is a vital first step to help more people drive less, but there’s an equally important next step: connecting more people by transit to more of the destinations they currently reach by car.

Bus riders wait at the Silver Spring Transit Center in Silver Spring, MD. Photo by BeyondDC

This post was written by Rayla Bellis, Director of Thriving Communities at Smart Growth America, and Abi Grimminger, T4America Communications Associate. This is the second of a series of posts on this topic—find the full set here.

In our first installment of this series on the importance of transit to reduce emissions, we focused on increasing spending on transit operations—more buses, more trains, running more often (in the 288 urbanized areas with available data.) We found that by increasing federal support for transit operations across these areas, we can make meaningful progress in reducing driving emissions. But while that’s a crucial step in the right direction to meet our climate goals, we also need to consider how to expand access to transit and help more people use transit to get where they need to go.

Pairing expanded transit service with greater access to transit

For a second phase of our analysis of how investing in transit can help meet our climate goals, we looked at what we could achieve by improving transit access—in this case meaning how well transit connects people from their homes to available jobs in their region within a reasonable travel time. Improving transit access goes beyond simply expanding transit service. While offering more routes or more frequent service can certainly improve transit access, it won’t necessarily do so if those routes aren’t designed to connect the places where people live as directly as possible to the places they need to go

In the 288 urbanized areas studied, we examined the annual vehicle miles traveled (VMT) estimates for all 88.5 million households included in the 2017 National Household Travel Survey. We analyzed what share of their regions’ jobs (within 45 minutes from their homes) they could reach with existing transit service using data from the EPA’s Smart Location Database. Unsurprisingly the households that are unable to reach any jobs by transit within that time frame traveled quite a bit by car—averaging 23,090 miles per year.

Households that could get to work using transit drove significantly less, and the improvement came with even modest levels of access to jobs via public transportation. Households that could reach just 10 percent of jobs in their metropolitan area by transit drove 19,040 miles per year (an 18 percent drop). When that access increased modestly up to 10-20 percent of jobs, households drove 17,710 miles per year on average (a 23 percent drop), and when they could reach over 20 percent of all metro-area jobs with transit, average driving in those households dropped to 16,380 miles (or 29 percent less than households with no transit access).

Even improving transit access to connect people to up to 20 percent of metropolitan area (MSA) jobs leads to significant drops in average miles driven per year, reducing emissions. 

Based on those results, we estimate that if we could manage to give all 88.5 million households we studied access to at least 20 percent of their region’s jobs by transit by 2050, we could reduce annual vehicle miles traveled by these households by 23 percent, leading to a total reduction in VMT (including non-household trips like deliveries and ridesharing) in those urbanized areas of 16 percent in 2050 compared to projected VMT based on our current trend. This is 377 billion fewer miles driven annually. Given that transportation emissions are the main perpetrators of greenhouse gas emissions in the U.S., this would be a major step toward improving climate outcomes.

Raising the bar

Providing all households in the 288 urbanized areas we studied with access to at least 20 percent of their region’s jobs by 2050 will require more than simply increasing investment in transit or even just running more trains and buses because of the existing low-density suburban development in many of these regions, which has contributed heavily to VMT growth and emissions in these cities. It will take a real push to make transit-supportive land-use decisions and provide the right transit service to connect people to the destinations they need. But that doesn’t mean it can’t be done. In fact, some urbanized areas are already providing a significant share of their residents with access to at least 20 percent of their regions’ jobs by transit today, raising the bar for communities across the country.

In cities like Champaign, IL, Bloomington, IL, Duluth, MN-WI, and Boulder, CO, more than 70 percent of households can currently reach more than 20 percent of metropolitan-area jobs using transit. Bringing all 288 urbanized areas we studied up to a level of access comparable to those regions by 2050 (in line with the current top 2 percent of cities in the graphic below) would result in an 11.9 percent reduction in  VMT in 2050, compared to what is currently projected for that year. Though a slightly less ambitious target, bringing all 288 urbanized areas up to the level of access provided in the top 5 percent of cities would still have a sizable impact, resulting in a 9.5 percent reduction. That would significantly reduce both emissions and the amount of time Americans spend in their cars on average—a win for the environment and for commuters.

In cities with the best current transit access (those in the top 2 percent), about 70 percent of households can reach more than 20 percent of their jobs by transit.

Bringing all 288 urbanized areas to the level of access provided by the current top-performing regions could reduce annual VMT in 2050 by 11.9 percent compared to currently projected levels for that year.

If we brought all 288 urbanized areas up to a minimum level of transit access to jobs already achieved by the……we could achieve a reduction in annual VMT in 2050 of……meaning a cumulative VMT reduction over 30 years of…
Top 25% of urbanized areas-3.7%-2.0%
Top 10% of urbanized areas-6.5%-3.6%
Top 5% of urbanized areas-9.5%-5.2%
Top 2% of urbanized areas-11.9%-6.5%

Source: Estimated using data on household VMT from the 2017 National Household Travel Survey and data on transit accessibility from the EPA Smart Location Database.

It is important to note that the impacts of poor access to transit aren’t felt equally. People who most need an affordable alternative to car travel are often the same people who don’t have viable transit access. Black workers are four times more likely to take transit than white workers, yet transit access is roughly 24 percent worse in the quartile of urban areas with the most Black residents, compared with those with the fewest. Areas with high poverty rates get less frequent, reliable transit service than wealthy neighborhoods. If we want to face climate goals head-on, we also have to address these inequities in transit access.

But how?

Increasing access to jobs via transit will require an intentional policy and investment strategy, because it depends on several factors beyond just how much we spend on transit: how well transit serves different populations currently, development patterns in the region, and where jobs and services are clustered. And overall, to make the more ambitious scenarios possible, changes in local and metro-area land-use decisions need to go hand-in-hand with the increased transit investment. 

Some cities would need to spend a great deal to significantly improve transit access in the more sprawling portions of their regions if development practices don’t change, which is all the more reason to change those development practices now. Yet scores of cities could likely make meaningful improvements to transit access with very little additional spending. For instance, some cities (like Columbus, OH and Houston, TX) have been able to expand transit access simply by reconsidering the way their routes are structured and reconfiguring their service from the ground up with a focus on improving access. 

To address the pressing need to reduce emissions from transportation to meet ambitious climate goals, we’ll need to not only invest more money overall in running more buses and trains more often, but also consider how to expand that transit service into more places and serve more people—especially those who need it most. More on this in an accompanying report coming in the new year.

Here’s how the new House bill prioritizes getting people where they need to go

It’s surprising, but the current federal transportation program doesn’t actually require that states spend federal funds to improve people’s access to jobs and services. This is why the bulk of transportation funding goes to increasing vehicle speed, a “goal” that fails to help many people get where they need to go. The new transportation proposal from the House of Representatives fixes that with a powerful new performance measure and grant programs. 

The House transportation committee is marking up and voting on the INVEST Act this week. View our amendment tracker here, get real-time updates by following @t4america on Twittervisit our hub for all T4America content about the INVEST Act, and take action by sending a message to your representative if they sit on this House committee.

There’s a reason why Transportation for America’s third principle for transportation policy is to connect people to jobs and services, because instead of measuring transportation success by how many jobs and services people can get to, our current federal transportation policy considers how fast cars can drive on specific segments of road.

Here’s how a new performance measure and grant programs in the House’s five-year INVEST Act would start to focus transportation funding on what counts: getting people where they need to go.

The current approach is broken

To determine if you had a successful trip, you probably think about getting from point A to point B and how long that trip would take. But transportation agencies don’t measure success that way: they instead measure whether or not your vehicle was moving quickly at some point of the trip. Whether or not you actually arrived isn’t measured. This metric of “success” ignores those who can’t or don’t drive, take transit, or are mobility impaired. This doesn’t mean drivers are loving life either though: they may be able to go fast but still feel trapped in their car for too much of the day to get to the things they need. Vehicle speed isn’t a good measure of whether or not people can conveniently access the things they need in their daily lives.

We think it is time to consider how well the transportation system provides access to jobs as well as all other necessities, from the grocery to the bank to school and health care. Access is not only a much better measure, areas with high accessibility allow people to access opportunities and necessities even if they’re not able to afford to drive alone. So this measure captures whether our communities provide equitable access to opportunity, allow for healthy and active living, and contribute less to greenhouse gas (GHG) emissions as well as pollutants that harm public health.

And now, the House Committee on Transportation and Infrastructure brought this important concept into their vision for the future of the nation’s transportation program .

How this game-changing performance measure works

The INVEST Act creates a new performance measure that requires project sponsors to improve access to jobs and services by all modes. While seemingly minor, this marks a huge shift in how transportation funding would be allocated—especially because project sponsors will be penalized if they fail to use federal funding to improve access. The Virginia Department of Transportation has been doing this successfully for years, but this type of performance measure has not been tried across the nation yet and has never been attempted at the federal level before.

Under the INVEST Act, states and MPOs must consider whether people traveling (not just driving) can reach jobs, schools, groceries, medical care and other necessities. And they will be penalized if they fail to use federal funding to improve that access.

New grant programs will also support this approach

The INVEST Act authors know that transportation doesn’t exist in a vacuum: housing plays a huge role in how many jobs and services people can access. Putting housing (and especially attainable housing) close to transit is a powerful way to increase access to jobs and necessities. That’s why the bill requires the Federal Transit Administration to create the Office of Transit-Supportive Communities to provide funding, technical assistance, and coordination of transit and housing projects within the U.S. Department of Transportation and across the federal government. Further, this proposal adds affordable housing into the planning considerations for metropolitan planning organizations (MPOs) and state DOT Transportation Improvement Programs, as well as for future transit capital grants.

The new Community Transportation Investment Program also solidifies the importance of access as a measure of success to the federal transportation program. The INVEST Act authorizes $600 million per year for competitive grants to localities and agencies for projects which improve safety, state of good repair, access to jobs and services, and the environment by reducing greenhouse gas (GHG) emissions. This requires the Secretary of Transportation to develop a system to objectively evaluate projects on program criteria, and develop a rating system which can be used to compare the benefits and costs of each application—as with Virginia’s Smart Scale program.

How these policies will actually improve the transportation system

Measuring access—not vehicle speed—puts transportation projects, regardless of mode, on an even playing field. Technologies like GIS and cloud computing makes it easier for states and MPOs to determine whether their system is connecting people in residential areas to jobs and services by all means of travel. With this information, project sponsors can consider all kinds of transportation projects and all transportation users equally. States and MPOs can also see when it is more cost-efficient to build the things people need closer to them, rather than defaulting to building expensive, new transportation projects to make far away necessities less inconvenient to travel to. With this, we can create more equitable access to economic opportunity, lower transportation costs, and reduce emissions and the damaging climate and health impacts of them.

The federal transportation program as we know it was largely created to increase vehicle speeds across the country, connecting the nation through a network of highways. Now that those highways are built, and we thoroughly understand the consequences of speed—both in terms of loss of life and failure to improve travel times and cost—it’s time to use technology to connect federal funding to the transportation outcomes we need. We’re pleased to support this new performance measure and accompanying grant programs in the INVEST Act.

Here’s what happens when Jarrett Walker takes over your Twitter account

A week ago, we gave the experts at Jarrett Walker + Associates the keys to our Twitter account to explain what a transportation system oriented around improving people’s access to jobs and services (not increasing vehicle speed) actually looks like. 

Last week was “Connecting people to jobs and services week” on our blog, where we focused on explaining our third principle for transportation investment. As we learned when brainstorming ideas for the blog for this week, the concept of measuring transportation success by access, not vehicle speed is often a tricky one for people to wrap their heads around.

So who better to explain how far we’ve deviated from transportation’s purpose—to connect people to opportunity—and how to get back on track than transit planner Jarrett Walker? Walker and his team are famous for communicating the “geometric truth” (as our outreach director Chris Rall calls it) of transit projects, helping cities across the world align their land use with transit goals.

Check out the highlights of the takeover below. And tune into our Twitter account for more takeovers and tweet chats!

Connecting people to jobs and services week: What do destination access metrics look like in action?

Academics have long pointed to a metric called destination access—called by Transportation for America “access to jobs and services”—as a better decision guide than older, conventional measures that focus mainly on the speed of cars.  But what does this new practice look like in real life, and where and how is it already being used?

A man loading a bike onto a bus in Arlington, VA. Photo from the Arlington Department of Environmental Services.

It’s “Connecting people to jobs and services week” here at Transportation for America, so Eric Sundquist, the director of our partner organization the State Smart Transportation Initiative, wrote this blog post explaining how measuring access actually works.

When we measure destination access, which takes into account distance of travel as well as speed, we can better assess how easily travelers can reach their desired destinations. And we can make predictions about how people will choose to travel. It’s long been a better theoretical way to measure success, but the data has been expensive and it’s largely remained the purview of academics.

Now destination access has broken out of the ivory tower. 

Newly available “big data,” much of it collected for use by GPS navigation software and devices—think Apple or Google Maps—has made measuring destination access possible in practice. 

Created by a 2014 bill that “revolutioniz[ed] the way transportation projects are selected,” according to then-Governor Terry McCauliffe, the Virginia DOT has been using destination access to help make investment decisions through three rounds of transportation project funding. 

How does this new system work in Virginia? VDOT assesses a wide range of projects together—highways, transit, walking, biking and demand-management projects—based on how they improve access to jobs and other common destinations, such as shopping, schools, and restaurants. After calculating destination access, VDOT then divides by cost of the project to the state, so that small, rural projects can compete with massive urban ones. In essence VDOT scores projects on destination access per dollar of investment, and this has led to a major shift in which projects they fund each year, increasing the benefits for each dollar invested.

For example, Virginia recently scored a project near the small town of Hopewell that would connect two regional bike-walk trails using a shuttle bus across a highway bridge with minimal shoulders and no sidewalks. The project scored modestly on destination access, but because it would cost only $44,000—very little by transportation infrastructure standards—it ranked first in its district and ninth out of 433 projects statewide. This is the type of small but vital project that can lose out when state agencies are so heavily focused on simply improving vehicle speed and avoiding delay.

Because we can use all this data to assess destination access across auto, transit, walking, biking modes, we can also combine those scores to predict how changes to the built environment will affect outcomes, such as mode share. Will a project lead to more or less driving, transit ridership or active transportation? Using destination access helps us make these forecasts.

More examples of measuring access to jobs and services 

Working with the State Smart Transportation Initiative (SSTI), for example, the City of Eau Claire, WI., recently used destination access to assess transit investment options, including bolstering the city’s downtown circulator, extending service to future development sites, and pairing those investments with strategic transit-oriented development (TOD). The analysis not only let Eau Claire decision-makers understand the relative benefits of different transit expansions—including which residents would be affected and how much their access to jobs and other destinations  would increase—but also showed that TOD could provide considerably larger benefits, compared to transit investments alone. This information will inform the city’s new transit plan and its recently announced climate goals

This new method can be used to evaluate how proposed transportation projects would impact access to jobs and services, but it can also help local leaders envision potential future scenarios as they make broader long-term plans for both transportation and land use. 

In nearby La Crosse, WI, the city leaned on destination access metrics to estimate the effects of various development scenarios. If the city directed new development to three proposed sites near downtown, would it reduce the need for auto travel and boost transit ridership? The SSTI analysis found that the answer was yes, a result that city officials will employ going forward in transportation and land use decision-making. 

Ten years ago, we never would have been able to orient federal transportation spending around the goal of improving access to jobs and services. The data and other resources just weren’t there yet. But now, as both states and localities across the country take giant steps to prove that it’s not only possible but a smarter way to choose where and how to invest in transportation, it’s time for Congress to respond by making this a priority.

To connect people to jobs and services, we need to measure what matters: people

Today we largely decide which transportation projects to build and where to build them based on how much delay vehicles experience, while entirely ignoring everyone not in a car in the first place. By ignoring walking, biking, or taking transit, we’re ignoring the impacts on everyone not using a car, particularly low-income persons, people of color, and older adults.

It’s “Connecting people to jobs and services week” here at Transportation for America. All week we’ll be exploring why improving access should be the goal of the federal transportation program—not vehicle speed.

A century ago, we didn’t have GPS and GIS mapping systems. Google Maps on a handheld computer (i.e. your cell phone) that would allow you to instantly look up directions to anywhere with any mode was still in the realm of science fiction. Given those limitations, when the country started spending billions to build a national network of highways—and a bunch of streets to feed cars onto those highways—the easiest thing to measure was vehicle delay. Free flowing traffic = good; delay = bad. If cars were getting stuck in traffic, it was a sign that we needed to build more or wider roads, or redesign an intersection to improve traffic flow.

This was the most sophisticated proxy for success we could manage for many decades but this myopic focus on vehicle speed also ignored anyone outside a car and it actively undermined other transportation options. People walking or rolling were relegated to sidewalks (if they existed) or banished from the street altogether. Transit was now being mired in traffic and wide, free-flowing roads lured those who could afford a car onto the open road. And if you happened to live in the path of a future freeway—a path often selected because an area was deemed undesirable based on racist redlining policies—your home or business was razed. What remained of formerly walkable and vibrant Black neighborhoods were suddenly cut off from the rest of the community to make room for cars.

None of these people outside of personal vehicles are considered or counted when we use vehicle delay to measure the effectiveness of our entire transportation system. The ability of people walking, rolling, biking, or taking transit to get where they needed to go is sacrificed for people who can afford and operate a car.

This old measure hasn’t scaled very well, either. As more and more Americans began driving, traffic became more common. We hollowed out city centers in a quest to keep cars moving and then give them a place to park. Today, we still hear calls to widen roads to keep traffic moving. The problem, as it’s presented, isn’t that we have too many cars, but not enough road space for all those cars.

With technology available now, we can figure out where people are trying to go, we can measure how easy or hard it is to get there, and we can do this for every mode of transportation, not just cars. We call this measuring access and using it to evaluate how our transportation system is performing and to decide what projects to build next would make for a much more equitable transportation system.

Access to a better future

If you don’t own a car and you rely on walking, biking, or transit, your needs are largely ignored under the current paradigm. If you don’t want to spend $9,000 a year to own and maintain a car, improving your access to jobs and services is secondary to the needs of people driving. If you can’t drive, for whatever reason, you can only hope that there are viable options to get you where you want to go.

Using access as the primary consideration to evaluate projects may show that building and repairing sidewalks in a community would dramatically improve access to jobs and services for more residents than redesigning one intersection for cars (and for the same amount of money). It may show that a new bus line would make it easier for residents in a low-income community to access healthcare. It may show that filling a gap in a bike lane network would improve the ease and safety of reaching the closest grocery store from neighborhoods in a food desert. Or it may show that the length of a bus ride to school could be cut in half with a short connector road. Using access to guide our transportation investments may show these things, but we wouldn’t know because most transportation decisions focus only on the delay of cars alone.

That’s why our third principle for transportation policy is connecting people to jobs and services. Instead of using an outdated proxy that gives us an incomplete and indirect view of whether or not the system is actually working to get people to their destinations, let’s measure the actual thing that proxy was attempting to measure. Congress should direct USDOT and states to determine how well the transportation system connects people to jobs and services, and prioritize projects that will improve those connections.

Measuring access alone won’t erase all the structural issues that disadvantage low-income communities and communities of color, but it will solve one of those issues. By measuring access we can begin to make sure that everyone regardless of income, age, race, or ability can get where they need to go by whatever mode they choose.

A bipartisan effort to help states and metro areas determine if their transportation systems get you there

Providing states and metro areas with powerful data and accessibility tools can help them better measure the destinations that their residents can easily reach, equipping transportation agencies to more effectively plan investments that will help address those gaps.

In late September, Senator Baldwin (D-WI), along with cosponsors Senators Ernst (R-IA), Hatch (R-UT), and Markey (D-MA), introduced bipartisan legislation to provide communities with new state-of-the-art data tools that can be used to better assess how well their transportation networks provide access to jobs and daily needs.

S. 3491, the Connecting Opportunities through Mobility Metrics and Unlocking Transportation Efficiencies (COMMUTE) Act, requires the U.S. Department of Transportation (USDOT) to create a pilot program to provide a handful of states, metropolitan planning organizations, (MPOs) and rural planning organizations with data sets to calculate how many jobs and services (such as schools, medical facilities, banks, and groceries) are accessible by all modes of travel.

These data tools can be revolutionary for communities, enabling them to take a truly holistic view of their transportation networks and make more informed planning and project selection decisions. Why?

As we noted when a similar bill was introduced in the House last year, connecting people to work is arguably the most important goal for our transportation system that we generally do a pretty poor job of measuring. But as important as measuring jobs access is, only 20 percent of all trips and only 30 percent of vehicle miles traveled (VMT) are to and from work. This means that 80 percent of trips (70 percent of VMT) are for our other daily essentials—going to the store, visiting the doctor, dropping the kids off at school, etc.

The incredibly blunt metrics that most planners or communities have access to, like overall traffic congestion and on-time performance for transit, paint a grossly two-dimensional picture of the challenges people face while trying to reach their needs within a reasonable period of time. And these limited measures certainly don’t provide enough information to help these agencies make the hard decisions about what to build to best connect people to the places they need to go.

The use of these simple metrics results in the consideration of simple “solutions,” like adding expensive lanes to existing highways and road networks—costly solutions that often don’t solve the problem, or make it worse.

But today, there are precise new tools available that allow communities to more accurately calculate accessibility to employment opportunities, daily errands, public services, and much more, and then optimize their transportation networks and utilize all modes of transportation. (Like the tools used to evaluate Baltimore’s bus system overhaul, for example.)

But unfortunately, states and MPOs must pay for this more helpful accessibility data while the less useful congestion data is made readily available to them. This bill could start to change that by creating a pilot program that will give a handful of states, metro areas, and rural areas free access to the data, helping them make better use of their limited taxpayer dollars to bring the greatest benefits.

With the introduction of this bill, there are now bipartisan bills in both chambers of Congress to provide better data to local communities. Each bill is sponsored and cosponsored by members who sit on the committees with jurisdiction over the bills. This represents a tremendous step forward and we’re grateful for the bipartisan leadership of Senators Baldwin, Ernst, Hatch, and Markey.

The Paris Metro in small-town Texas

While many people think of public transit as a big city service, transit also serves scores of residents in small towns and rural areas across the country. New transit service in the small city of Paris, TX (pop.  25,000) offers the first reliable public transportation option that residents can use to travel to work, classes, and job training.

Share your rural or small city transit story here


The Ark-Tex Council of Governments Rural Transit District (TRAX) serves a 10-county area in the northeast corner of Texas, including one county in Arkansas, along the border with Oklahoma (about 100 miles northeast of Dallas). Given the vast area TRAX serves, their regional transit service is operated on-demand, with reservations made 24 hours in advance.

Paris, TX—marked with the maroon pin—is in the rural, northeast corner of Texas.

Although this on-demand service provides a vital lifeline for residents making critical trips to reach health care or reach a grocery store, the advance notice required, the limited availability of rides, and small fleet presents some very real limitations on the service’s ability to meet daily and emerging transportation needs.

According to former Paris, TX Councilman Edwin Pickle, city leaders realized that the region’s meager transit options were a barrier for residents, and that they needed to help find a solution.

“We started realizing transportation was a bigger problem because people couldn’t get to their medical needs, couldn’t get to their grocery stores, they couldn’t get anywhere,” Pickle said on T4America’s webinar.

With support from the city and several local partners, TRAX launched new fixed-route bus service running on a regular schedule in 2016. The service consists of four routes in Paris, TX known as the Paris Metro. Buses run hourly between 6:30 a.m. and 6:00 p.m., Monday through Friday.

The Paris Metro logo, which appears on the side of their buses.

The “Paris Metro”

According to TRAX transportation manager Nancy Hoehn, the new routes “have gone a long way towards meeting the community’s needs for jobs access.”

“We have heard from a lot of the social service agencies in Paris that work with a target population of lower-income and transit-dependent people. When they would go to interview in the past and were asked if they had reliable transportation, the answer was no. Well, now the answer can be yes. Just that, in itself, has been huge for the community at large.”

Hoehn credits community involvement during the research and planning stages with developing a bus service that supports all members of the community. Community organizations like New Hope Center of Paris, which works with individuals and families experiencing homelessness, helped the agency identify crucial points of origin and destinations for riders. Now, the Paris Metro stops on the corner directly outside the New Hope facility, giving residents access to medical treatment, social services, and education.

Procuring funding for the new service depended on a combination of public and private partners. Local sponsors include the Paris Regional Medical Center, United Way of Lamar County, Paris Junior College, the City of Paris, The Results Company, Texas Oncology, and local private foundations.

Along with local funding partners, federal funds were critical for launching the service.

“We would not exist if it were not for the federal funds that come through TxDOT,” said Hoehn. “In the local counties we serve, the income levels are low and the counties are strapped just to fund the things they are responsible for. That’s why we’ve tried to be creative with our match money to come from other sources.”

Serving all residents and engaging the community

The Paris Metro was tailored to meet the specific transportation needs of each sponsoring partner.

For example, the Paris Regional Medical Center, the largest employer in the city, is located outside the city center and was previously inaccessible by transit. While dependable transportation was important for employees getting to work, hospital management knew that lack of reliable transportation was also a major impediment to quality health care. Patients discharged from the hospital were often unable to reach necessary follow-up care, like physical therapy, and were winding up back in the hospital as a result. Now, the Paris Metro allows residents to reach scheduled appointments rather than coming in through the emergency room.

Map of the four Paris Metro routes.

The medical center not only made financial contributions to launch the new Paris Metro fixed route service, but also donated office space to manage it. The exterior of this donated space has become a new bus station for the city and is now served by Greyhound and rural transit, as well as the Metro.

Similar adjustments in service were made for other sponsoring partners. Texas Oncology’s patients need door-to-door service, so the route loops through the clinic’s parking lot. The clinic installed a signal light on the street to alert bus drivers when there are riders to pick up. Paris Junior College has students with disabilities who had trouble reaching classes because they lacked reliable transportation to school. To help their students reach classes and other daily needs, TRAX and the college created a discounted semester pass for students subsidized by Pell grant funds. Reliable, affordable transit allows students to enroll.

Fulfilling an unmet need

The new fixed route Paris Metro service has been a success, providing 50,000 rides in its first year. The Texas Transit Association recognized it with an award for “Innovative Project of the Year,” and TRAX is adding larger buses to accommodate the demand for rides.

Greg Wilson, member of the Executive Board of the Lamar County Chamber of Commerce and President of Lamar National Bank, which has branches in Paris, said that the bus service fulfills what was once an unmet need. “The impact of our bus system has exceeded all expectations when it comes to the impact on the local business community. I see people getting off the bus downtown to shop, visit our bank branches, and access medical care.”

For many households the new transit service provides freedom and flexibility, allowing parents to reach a job and giving young adults access to get to summer jobs, after school activities, or other programs. For these households, transit means added stability.

As the Metro enters its third year in operation, the city is looking forward to expanding the service in order to better serve the needs of the community.

Do you work for an operator of a rural transit system? Are you someone who rides it frequently? We want to hear from you.

Share your rural or small city transit story here

A bipartisan move to give states and metro areas access to better data to shape their transportation planning decisions

Congress took a bipartisan step today to provide states and metro areas with powerful data and accessibility tools that will help them better measure the destinations that their residents can easily reach, equipping transportation agencies to plan smarter transportation investments to address those gaps.

Congresswoman Esty (D-CT) — along with cosponsors Congresswoman Comstock (R-VA), Congressman Davis (R-IL), and Congressman Lipinski (D-IL) — introduced a bill this morning (Friday) to provide communities with valuable tools that can help them understand how well their transportation networks provide access to jobs and daily needs.

The Transportation Access & System Connection (TASC) Act would create a Federal Highway Administration (FHWA) pilot program to purchase new, precise data tools for 15 states and metropolitan planning organizations (MPOs) to calculate how many jobs and services (such as schools, medical facilities, banks and groceries) are accessible by all modes of travel. The bill ensures that at least six small communities are included in this pilot via their MPO.

Connecting people to work is arguably the most important goal for our transportation system, yet we generally do a pretty poor job of measuring how successfully our local roads and transit systems performs this base function. But as important as measuring jobs access is, only 20 percent of all trips and only 30 percent of vehicle miles traveled (VMT) are to and from work. This means that 80 percent of trips (70 percent of VMT) are for our other daily essentials — going to the store, shopping, or dropping the kids off at school, etc.

Until recently, transportation agencies could only monitor incredibly blunt metrics, like overall traffic congestion and on-time performance for transit, and while important, these paint a grossly two-dimensional picture of the challenges people face while trying to reach their needs within a reasonable period of time. And these limited measures certainly don’t provide enough information to help these agencies make the hard decisions about what to build to best connect people to the places they need to go.

Too often, the use of simple metrics results in the consideration of simple “solutions,” like adding expensive additional lanes to existing highways and road networks —costly solutions that often don’t solve the problem, or make it worse.

But today, there are precise new tools available that allow communities to more accurately calculate accessibility to employment opportunities, daily errands, public services, and much more. (Similar tools were used to run this analysis of Baltimore’s new bus overhaul, for example.) They allow states and MPOs to analyze a metro area and produce detailed data to help them optimize their transportation networks and utilize all modes of transportation as well as understand the interaction between transportation investments and economic development.

States like Utah, Delaware and Virginia and the cities of Sacramento and Los Angeles are already utilizing this data and seeing results. But unfortunately, states and MPOs must pay for this more helpful accessibility data while the more limited congestion data is made readily available to them. This bill will start to change that by creating a pilot program that will 15 states and MPOs free access to the data, helping them make better use of their limited taxpayer dollars to bring the greatest benefits.

We recognize Representative Esty and her cosponsoring Reps. Barbara Comstock, Rodney Davis, and Dan Lipinski. Let your representatives know that you support this bill – urge them to cosponor the Transportation Access & System Connection (TASC) Act (HR 4241)