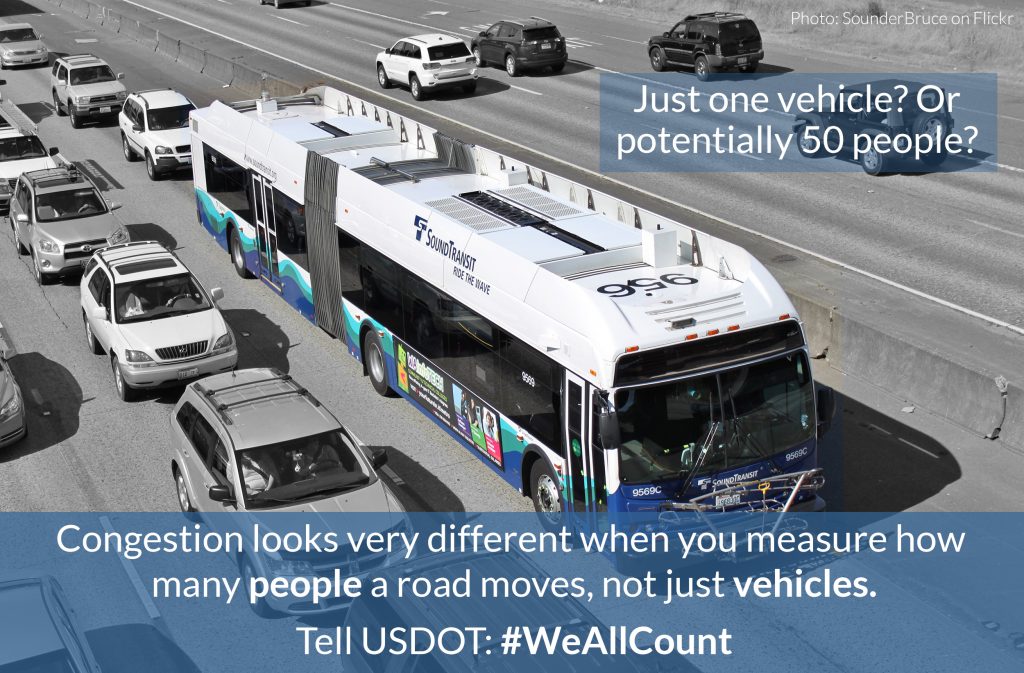
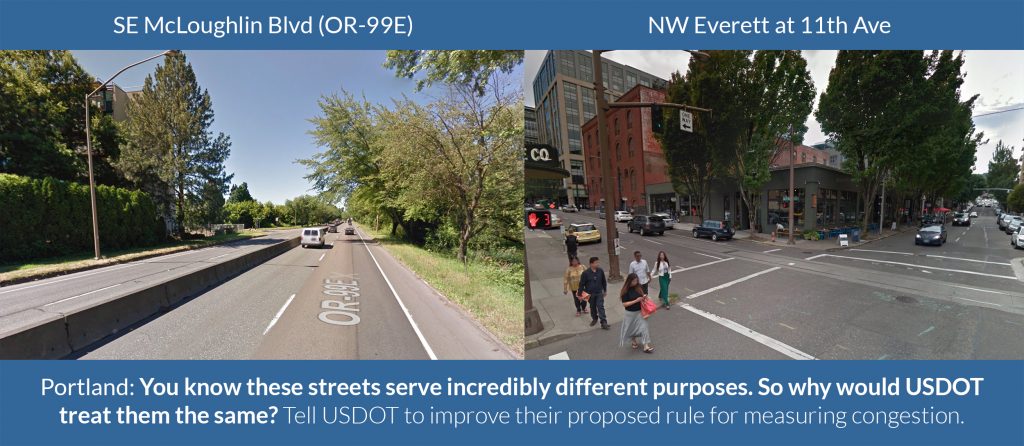
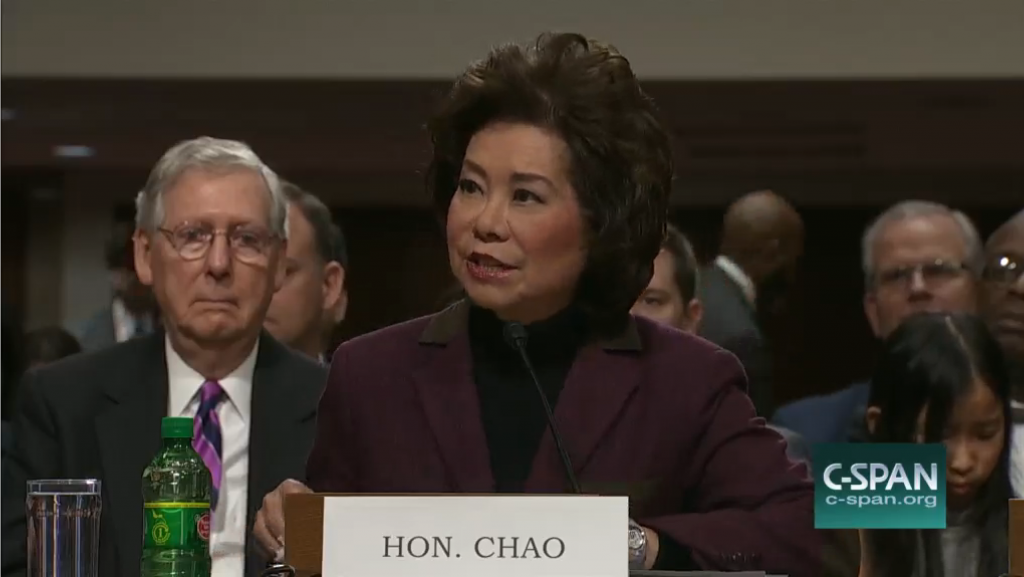
Will Oregon’s DOT change how they do business?

Buttressed by public opinion, a new oversight effort and legislative action, momentum is building in Oregon for increasing transparency and accountability in how the state’s transportation agency does its business.

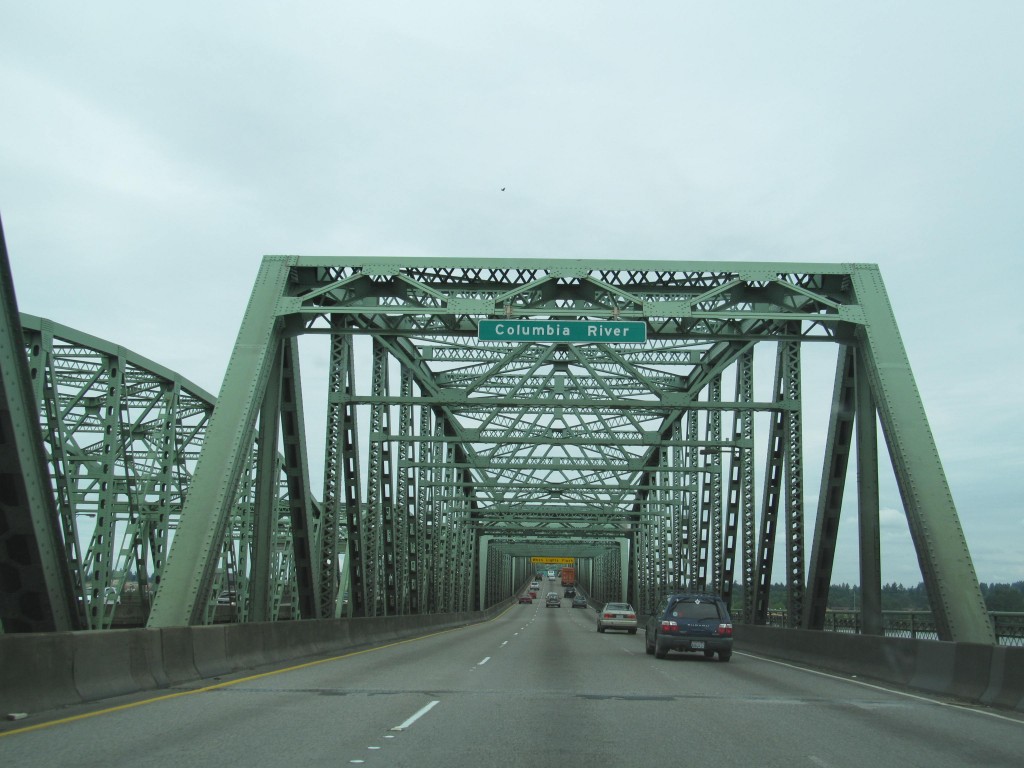
I-5 over the Columbia River in Oregon. Flickr photo by Doug Kerr. httpswww.flickr.com/photos/dougtone/7459949082

Governor Kate Brown and the Oregon legislature have been working for well over a year to restart efforts to raise new state revenues for transportation after a failed attempt in 2015. Two separate special committees have toured the state for listening sessions, and have developed or are in the process of developing proposals for a transportation investment package.

These efforts to raise new funding have put a spotlight on the Oregon Department of Transportation (ODOT). A growing number of legislators, local leaders and members of the public are asking whether or not ODOT’s investment choices are maximizing return on investment, and whether those decisions are made with adequate accountability and transparency.

While the agency is respected for innovative programs like ConnectOregon’s competitive grants and a strong commitment to fix-it-first principles, it has stumbled occasionally as well, including the failure to win support for the problematic Columbia River Crossing mega-project, massive cost overruns on a rural highway project in the landslide-prone coastal mountains, and ill-timed miscalculation of carbon emissions estimates related to failed 2015 transportation investment legislation.

In late 2015 members of the legislature demanded, and the governor commissioned, an audit of ODOT to review the agency’s management structure and oversight.

Just this last week, the Oregon Transportation Commission (OTC), a body of five volunteers appointed by the governor to oversee ODOT, has jumped into the fray. OTC Chair Tammy Baney took the unusual step of sending a formal letter to Governor Brown requesting dedicated independent staff and participation in the agency director’s performance review — to help the OTC fulfill its oversight duties.

This latest move by the OTC coincides with similar efforts in the legislature.

Representative Jeff Reardon (D) has introduced a bill (HB 2532) directing the “Oregon Transportation Commission to adopt rules establishing quantitative system for scoring and ranking transportation projects that are being considered by commission for inclusion in Statewide Transportation Improvement Program.”

Transportation for America has assisted in developing this bill, which draws on programs in Virginia, Massachusetts, Washington State, and others. The legislative session starts this week, and the bill already enjoys support from five other legislators, including top Senate transportation committee Republican Brian Boquist.

With all these efforts to reform ODOT now in motion, this Thursday’s meeting of the new oversight group should be lively. OTC members and meeting attendees will learn about the draft findings from the ODOT audit for the first time — a topic that will almost certainly touch on the accountability and transparency of ODOT’s business decisions.

Introducing “Empty Spaces,” new research about parking requirements for transit-oriented developments

The oversupply of parking around transit — usually at the direction of outdated engineering guidelines — takes up valuable land, raises the cost of development, and misses key opportunities. This new research from Smart Growth America analyzes the amount of parking actually used in five transit-oriented development areas and how it compares to the guidelines that many planners, engineers or developers follow.

The land near transit stations is a valuable commodity. Hundreds or thousands of people travel to and through these places each day, and decisions about what to do with this land have implications for local economies, transit ridership, residents’ access to opportunity, and overall quality of life for everyone in a community.

Many communities choose to dedicate at least some of that land for parking. The question is, how much? Standard engineering guidelines are designed for mostly isolated suburban land uses—not walkable, urban places served by transit. But few alternative guidelines for engineers exist.

Empty Spaces: Real parking needs at five TODs, released today by Smart Growth America, set out to determine how much less parking is required at transit-oriented developments (TODs) and how many fewer vehicle trips are generated than standard industry estimates.

Professor Reid Ewing and his research team at the University of Utah College of Architecture + Planning selected five TODs across the country, each with a slightly different approach to development and parking: Englewood, CO; Wilshire/Vermont in Los Angeles, CA; Fruitvale Transit Village in Oakland, CA; Redmond, WA; and Rhode Island Row in Washington, DC. The research team counted the number of people entering and exiting the TOD buildings, and conducted brief intercept surveys of a sample of them. The team also counted parking inventory and occupancy.

The study found that all five TODs generated fewer vehicle trips than standard guidelines estimate, and used less parking than many regulations require for similar land uses. Most of the TODs included in this study also built less parking than recommended by engineering guides, yet even this reduced amount of parking was not used to capacity: the ratio of demand to actual supply was between 58 and 84 percent. Fewer vehicle trips is one likely reason why parking occupancy rates were lower than expected. Another possible reason is that standard engineering guidelines do not fully account for other travel modes that are available and actively encouraged at TODs.

This was crossposted from Smart Growth America

Join us for the kickoff webinar, today at 1 pm

If you’re reading this before 1 p.m. Eastern on 1/31, join us for a kickoff webinar. You are invited to join us:

Register now


Register for the event to to learn more about the findings and to hear from the report’s author, national policy experts, and planners from two of the cities included in this survey. Developers, regulators, and practitioners are already rethinking how much parking is needed at TOD. This new information can help them make better informed decisions, and ultimately create the development needed most at these in-demand locations.

NOTICE OF FINAL RULEMAKING: Assessing performance on the NHS, freight movement on the interstate system, and the CMAQ program

DATE EFFECTIVE: FEBRUARY 17, 2017

[FEDERAL REGISTER NOTICE, HERE]

Overview

Less than one year after the Federal Highway Administration (FHWA) first proposed outdated measures of congestion (see T4America’s blog post here) and after thousands of our members and partners provided comments, FHWA is now finalizing this rule. Published on January 18, the final rule rolls back some of the redundant, vehicle-focused measures initially proposed in the notice of proposed rulemaking (NPRM) and incorporates some significant changes, many of which we advocated for.

In response to comments from T4A and others, the final rule adds two new measures – a carbon dioxide emissions measure and a multimodal measure. To better reflect the number of people traveling on the system, two of the other proposed measures were modified so they are based on person-travel instead of vehicle travel.

In addition, the faulty measures for percentage of the interstate freight mileage uncongested and Peak Hour Travel Time Reliability (PHTTR) included in the NPRM were both deleted from the final rule. The final rule also simplifies the required data processing and calculation of metrics.

While the final rule is much improved, changes to the speed thresholds for the congestion measure may have some negative impacts on signalized downtown roads with low speed limits.

Background

On the same day that FHWA released this final rule on system performance and congestion, FHWA also released its final rule establishing regulations to assess pavement and bridge conditions. (See T4America summary here). These final rules are the last of several regulations issued to implement the performance management framework established by the recent national transportation authorizations bills, known as MAP-21 and the FAST Act.

In addition to these two rules, FHWA published rules on safety performance measures and the integration of performance management into the Highway Safety Improvement Program (HSIP) in March 2016 and published a rule on asset management plans in October 2016. In May 2016, both FHWA and FTA published a joint rule implementing changes to the planning process.

Together these rulemakings establish regulations for state DOTs and MPOs to evaluate and report on surface transportation performance across the nation.

Final measures

In the draft rule, 7 of the 8 proposed measures were based on vehicle travel time data. Now, only four of the final measures are derived from vehicle travel times, three of which are weighted to reflect all people traveling on the system.

The seven measures established in the final rule include:

  • Three measures of system performance
    • Percentage of reliable person-miles traveled on the Interstate
    • Percentage of reliable person-miles traveled on the non-Interstate NHS
    • Percent change in CO2 emissions from 2017, generated by on-road mobile sources on the NHS
  • A measure for freight movement on the Interstate system
    • Average truck travel time reliability index (TTTR)
  • Three measures to assess the CMAQ program, including two measures on traffic congestion
    • Total emission reductions for applicable criteria pollutants, for non-attainment and maintenance areas
    • Annual hours of peak hour excessive delay per capita
    • Percent of non-single occupancy vehicle (SOV) travel, including travel avoided by telecommuting

Timeline and enforcement

State DOTs will establish their first statewide targets one year after the effective date of this rule, February 17, 2017. MPOs have up to 180 days after state DOTs establish their targets to establish their own targets.

State DOTs must establish both 2-year and 4-year targets. The MPOs are subject only to a 4-year target-setting requirement. MPOs must either: (a) agree to plan and program projects so that the projects contribute toward the accomplishment of the relevant state DOT target for the performance measure, or (b) commit to a quantifiable 4-year target for the performance measure for the MPA. FHWA will assess every 2 years to determine if a state DOT has made significant progress toward achieving their targets.

If States/MPOs fail to meet their targets after 4 years, they have to set new ones for the next 2- and 4-year performance period. If they fail again, there is no real consequence.

Under the new administration, the White House ordered a freeze on the regulatory process. For regulations that have been finished but have not taken effect, the order calls for temporarily postponing their effective date for 60 days or possibly longer. This order could delay the effective date of this rule.

System performance

In the NPRM, FHWA proposed calculating performance on the interstate and non-interstate system by using two metrics: (1) Level of travel time reliability (LOTTR), and (2) Peak hour travel time ratio (PHTTR).

T4America and others expressed concern about the PHTTR measure as a poor measure of performance because it assumes the goal is for roadways to operate in free flow conditions at all times of day – a prohibitively expensive and infeasible goal that can undermine local economic development and multimodal travel. There was already another congestion measure under the CMAQ program and a different reliability measure looking at how consistent travel was from one day to the next. Due to this, we recommended that this measure be vacated, which FHWA did in the final rule..

The final rule also changes the weighting of the travel time reliability measures from system miles to person-miles traveled using overall occupancy factors from national surveys. This prioritizes roadways that move more people through carpooling and transit over roads that only move SOVs.

New CO2 emissions measure

The final rule adds a new emissions measure – percent change in tailpipe CO2 emissions on the NHS from calendar year 2017. This measure applies to the NHS in all states and metropolitan planning areas. All state DOTs and MPOs that have NHS mileage in their state geographic boundaries and MPAs will be required to establish targets and report on progress.

State DOTs will calculate the measure by multiplying motor fuel sales volumes by the FHWA-supplied emissions factors of CO2 per gallon of fuel and percentage VMT on the NHS.

Freight movement on the interstate

The draft rule proposed two measures of freight movement on the interstate: (1) Truck Travel Time Reliability (TTTR), and (2) percent of the interstate system mileage uncongested. T4A and our partners were concerned that the TTTR measure would prioritize freight movement over the movement of people. In response, FHWA removed the TTTR measure from the final rule.

FHWA also changed the form of this measure from one based on the percent of the system providing for reliable travel to an overall average truck reliability index for the Interstate. This change removes the hard threshold in the definition of reliable travel for trucks and recognizes incremental improvements that could be made to improve reliability.

CMAQ program

Three measures are established for the CMAQ program, including total emissions reduction measure and two traffic congestion measures.

Traffic congestion

The NPRM proposed measuring traffic congestion under the CMAQ program by looking at annual hours of excessive delay per capita. As mentioned above, a separate peak hour travel time reliability (PHTTR) measure was also proposed for measuring system performance on the interstate and non-interstate systems. The PHTTR measured percent of the interstate system in large urbanized areas over 1 million in population where peak hour travel times meet expectations. These two measures merge in the final rule creating the Peak Hour Excessive Delay (PHED) measure.

In response to comments, a new multimodal measure – percent of non-SOV travel – was also added in the final rule.

APPLICABILITY

Both the PHED and the multimodal measure adhere to the same applicability requirements. As proposed, the CMAQ congestion measure applied to areas in nonattainment with a population over 1 million. The final rule expands applicability to also include areas with a population over 200,000.

The applicability of both CMAQ traffic congestion measures will be phased in, beginning with urbanized areas with a population over 1 million that contain any part of nonattainment or maintenance areas for one or more air pollutants in the first performance period (2018). It will be expanded to urbanized areas with a population over 200,000 that contain any part of nonattainment or maintenance areas for one or more air pollutants beginning in the second performance period (2022).

The final rule also moves up the date of measure applicability determination to one year earlier than initially proposed. FHWA will determine measure applicability based on the most recent available data on October 1, 2017.

PHED – SPEED THRESHOLD

As proposed in the NPRM, the traffic congestion measure would have established a 35 mph threshold for freeways and a 15 mph threshold for other NHS roadways. In the final rule, FHWA responded to concerns about these static speed thresholds by setting the excessive delay threshold to 60 percent of posted speed limit, with a minimum limit of 20 mph. This may be a slight improvement for measuring excessive delay for expressways, but this same threshold will also apply to non-expressway facilities. Particularly when applied to signalize urban roads marked at 25mph, vehicle speeds might fall below 60% of the speed limit even during free-flow conditions.

In the final rule, FHWA encourages state DOTs and MPOs to share their strategies using volume limiting techniques to address concern when extremely slow speeds exist. FHWA plans to make provisions within HPMS to capture posted speed limit data by adding a field that can be populated for the full extent of the NHS.

PHED – PEOPLE-CENTRIC CHANGES

FHWA agreed with comments that the measure should represent the cumulative delay of all people using the NHS and not just the delay experienced by vehicles. As a result, the PHED measure requires the use of average vehicle occupancy (AVO) factors for cars, buses, and trucks and hourly traffic volumes to calculate person-hours of excessive delay. To support this approach, FHWA will establish AVO factors for applicable urbanized areas using the National Transit Database for buses and national surveys, such as the American Community Survey, for cars. State DOTs and MPOs have the flexibility of choosing to use these AVO factors or substituting more specific AVO data that they may have.

In response to comments, including comments from T4A, the final rule requires the use of annual population estimates using U.S. Census estimates (i.e. most recent ACS 5-year estimates) as opposed to the decennial census populations to normalize the excessive delay measure. The most recent annual population estimate will be used each time the PHED per capita measure is calculated.

PERCENT OF NON-SOV TRAVEL 

This measure includes modes that are in the ACS Journey to Work data, which includes travel avoided by teleworking. State DOTs and MPOs have three options for calculating modal share:

  1. use the ACS Journey to Work mode share data
  2. use locally specific surveys, or
  3. use volume counts for each mode.

FHWA encourages state DOTs and MPOs to report data not currently available in national sources, such as pedestrian or bicycle counts. For state DOTs and MPOs that chose to use count data, FHWA encourages this data to be voluntarily submitted to FHWA via national sources or databases (such as TMAS, NTD, or GTFS-RT).

On-road mobile source emissions

APPLICABILITY

While FHWA acknowledged T4A’s comments, FHWA did not agree that this emissions measure should apply more broadly to include all states or regions that receive CMAQ funds, or to consider all capital and operational opportunities to reduce emissions, not just those that receive CMAQ funding.

The measure is applicable to all states and MPOs with projects financed with funds from the CMAQ program, apportioned to state DOTs for areas designated as non-attainment or maintenance for ozone, carbon monoxide, or particulate matter. FHWA clarified in the final rule that the baseline non-attainment and maintenance area designations should be based on area status as of October 1, 2017.

FHWA narrowed the definition of ‘maintenance area’ to exclude any areas that have completed their 20-year maintenance plan for an applicable pollutant. States and MPOs can also request exclusion from this requirement at the midpoint of the performance period, if their designation changes (i.e. the 20-year maintenance plan is achieved, or the area is no longer designated as non-attainment or maintenance).

While state DOTs and MPOs can still use CMAQ dollars to fund projects where is it not possible or easy to quantify the emissions benefit, these projects will not be accounted for in this performance measure.

METRIC & TARGET ADJUSTMENT

The final rule removes the conversion from kilograms per day emissions data to tons per year data. The final rule calculates total emission reduction as cumulative reductions in emissions over 2 and 4 federal fiscal years.

As in the proposed rule, the final rule allows states or MPOs that believe they would not be able to meet a target due to a change in models to adjust the target at the performance period’s mid-point or explain in their final performance report why they were unable to meet their targets due to model-based emissions estimate.

TIMELINE

Consistent with CMAQ Program Guidance, state DOTs must enter their CMAQ project information for the previous fiscal year into the CMAQ Public Access System by the March 1 deadline. In this rule, FHWA adds a new July 1 deadline, for when all information must be in the CMAQ Public Access System. This due date will apply on July 1 after the final rule is effective.

States and MPOs must use projects in the 4 years prior to the first performance year as a basis for establishing a target for the first performance period. The projects entered into the CMAQ Public Access System during the 2-year and 4-year performance period will be taken as is to calculate the measure.

Additional measures

FHWA notes that state DOTs and MPOs may voluntarily report additional measures beyond their baseline requirement. Additional measures, or variations, could include metrics for per capita emissions, VMT-based estimates, or other useful indicators. Some of the priority outcomes not addressed by the Congressionally mandated measures promulgated by this rule are jobs access, freight movement off the Interstate, public health, stormwater runoff, and household transportation cost.

Review & analysis

FHWA will review this rule after the first performance period to assess effectiveness of the requirements and identify any necessary changes. FHWA also plans to revisit the reliability and congestion measures after the completion of its multimodal research study in Fall 2018.

USDOT made significant improvements in this final rule. However, the ability to set negative targets (e.g., a target of more fatalities) remains an area of concern as does the lack of real accountability for failing to meet any of the self-set targets. This is a flaw in the underlying legislation and not anything FHWA could have addressed in the rulemaking.

Furthermore, the progress made under this rule could be rolled back, if the new Congress overturns this rule under the Congressional Review Act (CRA). At a minimum, the effective date of this rule may be delayed for 60 days. T4America continues to monitor this rule and will provide updates as necessary.
NOTICE OF FINAL RULEMAKING: Assessing pavement and bridge condition for the national highway performance program

DATE EFFECTIVE: FEBRUARY 17, 2017

[FEDERAL REGISTER NOTICE, HERE]

Overview

This rule establishes measures for state departments of transportation (DOTs) to evaluate bridge and pavement condition. These measures are intended to direct states to spend federal-aid funds from the National Highway Performance Program (NHPP) to achieve the performance targets in states’ asset management plans.

Background

On the same day that FHWA released this final rule regarding pavement and bridge conditions, FHWA also released its final rule establishing regulations to assess performance of the NHS and Interstate System, freight movement on the Interstate System, and congestion and mobile source emissions. (See T4America summary here). These final rules are the last of several regulations issued to implement the performance management framework established by the recent national transportation authorizations bills, known as MAP-21 and the FAST Act.

In addition to these two rules, FHWA published rules on safety performance measures and the integration of performance management into the Highway Safety Improvement Program (HSIP) in March 2016 and published a rule on asset management plans in October 2016. In May 2016, both FHWA and FTA published a joint rule implementing changes to the planning process.

Together these rulemakings establish regulations for state DOTs and MPOs to evaluate and report on surface transportation performance across the nation.

Summary of Requirements

State DOTs and MPOs must establish targets for each of the following performance measures:

  • Percentage of pavements on the Interstate System in good condition;
  • Percentage of pavements on the Interstate System in poor condition;
  • Percentage of pavements on the NHS (excluding the Interstate System) in good condition;
  • Percentage of pavements on the NHS (excluding the Interstate System) in poor condition;
  • Percentage of NHS bridges classified as in good condition; and
  • Percentage of NHS bridges classified as in poor condition.

“Good” and “poor” pavement ratings are based on quantitative measures of roughness, cracking, rutting and misalignment of pavement surfaces. Since 2010, most state DOTs have reported roughness, cracking, rutting, and faulting data annually to FHWA through the Highway Performance Monitoring System. Ratings for bridge conditions are based on measures submitted to the National Bridge Inventory (NBI). State DOTs have been required to submit NBI reports to FHWA since 1978. Bridge ratings are based on the lowest component (e.g. deck, superstructure, substructure) rating.

Process

State DOTs must set 2- and 4-year targets for a 4-year performance period for the condition of highways and bridges. State DOTs will establish their first statewide targets in 2018. Each state DOT will submit its established targets in a baseline report at the beginning of the performance period and report progress at the midpoint and end of the performance period. DOTs will be allowed to adjust their 4-year target at the midpoint of the performance period.

MPOs will establish targets by either supporting a state DOT’s statewide target, or defining a target unique to the metropolitan area each time state DOTs establish a target. The MPOs have up to 180 days after state DOTs establish their pavement and bridge condition targets to establish their own targets. MPOs are not required to provide separate reporting to FHWA. However, state DOTs and MPOs must develop a process for coordinating their targets, which will be included in the MPOs’ metropolitan planning agreements or documented in another, mutually determined manner.

Targets and measurement apply to all highways and bridges on the NHS, regardless of ownership. MPO targets will apply to the extent of the metropolitan planning area; state targets apply to the entire state.

State DOTs and MPOs set their own targets; there is no provision in statute for FHWA to review or approve the targets these agencies set.

State DOTs may set additional targets for portions (e.g. urbanized or non-urbanized areas) of the state.

State DOTs must submit the following reports to FHWA:

  • Baseline performance reports, due October 1, 2018 and every four years thereafter, will include baseline conditions and 2- and 4-year performance targets.
  • Mid performance period progress reports must be submitted three years into the four-year performance period (to address the first two years of the period). This report will include the actual condition, progress toward performance targets, target adjustments, any extenuating circumstances that prevent the state from achieving its targets, and a description of the actions to be taken to meet the targets.
  • Full performance period progress reports, due one year following the end of the referenced period, will include actual condition, four-year progress toward targets, any extenuating circumstances that prevent the state from achieving its targets, and a description of the actions to be taken to meet the targets

The report timeline is summarized in the Figure 1 below.

MPOs must report their targets, baseline conditions, and progress toward targets to their states’ DOTs in a mutually agreed upon manner.

FHWA will determine states’ progress toward their targets after receipt of the mid- and full-performance period progress reports. FHWA will determine that a State DOT has made significant progress toward the achievement of each 2-year or 4-year NHPP target if either:

  • The actual condition/performance level is better than the baseline condition/performance; or
  • The actual condition/performance level is equal to or better than the established target.

State DOTs that fail to meet or make significant progress toward meeting pavement and bridge condition performance targets in a biennial performance reporting period will be required to document the actions they will undertake to achieve their targets in their next biennial performance report.

Additionally, this rule sets minimum standards for Interstate highway pavement condition and bridge condition. These thresholds are not more than 5 percent of Interstate pavement in poor condition and not more than 10 percent of bridge deck area rated structurally deficient. FHWA will annually determine if these conditions are met.

If a minimum pavement condition on the Interstate is not met the state DOT must set aside an amount equal to the state’s 2009 federal apportionment for the pre-MAP-21 Interstate Maintenance program. However, in some cases this amount of funding may be less than the state is already spending on Interstate maintenance and less that is necessary to fix the problem.

If the minimum bridge condition is found to have not been met for the previous three year period the state DOT must set aside and amount equal to the state’s 2009 federal apportionment for the pre-MAP-21 bridge maintenance program. This set-aside requirement remains in effect for each subsequent year until less than 10 percent of the total deck area of bridges in the state on the NHS is classified as structurally deficient. However, in some cases this amount of funding may be less than the state is already spending on bridge repairs and less that is necessary to fix the problem.

Changes from the proposed rule

Two changes were made to comport with new statutory provisions from the FAST Act.

The proposed rule required a state DOT to document how it would meet its performance targets if it failed to meet these targets over two, consecutive biennial reports. The final rule requires a report on corrective action if a state DOT does not make significant progress in a single biennial performance report.

Similarly, under the final rule, FHWA will impose a requirement for additional repair spending if the state’s Interstate pavement condition has fallen below the minimum condition level for the most recent year (instead of most recent 2 years).

The final rule makes several technical adjustments to the way particular measures are calculated and revises certain thresholds.

T4America critiqued the provision of this rule that allows state DOTs to adjust their 4-year performance targets when they submit their two-year, mid-period progress report. Especially considering that states already set their own targets, allowing states to change their targets halfway through the performance period when they see their results lagging undermines the accountability of performance management system. However, several DOTs commented requesting more flexibility to revise their targets. In the final rule FHWA did not change the provision and allows for state DOTs to reset their targets in the mid-period report. The final rule additionally adds a provision that state DOTs must coordinate with MPOs before adjusting performance targets.

T4America also urged changes to the rule to assign state DOTs and MPOs equal responsibilities in setting targets. This final rule, however, makes requirements primarily of states while encouraging coordination with MPOs.

Review

FHWA will review this rule after the first performance period to assess the effectiveness of the requirements to identify any necessary changes.

Stories You May Have Missed – Week of January 23rd

Stories You May Have Missed

As a valued member, Transportation for America is dedicated to providing you pertinent information. This includes news articles to inform your work. Check out a list of stories you may have missed last week.

  • Senate Commerce Committee approves Elaine Chao’s nomination for U.S. DOT Secretary. Senate floor vote expected Tuesday, January 31st. (Politico)
  • Senate Democrats propose a $1 trillion infrastructure plan in a move to start negotiations with President Trump over an infrastructure bill. (Washington Post)
  • Transportation for America releases a statement on Wednesday about the introduction of the Senate Democrats infrastructure plan. (Transportation for America)
  • Business travelers now use Uber more than taxis and rental cars, a stark change from just a year ago. (Bloomberg)
  • PeopleforBikes launch a new initiative to help 10 cities double bike ridership over three years. (PeopleforBikes)


Options for all: Serving the elderly and disabled with shared-use mobility

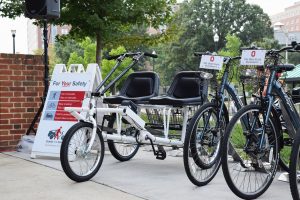
Transportation network companies (TNCs) like Uber and Lyft and bike-share providers like Zagster can improve options and expand accessibility. Can they support vulnerable populations and smaller markets? Transportation for America attended the Shared Use Mobility Summit to learn more. (This is part one of a two-part series.)

PC: Marin County Media

In the United States, individuals miss over 3.6 million medical appointments every year due to lack of transportation, according to a 2013 article in the Journal of Community Health. And according to the Kessler Foundation, access for people with disabilities has not improved since 1998; it’s actually getting harder to get around. This has a disproportionate impact on vulnerable populations.

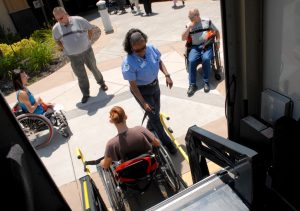
Senior shuttles and paratransit fill some of these gaps in access, which are growing unfortunately, but they are often limited in the populations, destinations and hours that they serve. These services can be expensive for providers, and inconvenient for customers, who often need to order a ride 24-48 hours in advance.

In towns, cities and places of all sizes, questions are emerging about the role of new mobility providers like Uber, Lyft and other TNCs in filling these gaps and becoming part of how we ensure mobility for these groups of people. What would it look like? What are the concerns that cities need to be aware of as they think about using any of them to help meet their needs?

The Centennial pilot

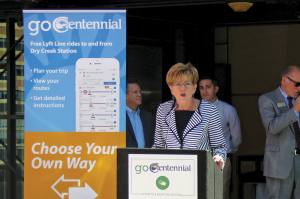
Centennial, CO, a suburb 13 miles south of Denver, has a fairly typical first- and last-mile problem; its Denver Regional Transportation Authority light rail station is far away from its residential, retail, and job centers. Cost and hour-plus wait times have made its dial-a-ride service unappealing. But in August of 2016, the city partnered with ride-hailing service Lyft to launch a six-month pilot program in an effort to change that. (Centennial is also one of the 17 cities in our Smart Cities Collaborative, and we heard a great deal about these efforts during our inaugural meeting back in November.)

The Go Centennial pilot allows residents to catch a free (subsidized by the city) Lyft ride to or from the light rail station. A local paratransit company has also joined the Lyft platform with accessible vehicles to enhance service. And to help serve people who would prefer to call for a ride rather than using a smartphone application, the city has partnered with a developer to create a web application that the city can use to dispatch rides to those customers.

PC: Peter Jones, Villager Publishing

For Centennial, the project has so far been a fiscal success: total project costs for the city have been about half of subsidizing the previous dial-a-ride service.

“Public-private partnerships with aging, disability, and other groups have become a growing mandate as we come to realize how much we have in common,” says Andrew Salzberg, head of Transportation Policy and Research at Uber. Uber is currently partnering with 20 cities to provide wheelchair accessible vehicles & lease them to drivers. Many cities have joined Centennial in subsidizing TNC services to supplement paratransit service.

A pioneering transit agency

Some cities are working to get ahead of the curve by developing their own solutions. Kansas City, Missouri partnered with Bridj to pilot an app-based, on-demand shuttle service in select areas of the city to make it easier for people to get around.

“We have to look beyond traditional transit, even reinvent what transit agencies are,” says Robbie Makinen, president & CEO of the Kansas City Area Transportation Authority (KCATA), showing a remarkable amount of foresight to think outside the conventional work of a transit agency. “As we explore new mobility options the opportunity to partner with the private sector is tremendous.” he says.

PC: Daily Republic

This winter, the KCATA will launch an on-demand paratransit service called RideKC Freedom. “RideKC Freedom is going to start with the paratransit piece and build out, which is the opposite of what typically happens,” he says. While many transportation systems offer paratransit as a supplementary service, the goal of RideKC Freedom is to begin as a paratransit service before eventually expanding as a shuttle service intended for all users.

Makinen believes that for too many years, the most vulnerable riders have been left to navigate a transportation system that limits their ability to access opportunities. “We will leverage our private sector partnerships to reduce per trip paratransit costs, and then expand RideKC Freedom into serving the broader retail market, he says.” This business model is designed to eliminate social stigmatism associated with using paratransit service, and create a new funding stream.

Service for seniors

Based in San Francisco, CA one company fills a special niche. SilverRide provides call-ahead, escorted rides for senior citizens or anyone who needs additional help due to physical or cognitive challenges. Drivers receive extra training from the company on how to handle common medical conditions and provide physical assistance. The service also provides notes about any special help passengers may need.

“Seniors and those with disabilities tend to need more hand-holding than the general public,” says SilverRide CEO Jeff Maltz. That’s why passengers receive personalized customer care and frequent reminders about their scheduled rides. And the escort aspect ensures those who need door-through-door assistance can use the service.

SilverRide comes at a slightly higher price tag, which Maltz says is the necessary to provide a resource tailored to serve populations with different needs.

“Any service that offers the extra assistance to accommodate folks who have special needs has added cost to accommodate the extra need.  We have removed as much cost as possible by offering a TNC-plus model that can plug into any system in a variety of ways to make sure the needs of all riders are met.” He notes that a one-size-fits-all approach has traditionally led to poorer service and higher costs, and argues that tailored solutions combined with technology and improved regulations are a better approach.

PC: Ride Connection

Designing for the elderly and people with disabilities is important in all systems, notes Sarah Rienhoff. Rienhoff is the public sector lead at Via, another TNC. Her perspective is informed by her past experience working at the global design and innovation firm IDEO. “We should aim to design for inclusivity, looking at ‘extreme’ users, the elderly in this case, to guide our work,” she says.

Rienhoff explains, “When designers take on a problem, they spend time in the edges of the bell curve, with the extremes. By designing for people that most acutely experience the positives or negatives of a product or service, you can also benefit the middle, people who likely experience those same positives or negatives, but to a lesser degree. Rienhoff argues that this is something that many of our transit agencies already do well. “They think about designing services to be universally accessible,” she says.

Maltz agrees it is wise to take best practices from each tailored solution and incorporate those across the board where improvements can be made.  he says. And Jana Lynott, senior policy advisor for AARP’s Public Policy Institute, reconciles, “While public transportation should be designed to serve the needs of everyone, there may be cases where older adults are too frail or suffer from dementia where it would not be safe for them to use fixed route public transit on their own.”

Services like SilverRide and Via, when licensed to a transit provider, can serve an important niche. “We also need to design for caregivers,” she says. “They want to be able to schedule rides remotely and track that progress as well.”

Rural coverage

As TNCs grow into smaller cities and suburban markets, options for rural regions lag behind. Uber, for example, considers regions just under 100,000 in population its smallest market.

PC: Zagster

Lynott notes that more services are coming online in rural areas. The national franchise ITN America is the nation’s largest provider of transportation for seniors, providing demand-response service, and more recently Liberty Mobility Now has launched a ride-sharing service intended to compliment the existing transportation in rural communities and provide gap coverage.


As more services come online, it is clear that the market is adapting. But what challenges does that present? And can the public sector and local stakeholders keep up? In our next post, we’ll take a closer look at some of the issues these new TNCs pose. We’ll also review how the bike-share market is responding to different market considerations.

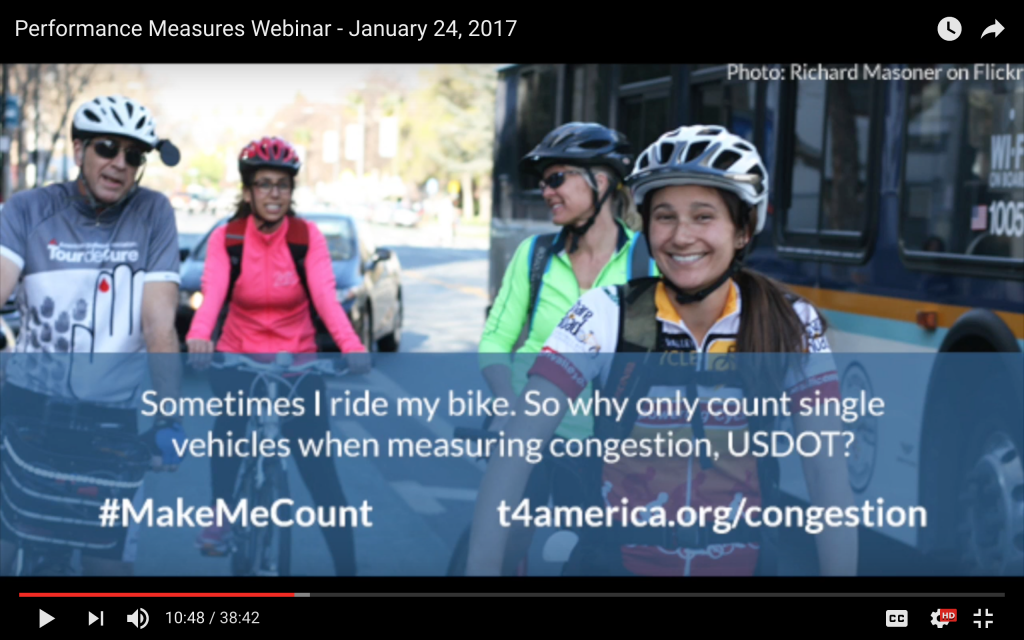
Unpacking the final suite of new USDOT performance measures [video]

The new requirements released last week by USDOT for how states and metro areas will have to measure traffic congestion were just part of a larger package of all-new performance measures. Catch up on what you need to know about them with our detailed webinar unpacking all of it.

Many thanks to our Beth Osborne for sharing her knowledge and wisdom about performance measures with us on this helpful session. FHWA was unable to participate due to the regulatory freeze now in place preventing federal agencies from communicating further about any new regulations in process or not yet completely finalized, but we were able to roll on ahead. (2:20)

The 2012 transportation law (MAP-21) required transportation agencies to begin using a new system of performance measures to govern how federal dollars are spent. USDOT’s final rule for measuring traffic congestion was just one part of a much larger package of new performance measures, including measures for safety, the state of repair, congestion, air emissions and other aspects of our transportation system. (4:00)

On this webinar, we walked through the last of three final rules that cover road, bridge and pavement condition, and overall system performance. We discussed what’s missing in the new measures (8:00), what changes we asked for along the way (10:30), what comprises the final package of rules (15:20), the changes made to the final package (18:05), the dates that states and metro areas will need to be aware of over the next year (18:50), some other helpful resources from T4America and others (20:20) and answered a handful of really smart questions from those who participated (24:00).

More about performance measures

Maryland’s governor is fighting a more objective process for choosing transportation projects

While other states and regions across the country are using new tools to evaluate potential transportation projects and pick the ones that offer the best return for taxpayer money, Maryland Governor Hogan and his administration are staunchly opposing similar new policies that add accountability and transparency to that process.

Many Americans find the byzantine nature of transportation decisions confusing, making them less willing to hand over more of their hard-earned tax dollars to increase investments in transportation — but who can blame them?

The public wants to know the answers to questions like: “Will these dollars give us better, safe, reliable, affordable access to necessities like jobs, education, health care, and groceries?” Measuring what transportation dollars are buying, in a clear way that matters to the public, is critical for restoring this trust — as well as for getting the most bang for the buck.

This was why Maryland legislators in 2016 crafted a new law to measure and score transportation projects based on state goals, helping to program (i.e. spend) scarce transportation dollars more objectively. The legislation in question requires the state department of transportation to objectively evaluate potential projects based on their impacts in categories like economic development, safety, community vitality, and accessibility.

The Governor vetoed the bill, but the legislature overrode that veto and passed it in 2016. And now, as Maryland starts their 2017 legislative session, Governor Larry Hogan (R) has declared his number one legislative priority to be the repeal of this legislation. Last week a repeal bill was introduced.

Marylanders: Tell your state reps to defend transparency and accountability in transportation projects.

The governor is demanding a repeal of the law that created this new objective scoring system so he can preserve the opaque, politically driven process where projects are picked based on horse trades and political influence, not on need or expected benefits.

TAKE ACTION

In attacking what he calls the “road kill bill” and warning of “catastrophic” consequences, Gov. Hogan has exaggerated and incorrectly stated the provisions of the law. While the Governor said the law would “absolutely be responsible for the elimination of nearly all of the most important transportation priorities in every single jurisdiction all across the state,” the law explicitly gives the administration the power to fund any necessary project.

Del. Brooke Lierman (D-Baltimore, pictured below), who championed the project scoring legislation last year, was astonished by the Governor’s sweeping opposition.“It’s just a score, and that shows to us, the taxpayers, how we’re spending our money in a transparent way,” she told the Baltimore Sun. “I don’t know why the governor is so opposed to transparency in transportation funding.”

Delegate Brooke Lierman, right, one of the sponsors of the original legislation, explaining the mechanics of the bill to others at our Capital Ideas conference.

In recent years, several other states under Democrat or Republican control alike, have adopted similar scoring systems to clearly evaluate projects and communicate to taxpayers that the state is making sound investments. For example, in the past year Virginia and Massachusetts have each employed new project scores to build their state transportation plans.

Yet rather than follow these well-functioning models, the administration released a clumsy set of measures to implement the legislation.

Virginia’s DOT went all-in on the new process their legislature created, producing a new website and a 90-page step-by step guide to their process. In contrast, the Maryland DOT’s regulations run just a page and a half and offer no explanation for the basis for scores and weights. While Gov. Hogan has erroneously claimed that the new law would require that state to cancel dozens of planned projects, under the law the scoring process is only advisory — it just provides a new way for lawmakers and citizens alike to see which projects are being advanced and compare the relative merits of each.

Maryland’s taxpayers deserve transparent and objective scores that would let them understand state spending and need. Instead they have gotten a cynical, straw man argument, in which the governor has painted a sensible, good-governance reform as the “road kill bill.”

The Maryland General Assembly should not repeal this important new policy and the administration should use the flexibility in the law to develop a scoring process that matches the state’s need. We’ll be keeping our eyes on the developments down the road in Annapolis.

Greater federal investment in infrastructure welcomed, but must be paired with increases in accountability and transparency

press release

FOR IMMEDIATE RELEASE

After the release of the Senate Democrats’ $1 trillion infrastructure proposal, Beth Osborne, Senior Policy Advisor for Transportation for America, released this statement:

“It’s encouraging to see the Democrats in the Senate respond to President Trump’s charge to beef up America’s investment in infrastructure spending by advancing their own proposal that is multimodal, increases competitive funding, and provides more money for main streets across the country.

“But funding alone will not truly solve the complex problems facing our country’s transportation networks. We increased federal transportation spending year-over-year for at least two decades, yet we still ended up in this situation today with growing backlogs of repair needs, increasing fatalities on our roads, and residents with fewer access to jobs and opportunities than before.

“We do need more infrastructure investment, but we also need that investment to be transparent, accountable and bring the greatest benefits for each dollar spent. This proposal does not specify how the funding would be distributed or how transportation agencies would be held accountable for actually bringing their roads, bridges or transit systems into a state of good repair. How can taxpayers be certain that we wouldn’t just continue a long pattern of neglecting our growing repair needs while building yet more things that come with additional years of maintenance costs?

“That said there are some notable positives worth highlighting in the proposal.

“This proposal directs more than $100 billion directly into the hands of local governments to invest in their priority projects — a move worth applauding. Local leaders in cities and towns of all sizes are the ones who know their specific needs best, but they’re often not even at the table when decisions are made in state offices about where and how to invest. The innovative competitive TIGER grant program — one of the few sources that locals can access directly — doubles to at least $1 billion per year.

“Allocating $200 billion to ‘Vital Infrastructure Projects’ correctly recognizes that we have scores of large projects that are often mega-regional in scope, with significant benefits for the national economy. But it also raises several important questions: who determines which projects to fund? Is this a return of congressional earmarking? Will the most cost-effective large projects be selected, or the projects with the greatest political heft?

“The elephant in the room is the funding source for this ambitious package. Congressional leaders used every accounting maneuver in the book to avoid dealing with our nation’s bankrupt highway trust fund in order to pass a five-year transportation authorization that didn’t cut spending back in 2015. How do they propose to pay for this ambitious investment package?

“Without addressing that difficult question head-on, it’s challenging to fully assess this proposal.”

A highly cooperative spirit is taking root within the 16 cities in the Smart Cities Collaborative

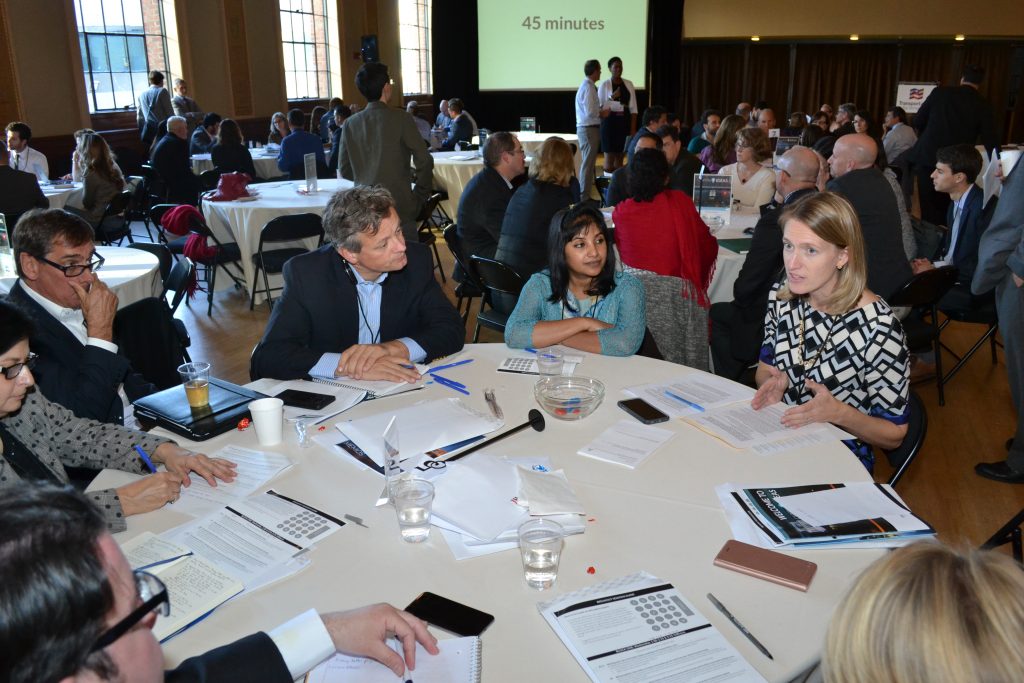
Just a few blocks from the Capitol dome in Washington, DC, the 16 members of our Smart City Collaborative gathered together again two weeks ago to learn, share wisdom and find ways to collaborate on thoughtfully solving their transportation challenges with new and emerging technologies.

During the last in-person meeting in Minneapolis on the day after the election, we spent a good chunk of the time trying to help the cities back out a bit from the minutia of day-to-day, specific problems like, “which payment vendor should I use for X?” and “What technology do you use for Y?” and think more about the big picture problems they’re trying to solve. Existential questions like, “what kind of city do we want to be in ten years? How can technology help us get there?”

With the answers to those big picture questions firmly in mind and a spirit of collaboration already bearing fruit, we focused on three things during our second two-day meeting: Going in-depth on key issues with notable experts, discussing the action plans for the cities’ specific pilot projects, and a working session on specifically how to measure and quantify success.

One of the highlights of the first day was a terrific discussion about equity and accessibility in our changing digital world. The superb panel, led by Shin-pei Tsay from the Gehl Institute, discussed how technology is rapidly changing equity, accessibility and access to economic opportunity in cities — with an eye toward how Collaborative members can ensure that their projects help solve these challenges, rather than contributing further to the problem.

The first day’s panel discussion on how technology is transforming access to opportunities, with a focus on equity.  From left, Shin-pei Tsay, Executive Director of the Gehl Institute, Anita Cozart, Senior Director at PolicyLink, Tatiana Peralta-Quirós, Transport Economist at the World Bank and Rani Narula-Woods, California Program Manager for the Shared-Use Mobility Center.

Members got to hear directly from those involved with other interesting pilot projects elsewhere, like Pittsburgh’s self-driving Uber pilot, driverless shuttles in Contra Costa County, and on-demand transit projects in Oakland, CA and Salem, OR.

We brought in over a dozen outside experts with deep knowledge on issues like performance measurement, data-sharing between cities and transportation network companies (TNCs like Uber and Lyft), modular contracting and flexible procurement, to name a few. City reps participated in intimate, small group discussions where they could ask questions and try to fill gaps in their knowledge.

Gabe Klein with CityFi, formerly the director of Chicago and DC’s transportation departments, walked a group through his experiences in procurement.

Within the three working groups that we created based on what the applying cities were most interested in —automated vehicles, shared mobility and data analytics — a key goal of the year-long collaborative is for each city to launch a pilot project. But how should cities measure and quantify the success or failure of these projects that they’re hoping to get off the ground? For example, for a city that’s trying to run a small, automated vehicle pilot project, what should they be measuring? And what data points can actually be measured?

Doing real-time voting on some proposed metrics for measuring the performance of the cities’ pilot projects.

These are tough nuts to crack, but we all made progress at finding answers — all while trying to keep our eyes on how these pilot projects can help cities get ever closer to their answer to the “what kind of city do we want to be in ten years?” question.

One of the most illuminating comments we heard from a participant was that the Collaborative is creating the opportunity to get out of the day-to-day — where they may have scores of other unrelated responsibilities — to come together with like-minded peers to think long and hard about this one topic or their pilot project in a focused way.

With so much uncertainty right now with regards to federal transportation policy under a new administration and a new Secretary of Transportation, cities will be best served by working together to solve these challenges and avoid producing a new generation of transportation haves and have-nots.

It’s been an incredibly productive few months so far, and we’re eager to see what continues to come out of these cities as they work to ensure that this monumental, epochal shift in transportation is harnessed to shape their cities into places that are more sustainable, equitable and accessible.

The Smart Cities Collaborative is supported by Sidewalk Labs.

What You (May Have) Missed Last Week

News Articles You (May Have) Missed Last Week 

  • President Trump’s first proposed budget may include the entire elimination of federal support for transit. (Streetsblog USA).
  • Vice President Mike Pence reiterated that President Trump is planning a “big” infrastructure bill as one of his presidential priorities. (The Hill)
  • Transportation engineers are the people that design the streets and communities that we  live in. So shouldn’t their lingo match how we talk? Unfortunately, many of the terms and definitions used in the transportation engineering are stuck in the 1950’s and out of date. Here are eight “euphemisms” that should go. (Streetsblog USA)
  • Tennessee may be the next state to join the recent trend of states raising much needed transportation funding. Governor Bill Haslem of Tennessee has proposed a plan to raise the gas tax by 7 cents and allow local jurisdictions like Nashville to collect additional sales taxes to meet transit needs. (Nashville Public Radio)
  • Deep red South Carolina may also join Tennessee too. South Carolina Republican leaders last week introduced a proposal to raise South Carolina’s gas tax, which is the second lowest in the nation. Their plan would raise the current 16.75-cent-a-gallon gas tax by 10 cents over five years, thereby generating $600 million more a year to help repair bridges and roads. (The State)
  • The first privately run and operated rail service in 100 years is getting closer to launch. Officials with All Aboard Florida showed off their new train sets for the Brightline service, which will run from Miami to Orlando. (USA Today)
  • Do you hate traffic? Well now, Logan Green and John Zimmer, the co-founders of Lyft, have a controversial idea for ending traffic. They want to encourage more people to carpool by charging a fee to those who don’t. (The Verge)


Get to know our new arts and culture outreach associate

Smart Growth America and Transportation for America are pleased to announce the hiring of Mallory Nezam as an arts and culture outreach associate, assisting our efforts to help communities across the country integrate arts, culture and creative placemaking into neighborhood revitalization, equitable development and transportation planning efforts.

For the last few years, Mallory has been working in digital marketing, focusing on content strategy, account management, copywriting, and guerrilla marketing. Simultaneously, she has been operating as both a public artist and cultural organizer in community-based and social practice art, which utilizes art to engage pressing social issues in communities. One interesting project of hers worth highlighting here is Mirror Casket, a “visual structure, performance, and call to action for justice” following the death of Michael Brown in Ferguson, MO and subsequent protests. (See images and more information at the bottom of this post. -Ed.)

She spent a summer with Creative Time in New York City and The Lab in San Francisco, and has worked extensively with the Pulitzer Arts Foundation and the Contemporary Arts Museum St. Louis. She loves doing freelance writing and teaching yoga as well.

Get to know Mallory and more about T4America’s and Smart Growth America’s arts and culture work with this short Q&A below.

Why did you want to transition to this larger world of transportation, growth and development? Why Smart Growth America and T4America?

I’ve spent the last few years working in the Rust Belt, specifically St. Louis, MO; an incredible city. I was able to work at a very deep grassroots level while in St. Louis, but after the events in Ferguson, MO in August 2014, I realized that I needed more tools to move my community forward, and became more interested in intersectional work that bridged national and local alliances. I’ve also worked deeply in the space of art, but wanted to branch out to leverage the tools of art and culture in other ways. I’m inspired by public transportation, as I think it is one of the most democratizing resources available. I love how you can hop on a bus and be surrounded by all types of people from every part of the community — something that happens in relatively few spaces.

What kind of work will you be doing here at SGA/T4? What are you really excited about doing in 2017?

I’m going to be serving on both the Arts & Culture and Outreach Teams. I’m looking forward to helping to refine our creative placemaking strategies, processes and tools, and ultimately empower more communities to think about developing places with arts and culture at the helm. I think arts and culture can be both a tool to develop as well as an outcome that is nourished through development.

Why should those of us involved in planning, smart growth, neighborhood revitalization, transportation or the like be thinking about arts and culture? What role can and should the arts and culture play in improving neighborhoods and the places we call home?

Arts and culture can be incredible communication tools to better understand the experiences of people in communities and more deeply engage with them. And on the flip side of the process, I believe integrating arts and culture can help keep communities engaged in the changes happening where they live, making them educated, direct participants, which can ultimately lead to more sustainable implementation of projects that better serve the needs of those people.

We say in our creative placemaking guide that a smart starting point for any proposed transportation project is this question: “How can the distinctiveness of this place and the people in it contribute to the success of this transportation project and the community around it?” How can incorporating arts and culture into the process of building transportation projects — or really any projects to build parks or buildings or anything of the sort — result in better, more prosperous, more equitable places for all of us to live?

We all know there’s no one-size-fits-all approach. At least, I hope we know that! I believe that placemaking gives people ownership of their place and the changes occurring within it, and likewise makes both the process and any final product deeply relevant, functional and meaningful to a community.

Utilizing arts and culture in this way allows community members to articulate the uniqueness of their place, and allows for the project to be designed and implemented in more nuanced ways that make the final product something the community will use and love and that will improve their overall well-being.

And lastly, people need to love where they live, work and play. We need to be designing and developing communities in ways that will make people feel good, feel invited and feel special. And when people love their home, they work hard to make it the best place it can be! This builds stronger and more resilient communities, and a sense of empowered autonomy at the local level.

Thanks, and welcome to the team, Mallory!


View Mallory’s personal website at http://www.mallorynezam.com/. You can learn more about Mirror Casket from the project site and from this article in Smithsonian Magazine (image #7) about artifacts now in the collection of the new National Museum of African American History and Culture on the National Mall in Washington, DC.

Learn more about USDOT’s final congestion rule and the rest of the final performance measures [webinar]

The new requirements released last week by USDOT for how states and metro areas will have to measure traffic congestion were just part of a larger package of new performance measures. Join us next week to unpack the congestion rule and the rest of the suite of new measures. 

Updated 1/26/17: Thanks to everyone who was able to join us on the webinar. Here’s the archived recording if you missed it or want to revisit. -Ed.

The 2012 transportation law (MAP-21) required transportation agencies to begin using a new system of performance measures to govern how federal dollars are spent. And it was indeed big news last week when USDOT — responding to thousands of your comments we submitted — backed away from most of the outdated measures of traffic congestion that were proposed. But this was just one part of a much larger package of new performance measures and with last week’s release, USDOT has now finalized all of the new measures for safety, the state of repair, congestion, air emissions and other aspects of our transportation system.

Join us next Tuesday on January 24th at 10:00 a.m. EST as we walk through the second two (of three total) final rules that cover road, bridge and pavement condition, and overall system performance (the latter is what includes the traffic congestion measures.)

T4America experts will be on hand to unpack these final rules, discuss what states and metro areas need to know about this crucial first step toward more performance-based and data-driven decision-making when it comes to transportation investments.

We’ll also be announcing a new opportunity for technical assistance on performance measures, as well as some survey results on the state of the practice at metropolitan planning organizations across the country. Be the first to hear about both.

More about performance measures

How do we justify transportation expenditures? To many people, the perception is that project decisions are made in a murky, mysterious process, or, even worse, through a political process where only the projects with the most connections get funded. Further, it is not clear to the average person what all the spending gets them. With public confidence in government at low levels, it’s more important than ever to quantify the public benefits of transportation investment and let voters know what their money is going to buy — especially when attempts are being made to raise new money for transportation to fill the gap.

Transitioning to a more performance-based system of transportation investment was one of the key reforms of MAP-21 and these newly finalized measures could represent the beginning of a sea change in how funding decisions are made and our transportation system performs.

Read our 2015 report to learn more about performance measures

Trickle-up performance measures

While working to enhance its performance-based planning framework, Metro, the metropolitan planning organization for the Portland, Oregon region, can draw from the experience of local jurisdictions within its own region — bringing unanticipated benefits through “trickle-up” learning.

This is the second of a series of posts on the issues and challenges of performance-based planning in the Portland region.

When Metro kicked off the process of developing its long-range transportation plan governing the next ten years of spending it was clear that performance measures would be a focus, both because of the new requirements created by the 2012 federal transportation law (MAP-21) and a growing public interest in making smarter choices about transportation investments.

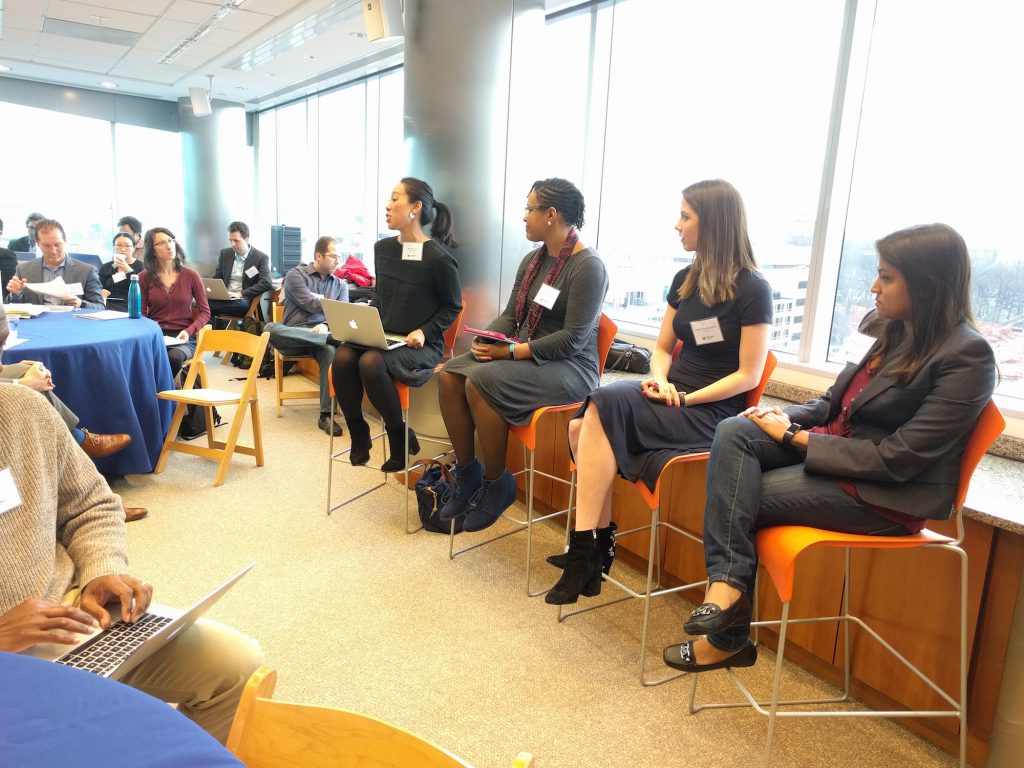
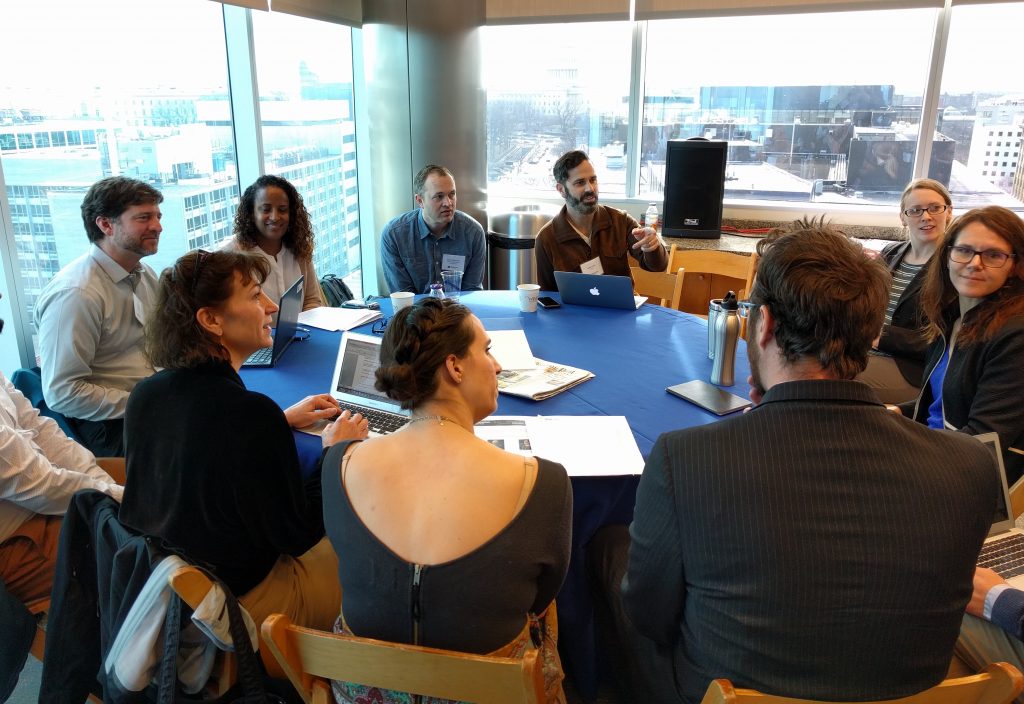
Metro convened a workgroup of stakeholders to provide guidance on performance measures. To get things started, Metro hosted a workshop in January of 2016, which included presentations on the performance measure work of two local jurisdictions: City of Portland and Washington County.

The experience of each of these jurisdictions offered up lessons that have informed the workgroup’s efforts to identify performance measures and develop a framework to inform Metro’s next long-range plan.

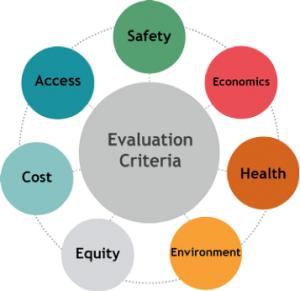
As part of its transportation plan, Portland has used performance-based criteria as a way to prioritize investment, and has been careful to ensure that those criteria reflect the city’s values. Criteria were derived from numerous sources that incorporate citizen input. The seven criteria are “cross-modal”; they evaluate various concerns and support a balance among modes.

Portland’s evaluation criteria

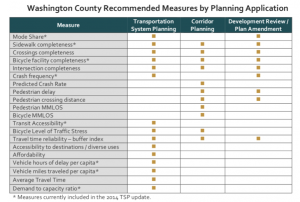
In 2014, Washington County published Multimodal Performance Measures and Standards, prepared by Kittleson & Associates. The report strives to identify performance measures that are relevant to non-automobile modes of travel. While the suite of performance measures identified in this study are useful fodder for Metro’s workgroup, some of the greatest value is the lessons learned in the process, and the opportunity to adapt some of the study’s approaches to evaluating the performance measures themselves.

While the study lists five lessons learned, the first two are most of interest:

  • Different measures are best for different planning applications.
  • Different measures may be needed to assess the same goal.

These two lessons, along with the use of matrices to visually compare proposed measures, are playing the biggest role in informing the work of Metro’s performance measures workgroup.

Performance Measures, Graphic, Transportation Planning, Grid, Chart, Corridor Planning, Development, Crash, Pedestrian, Mode Share, Travel Time, Portland, Oregon

Washington County, Oregon developed matrices to identify how proposed performance measures could be applied.

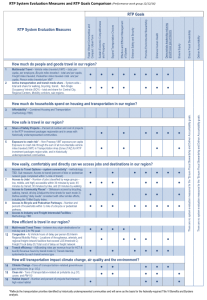
Taken together, these lessons led the workgroup to ask for matrices to illustrate the role of performance measures under consideration for Metro’s long-range plan. Metro is using two types of matrices to answer two questions. First, what is the relationship between the proposed performance measures and the region’s goals. Second, at what stage of planning can each performance measure be applied?

For example, Metro is using vehicle miles traveled as a performance measure in several stages of planning. It’s important to understand how this measure relates to several of the regions’ goals including efficiency of the transportation system, reducing household transportation costs, reducing greenhouse gas emissions and improving safety. A matrix comparing proposed measures with the region’s goals helps workgroup members to visualize those relationships and identify redundant measures.

RTP, Evaluation System, Matrix, Graphic, Chart, Portland, Oregon, Measures, Evaluation, Travel, Region, Efficient, RTP Goals

Metro staff developed a matrix that communicates how each proposed performance measure addresses the region’s goals.

Likewise developing a matrix to look at how measures can be applied is also helpful. For example, crash rate is something that cannot be predicted in Metro’s travel model. So while safety is a major goal for most transportation agencies, a proxy may be needed to inform selection of a preferred scenario or project prioritization. Metro is considering a measure they are calling “VMT exposure” which is the amount of traffic on surface streets. While this isn’t an exact measure of safety by any means, it is strongly correlated and can be easily forecast in a transportation model. Crash rate will be used as a monitoring measure to determine if the region’s investment strategy is working to reduce crashes in hindsight.

Besides the ideas on how to evaluate performance measures, there is an additional benefit to learning from local jurisdictions: consistency between local measures and regional measures. Getting everyone on the same page to coordinate regional investments helps ensure that all dollars are going to accomplish goals that are shared across the region. Regional performance measures that reflect those bubbling up from local jurisdictions will help local jurisdictions like Portland and Washington County that are already ahead of the game develop local plans that reflect their own local values while still being consistent with the regional plan.

Member weekly news bulletin 01-13-2016

National & policy

Chao skates through hearing despite little info on infrastructure. “Transportation Secretary-designee Elaine Chao emerged from the Senate Commerce Committee’s hearing today largely unscathed despite offering few concrete details about how she or Donald Trump planned to roll out a massive infrastructure investment program that the president-elect has promised.” (Politico)

Pelosi: Dems won’t back tax breaks ‘disguised’ as infrastructure bill. “House Minority Leader Nancy Pelosi (D-Calif.) on Friday reiterated a commitment to work with President-elect Donald Trump on a massive infrastructure package, but only under certain conditions.” (The Hill)

Transportation Agencies Will Finally Measure the Movement of People, Not Just Cars
“What you measure is what you get,” the saying goes, and for a long time, America’s transportation policy establishment was obsessed with measuring one thing: car congestion. Hundreds of billions of dollars have been spent in the quest for free-flowing vehicular traffic. The result is wider highways, more sprawl, and more people stuck in congestion. But this week U.S. DOT took an important step to change course, releasing new standards to guide how transportation agencies measure their performance. Advocates for transit and walkability say the policy is a significant improvement.” (Streetsblog)

Local & state news

Walking in Nashville
CityLab
“Only about half of Nashville’s roads currently have sidewalks, and no one knows where to find the money to cover the rest of them. The sidewalk situation even became a point of contention in last year’s mayoral campaign. “We’re just chipping away at a huge deficit and huge need,” says Mary Beth Ikard, Nashville’s Transportation & Sustainability Manager.”

Transit

Openings and Construction Starts Planned for 2017
The Transport Politic
“There are major transit infrastructure projects under construction throughout North America thanks to significant interest from local officials and support from national governments. That momentum is likely to continue thanks to the passage of several transit-supporting tax referenda last November. But in the U.S., there are big questions about the impact of the incoming Trump Administration.”

Shared-use mobility & tech

New Transportation Department panel on automation to weigh in on self-driving cars
LA Times
“The U.S. Transportation Department has created an advisory committee on automation filled with representatives from the auto industry, ride-hailing companies, universities and the mayor of Los Angeles. The committee will hold its first meeting Monday to discuss automation issues, such as the development and deployment of self-driving cars.”

How are states making transportation a key driver of their economic development agendas? [Webinar]

Join us in two weeks as we explore how two states have made transportation a key piece of their economic development agendas and have focused state funds on cost-effective investments in transportation.

Updated 2/2/17: Watch the full recording below.

This session is tied to the guide we recently produced for governors and their administrations which shows how a fresh approach to transportation is fundamental to creating quality jobs and shared prosperity while running an efficient government that gets the greatest benefit from every taxpayer dollar.

On a webinar Friday, January 27th at 3:00 EST, learn how two administrations – under Gov. Charlie Baker (R) in Massachusetts and Gov. Jay Inslee (D) in Washington – have utilized transportation as a tool that helps them accomplish their economic goals. The webinar will feature:

  • Charles Knutson, Senior Policy Advisor for Transportation and Economic Development to Gov. Inslee.
  • Kate Fichter, Assistant Secretary for Policy Coordination for the Massachusetts Department of Transportation.

State legislatures around the country are beginning new sessions as we speak, and this means a renewed focus on raising new state funding for transportation and also reforming the policies for spending those dollars. As legislators take a hard look at transportation programs, the policies and strategies in this new guidebook above — and in our previous resources — show how states can save money, improve projects, and make a stronger case to transportation spending through smart policy reforms. Download it today, and join us on January 27th for a terrific discussion.

If you want to get up to date on the legislative discussions we’re keeping a close eye on, or if you’re someone who is engaged at the state level on funding or policy, join our START network today.

USDOT rewrites congestion rule in response to outpouring of feedback

At long last, USDOT has finalized new requirements for how states and metro areas will have to measure traffic congestion and in the final rule — responding to the outpouring of comments they received — they backed away from most of the outdated measures of congestion that were proposed.

Updated 1/26/17: See the bottom of this post for a video of our webinar explaining this rule and the rest of the final package of performance measures. – Ed.

Wait, what congestion measures? First, let’s take a moment to catch up on what’s happening here, since it’s been months since this was in the news.

For two years, USDOT has been working to establish a new system of performance measures to govern how federal dollars are spent and hold states and metro areas accountable for making progress on important goals, including how states and cities would have to measure (and address) traffic congestion. (Why does how we measure congestion matter? Read some background here.)

As first written, USDOT’s proposed measures would, as we said back in early 2016, “induce sprawl, harm the economic potential of our main streets by treating them like highways, punish cities investing in public transportation, completely ignore people walking, biking, carpooling or telecommuting, and push local communities of all sizes to waste billions of dollars in vain attempts to build their way out of congestion.”

So back in August 2016, we delivered letters from nearly 5,000 individuals and 150 organizations — including dozens of local chambers of commerce and elected officials — opposing USDOT’s flawed proposal and urging them to rethink their approach.

Here’s what 5,000 letters looks like next to a terrific book about Complete Streets for scale purposes since USDOT allows digital submissions.

We’ll be reviewing this newly-released 300-plus page measure in closer detail in the days to come, but our first take upon reviewing it is that FHWA heard the extensive feedback on a complex rule and responded positively to most of the requests that we made.

“Tens of thousands of commenters, through campaigns from T4America, the American Heart Association, and others, raised concerns about the vehicle-focused nature of the eight measures proposed in the NPRM,” FHWA wrote in their comments accompanying the new rule.

The changes are complicated and difficult to quickly enumerate, but four changes are worth highlighting quickly here.

First, we complained that FHWA’s singular focus on delay “paints an incredibly one-dimensional picture of congestion. Focusing on average delay by simply measuring the difference between rush hour speeds compared to free-flow 3 a.m. traffic fails to count everyone else commuting by other modes, rewards places with fast travel speeds at the expense of places with shorter commutes and less time spent behind the wheel overall, and completely ignores how many people are actually moving through the corridor.”

In response, FHWA dumped this peak travel reliability measure, more commonly expressed through the Texas Transportation Institute’s travel time index (TTI), which mostly is a measure of the difference between speeds in the middle of the night and rush hour. This peak travel time measure is gone.

Secondly, they added a “person-hours” measure of delay, which will consider how many people are using the road instead of just how many vehicles are delayed. This was one of our primary critiques of the draft rule, because simple vehicle delay is blind to how many people a corridor is actually moving — it only looks at the number of vehicles. If one corridor moves three times the amount of people as another corridor because of a carpool requirement or a lane dedicated to high-capacity transit, it shouldn’t score the same for congestion just because the travel speed or average delay is the same.

This is a significant change. This means that a congested road that’s full of single-occupant vehicles will never be viewed the same as a corridor that is congested but also multimodal or otherwise carrying more people.

Thirdly, and responding clearly to feedback, FHWA added a new carbon dioxide emissions measure to track the percent change in CO2 emissions generated by on-road mobile sources on most bigger roadways. (Specifically roads on the National Highway System, which, as this graphic reminds us, aren’t always just highways.)

Fourth and lastly, on the topic of multimodal corridors, “…after reviewing these comments, FHWA has decided to include a new multimodal measure — the portion of non-single occupant vehicle travel.”

How did FHWA explain their reasoning to add a measure requiring states and metro areas to set a target for moving people via modes other than single-occupant vehicles?

“Because transportation in urbanized areas is inherently multimodal, it is important to account as much as possible for the options that are available to travelers in those urbanized areas.”

How we measure congestion does matter. It is important to look at congestion and its connection to economic activity. This post from a department within FHWA on Twitter today highlights this connection and it isn’t what most elected leaders and transportation officials believe. Congestion is bad for economic success, right?

Especially after the collapse of the recent Bakken-fueled oil boom of the last few years there, do you think that North Dakota’s leaders would trade ten minutes on their average commute times for ten percent of New York State’s GDP? Does the lack of congestion equal economic success?

This final performance measure from FHWA and USDOT would suggest otherwise.  They are to be applauded, and it wouldn’t have happened without your support. By FHWA’s own admission, the letters that you and thousands of others sent were responsible for pushing FHWA on these critical points.

Stay tuned for more, and sign up for email from T4America to get this kind of news straight to your inbox, including news about a detailed webinar about the new rules happening soon.

Updated: Here’s the video of our webinar about the new performance measures. Read this post for more information.

Big questions largely avoided during the first confirmation hearing for Trump’s Secretary of Transportation nominee

Trump’s appointee to serve as Secretary of Transportation had a confirmation hearing yesterday before a Senate committee, and though she was light on specifics, there were some illuminating questions from Senators and answers from Secretary-designate Elaine Chao.

In a confirmation hearing largely overshadowed by the higher-profile (and more controversial) hearings going on at the same time for Secretary of State and Attorney General, Elaine Chao answered questions from senators on the Commerce Committee yesterday morning and provided at least a glimpse into what can be expected at USDOT under the incoming administration.

She filed a short opening statement that was light on specifics, but emphasized the need to increase private investment in infrastructure, to streamline the process of building transportation projects, and to help the federal government be a partner in the innovation of emerging technologies that is happening on the ground in cities — which is currently “led by the private sector,” she said.

In that statement, she identified how our transportation investments have helped us be competitive, but noted that those “gains are jeopardized by infrastructure in need of repair, the specter of rising highway fatalities, growing congestion, and by a failure to keep pace with emerging technologies.”

While highway fatalities are indeed increasing, pedestrian fatalities are also on the rise after years of decline. Following the release of Dangerous by Design 2016, which highlights the 46,000-plus people who were killed while walking from 2005-2014, T4America sent a letter signed by hundreds of supporters to the committee members asking them to press her on this safety issue.

Senator Brian Schatz from Hawaii took up the cause during the hearing, noting that we have a “serious safety crisis” overall, with more than 35,000 people dying on our roads in 2015 — “the largest increase in years;” “10 percent of those [deaths] were pedestrians,” he added, noting that the problem is particularly bad in Hawaii.

But “these [pedestrian fatalities] are preventable through best practices,” Senator Schatz added, noting how better street designs — and direct guidance from the federal government — can help states and MPOs build streets that are safer for everyone. He asked about her commitment to work on a safe streets agenda, to which Ms. Chao answered that she looked forward to working with him on the issue.

On the TIGER competitive grant program that is increasingly one of the best (or only) sources of funding for smart, local projects, Chao made no promises about overall funding for the program but noted that it was “one area of great agreement,” and that she was “impressed with how many members like it.”

On the elephant in the room, long-term funding for transportation, there was the typical rhetoric and few details — perhaps to be expected by any nominee at this point.

“President-elect Trump’s vision for an infrastructure proposal is ambitious, futuristic and comprehensive,” she said, noting that private investment and public-private partnerships need to be part of the mix. She was supportive of the TIFIA financing program (“It’s an important and valuable source of funding…we need more innovative sources like it.”) And she’s aware of the long-term structural problems with the gas tax, such as improved vehicle efficiency, and vehicle-miles-traveled — though now increasing after ten years of no growth — failing to come close to any of the federal projections for huge long-term growth.

She did answer a pointed question from Senator Cory Booker, who asked — financing and private investment aside — if she and President-elect Trump are in favor of increasing direct federal investment in transportation. Chao said, “I believe the answer is yes.”

And though it would be a question for Congress rather than the USDOT, she didn’t rule out Senator Mike Lee’s plan to essentially kill the federal transportation program, cut the federal gas tax down to a few pennies and let states decide whether or not (and how) they want to invest in transportation. “I’m open to all ideas,” she said, although this specific idea stands in stark opposition to the notion of increasing direct federal investment in infrastructure.

There was no vote on her confirmation today, and there could be another hearing for further questions. But evidence thus far suggests that Democrats are unlikely to oppose her nomination and she should be confirmed in a matter of time. As for what USDOT will look like under a Secretary Chao, there were a few hints of the approach today, but the proof will be in the pudding in 2017.

Watch the full video of the hearing above.

Introducing “Dangerous by Design 2016”

Crossposted from Smart Growth America and the National Complete Streets Coalition.

Dangerous by Design 2016, released today by our colleagues at Smart Growth America and the National Complete Streets Coalition, takes a closer look at the alarming epidemic of pedestrian deaths, which are on the rise after years of declining.

Share this on Twitter Share this on Facebook

Between 2005 and 2014, a total of 46,149 people were struck and killed by cars while walking. That averages out to about 13 people per day.

Each one of those people was a child, parent, friend, classmate, or neighbor. And these tragedies occurred across the country — in small towns and big cities, in communities on the coast and in the heartland.

The fourth edition of this report being released today again ranks the most dangerous places for people walking by a “Pedestrian Danger Index,” or PDI. It also explores who is most at risk of being struck and killed by a car while walking, including data that looks at pedestrians by age, race, ethnicity, and income.

Explore the online feature to see the full rankings of the 104 largest metro areas in the country and all 50 states, as well as interactive maps of where fatal collisions occurred.

View the data and maps


Join us for the kickoff

Interested in learning more about Dangerous by Design, and what states and metro areas are doing to combat this epidemic? The report authors and other special guests will be talking about this new research during a kickoff webinar today (Tuesday) at 1 pm EST. You are invited.

REGISTER


Register for the event to to learn more about the findings and to hear from the report’s authors, national transportation policy experts, and local advocates about how we can make streets safer by design.

Will Elaine Chao address pedestrian safety?

A confirmation hearing for Elaine Chao, Trump’s nominee for transportation secretary, is scheduled to take place this week, on Wednesday, January 11th on Capitol Hill. We want to make sure pedestrian safety is on her mind.

Tell the Senate Commerce Committee to ask Chao how she plans to address pedestrian safety.

As always, we welcome your reactions, questions, and ideas. Share them on Twitter at the hashtag #DangerousByDesign.

Member Weekly News Bulletin 01-03-2016

Nat’l & policy

Senate Commerce to consider Chao’s nomination Jan. 11Politico

-“JAN. 11 IS THE BIG DAY: We let Pros know Tuesday that the confirmation hearing for President-elect Donald Trump’s choice for secretary of Transportation, Elaine Chao, would possibly be next week. But now we have a date and time: Jan. 11 at 10:15 a.m.”


What to know about the 115th CongressBoston Globe

-“On Tuesday at noon, with plenty of pomp and pageantry, members of the 115th Congress will be sworn in, with an emboldened GOP intent on unraveling eight years of President Obama’s Democratic agenda and targeting massive legacy programs from Franklin D. Roosevelt and Lyndon B. Johnson such as Social Security and Medicare.”


Trump’s infrastructure plan likely to take shape later in springThe Hill

-“President-elect Donald Trump’s promised infrastructure package will likely take shape after his first 100 days in office, according to top Republican lawmakers on Capitol Hill.

Rep. Bill Shuster (R-Pa.), chairman of the Transportation and Infrastructure Committee, said Congress will focus on finding ways to pay for Trump’s infrastructure proposal during the first few months of his presidency, with a broader package likely to come together later in the spring.”


Republicans embrace Amtrak’s Gulf Coast rebirthPolitico

-“A decade after Hurricane Katrina wiped out a long stretch of Amtrak’s transcontinental passenger route in the Deep South, the railroad is plotting to bring it back. And it’s attracted a seemingly unlikely group of cheerleaders: red-state Republicans.”


Transportation agency taps ‘Build America’ leaderThe Hill

-“The Department of Transportation has tapped an executive director to lead its Build America Bureau, the agency announced Friday.

Martin Klepper will join the newly created entity, which was established this summer to back transportation and infrastructure projects in the U.S.”


Five transportation issues to watch under TrumpThe Hill

-“President-elect Donald Trump has long talked about the need to repair the nation’s crumbling bridges, roads and airports.

Next year, the real estate mogul will have plenty of opportunities to address those issues.

The incoming administration and new Congress will be facing a number of key transportation decisions, from setting federal aviation policy to determining local transit funding. Here are five transportation issues to watch in 2017.”


DOT secretary-nominee Chao outlines agency prioritiesLand Line Magazine

-“Effective enforcement, getting the most bang for the buck, and considering new technologies are key for Department of Transportation secretary-nominee Elaine Chao in addressing her top priorities for the department.”


Anthony Foxx, the Great ConnectorCity Lab

“The outgoing U.S. Secretary of Transportation reflects on autonomous vehicles, economic justice, and a remarkable tenure.”


Suburbs increasingly view their auto-centric sprawl as a health hazardWashington Post

“Planners in Prince George’s County have talked for years about reshaping communities to help residents fetch a gallon of milk via a walk or bicycle ride, rather than add to stifling traffic congestion by having to drive.

But planners say they’re increasingly treating the Maryland county’s low-density, auto-dependent design as more than a traffic problem. More often, they say, they’re considering sprawl a health hazard.”


Local & state funding

SC lawmakers to discuss gas tax hike again in 2017 to fix roads, bridgesWBTV

“A proposed bill in South Carolina would allow county voters to choose whether to raise the gas tax to fund crumbling roads and bridges, but not everyone is in favor of the idea.

The bill was pre-filed by lawmakers from the Charleston area.

Funding to fix poor roads in the Palmetto State has been the center of debate for lawmakers in Columbia for years.

Legislators were unable to come to a long-term solution to fund the needed infrastructure improvements. The issue is expected to be a top priority when they return in January.”


State (Idaho) hits road blocks for transportation fundingIdaho Press

-“In the run-up to the November election, legislative candidates from Canyon County made one of their top priorities fixing the stretch of Interstate 84 from Caldwell to Nampa, a section of roadway that has posed a challenge to motorists and public safety officials for years.”


Oregon Legislature will try to ease Portland’s traffic problemsKATU News

“PORTLAND, Ore. — Oregon lawmakers are determined to pass a bill this session that will address the Portland area’s growing traffic problem.

A special committee of seven senators and seven representatives, the Committee on Transportation Modernization and Preservation, toured the state this summer to hear what Oregonians want in a 2017 transportation funding package.”


Local & state news

As Second Avenue Subway Opens, a Train Delay Ends in (Happy) TearsNY Times -“Finally.

The Second Avenue subway opened in New York City on Sunday, with thousands of riders flooding into its polished stations to witness a piece of history nearly a century in the making.

They descended beneath the streets of the Upper East Side of Manhattan to board Q trains bound for Coney Island in Brooklyn. They cheered. Their eyes filled with tears. They snapped selfies in front of colorful mosaics lining the walls of the stations.”


MTA Rethinks Approach to Second Avenue SubwayWall Street Journal

-“With the first phase of the Second Avenue Subway set to open Jan. 1, transit agency says it is looking for ways to cut time and costs for final 13 stations”


Excuses for High Construction Costs (Opinion)Pedestrian Observations (Alon Levy)

“I have written many posts about international differences in subway construction costs. They’ve gotten a lot of media attention, percolating even to politicians and to a team of academics.”


Houston area leaders: Time to push transportation improvements beyond adding and widening freewaysHouston Chronicle

Houston-area officials, and especially drivers, have known for years the region’s roads are strained and congested, but a panel earlier this month with the county judges of the area’s largest suburban counties might have been a first in terms of the dire message expressed.

“Traffic is not going to get any better. It’s just not,” Brazoria County Judge Matt Sebesta said.

Montgomery County Judge Craig Doyal told the crowd of engineers, road builders and consultants: “You can only put so many lanes of traffic down.”

The message from Fort Bend County Judge Bob Hebert: “Trying to do what we’ve done over the last 50 years and more of it just will not work.”


Los Angeles Drivers on the 405 Ask: Was $1.6 Billion Worth It?-NY Times

-“It is the very symbol of traffic and congestion. Interstate 405, or the 405, as it is known by the 300,000 drivers who endure it morning and night, is the busiest highway in the nation, a 72-mile swerving stretch of pavement that crosses the sprawling metropolis of Los Angeles.

So it was that many Angelenos applauded when officials embarked on one of the most ambitious construction projects in modern times here: a $1 billion initiative to widen the highway. And drivers and others put up with no shortage of disruption — detours and delays, highway shutdowns, neighborhood streets clogged with cars — in the hopes of relieving one of the most notorious bottlenecks anywhere. Six years after the first bulldozer rolled in, the construction crews are gone. A new car pool lane has opened, along with a network of on- and offramps and three new earthquake-resistant bridges. But the question remains: Was it worth it?


Bike/Pedestrian

(NY) State’s Highest Court Holds NYC Liable for Injuries on Streets Without Traffic CalmingStreetsblog NYC

-“The Court of Appeals, New York’s highest court, ruled that New York City and other municipalities can be held liable for failing to redesign streets with a history of traffic injuries and reckless driving.”


Transit

Next phase of the Wilshire subway receives $1.6 billion in federal fundsLA Times

-“The announcement in Los Angeles on Wednesday of more than $1.6 billion in new funding for the Westside subway brings transportation officials one step closer to their ambitious goal of finishing the nine-mile line before the 2024 Olympic Games.”


Where Metro’s Trains Need to Be Protected From CarsLA Magazine

-“Metro is currently fishing for a contractor to rate all the street-level crossings on the Blue Line, the popular DTLA to downtown Long Beach light rail line. An early plan calls for elevating or sinking the train at busy intersections; the ones where the most car vs. train and train vs. pedestrian accidents occurred. Another proposal could turn the ground-level Wardlow Station in Long Beach into an elevation stop, ala the Chinatown or Culver City stops.”


Shared-use mobility & tech

Local leaders to Cuomo, lawmakers: Bring Uber to upstate NYWXXI News

-“Mayors and county executives are urging New York Gov. Andrew Cuomo and state lawmakers to authorize Uber’s upstate expansion.”


Jesse Jackson presses Uber for diversity dataThe Hill

-“Civil rights leader Jesse Jackson is urging Uber to disclose the racial and gender composition of its workforce, according to a letter obtained by USA Today.

Jackson called on the ride-hailing firm to make its diversity data available to the public by next month, urging CEO Travis Kalanick to join the fight to “change the face of technology.”