Ten things to know about USDOT’s new proposal for measuring traffic congestion

For the first time, USDOT has released new requirements for how states and metro areas will have to measure traffic congestion. While the new rule marks a continued, necessary shift to assessing what our federal transportation dollars actually accomplish, this proposal as introduced doubles down on outdated measures of congestion that will push local communities to spend billions of dollars in vain attempts to build their way out of it.

For two years, USDOT has been working to establish a new system of performance measures to help govern how federal dollars are spent and hold states and metro areas accountable for making progress on important goals. This proposal for congestion (and several other measures focused on “system performance”) is the last of three sets of new Federal Highway Administration (FHWA) rules that will be finalized in early 2017.

Though this represents an incredibly important and necessary shift toward measuring what our transportation spending actually accomplishes, using the wrong measure for congestion will help advance projects that divide communities, cut people off from opportunity, and cost billions of dollars (we don’t have) in the name of solving “congestion” by trying in vain to keep traffic moving.

As we laid out in our post on congestion last week, how we measure congestion matters.

There’s a direct connection between how we decide to measure it and how we choose to address it. If we focus, as this rule does, on keeping traffic moving at a high rate of speed at all times of day on all types of roads and streets, then the result is easy to predict: our solutions will prioritize the investments that make that possible, regardless of cost vs. benefits or the potential impacts on the communities those roads pass through.

Here are ten things you need to know about this new rule from USDOT and what you can do about it


#1 The rule undermines Secretary Foxx’s unprecedented effort to connect communities and use transportation to give people greater opportunities

Transportation Secretary Anthony Foxx recently launched a campaign based on the stunning admission that federal policy had long incentivized poorly designed highways that isolated communities and cut people off from jobs and opportunities.

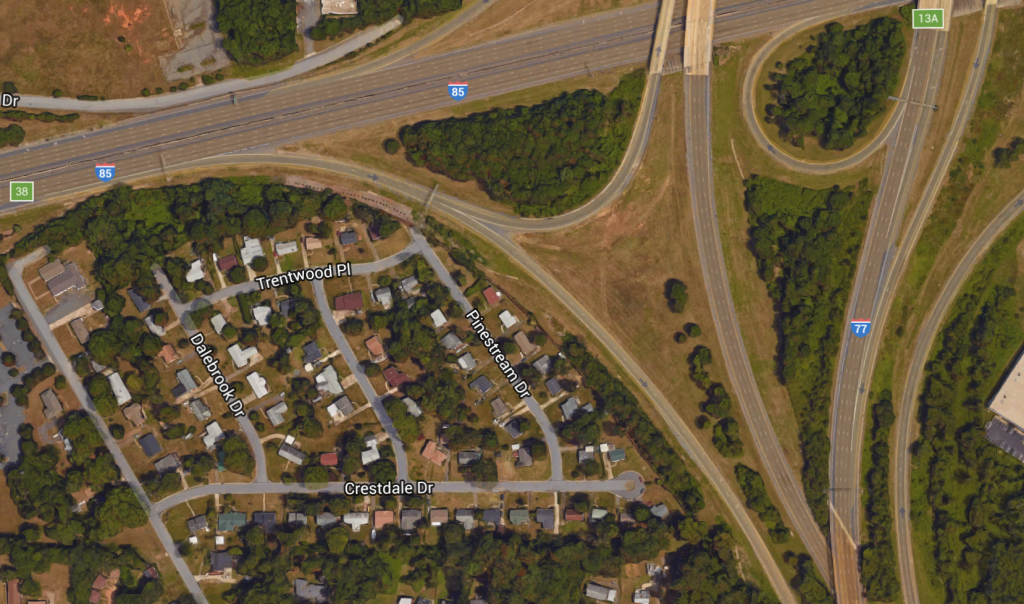
Springing out of powerful personal examples he saw firsthand growing up in Charlotte when new freeways were built “to carry people through my neighborhood, but never to my neighborhood,” he expressed his firm commitment to ensuring that our transportation investments connect more people to opportunity and knit communities together — rather than divide them.
crestdale drive charlotte interstates congestion rule

Where the streets around Secretary Foxx’s childhood neighborhood dead-end into Interstates 77 and 85 in Charlotte, NC

It’s an inspiring effort, but as he said, “These principles sound very easy, but they’re really hard and they’re also very necessary if we’re going to make transportation work for everybody.”  This rule produced by FHWA illustrates the uphill battle against the institutional inertia for the old way of doing things.

This proposal also undercuts the Secretary’s ongoing Mayors’ Challenge for Safer People and Safer Streets intended to “help communities create safer, better connected bicycling and walking networks,” explicit requirements from Congress to design streets safe for all users, and the nearly 900 communities that have passed complete streets policies to do the same.

“We’re trying to be more attuned, but it’s not a situation where the federal government is solely in control. We can’t tell a state what project to do. They have to make those determinations,” Sec. Foxx noted.

Indeed, states and metro areas will still be making the bulk of the decisions. Yet through this rule and other guidance, USDOT can absolutely usher in a new paradigm by steering states and metro areas to a more holistic approach for measuring traffic congestion that counts all people in a community by counting all modes of transportation. And we will need your help to hold USDOT’s feet to the fire to make this change happen.

#2 Focusing on delay is simply the wrong measure for addressing congestion

USDOT plans to measure vehicle speed and delay seven different ways, while ignoring people carpooling, taking transit, walking & biking or skipping the trip entirely.

A host of people and groups from all across the map, including T4America, have already explained in detail how a singular focus on delay for drivers paints an incredibly one-dimensional picture of congestion. Focusing on average delay by simply measuring the difference between rush hour speeds compared to free-flow 3 a.m. traffic fails to count everyone else commuting by other modes, rewards places with fast travel speeds at the expense of places with shorter commutes and less time spent behind the wheel overall, and completely ignores how many people are actually moving through the corridor.

This measure treats a corridor filled with buses or carpoolers the same as a corridor filled with single-occupancy vehicles. It ignores millions of people who opt out of congestion entirely by taking transit, telecommuting, walking or biking, and even penalizes places where people get to take shorter trips. While USDOT’s proposal to measure delay per capita at least begins to recognize that not everyone in a region is stuck in traffic on the highway, it still fails to measure how many people are moving through a corridor.

Shouldn’t the actual impact on real people be the core principle of anything we measure? Any traffic congestion measure should lead us to solutions that increase access to opportunity for everyone — regardless of how they travel each day.

#3 You can’t manage what you don’t measure

In the pointed words of a USDOT official earlier this week, “you can’t manage what you don’t measure.” The really staggering thing is that FHWA knows they’re missing the boat on measuring other crucial things that paint a more accurate picture of delay. From their own words in the 425-page rule:

As with delay metrics, FHWA acknowledges that travel time indices do not capture system attributes in terms of shorter trips or better access to destinations and mode options, which may occur at the expense of greater delay.

True. So let’s find a better way than focusing narrowly on delay.

#4 USDOT should stick with reliability and dump delay

One of the few positives is that (in one of the measures), USDOT recognizes that predictability is incredibly important. The rule includes a people-centric metric of “reliability” — whether a trip on a corridor takes the same amount of time from one day to the next. While completely eliminating rush hour congestion isn’t either possible or affordable, what many travelers are looking for is the basic assurance that their morning commute will take the same amount of time each day, allowing them to plan their trips with predictability.

But reliability for whom? Unfortunately, this rule only considers the reliability of those traveling by car, and will ignore whether or not your transit trip is hit or miss.

Though one of the other measures is labeled “reliability,” it’s just another measure of delay in sheep’s clothing: It defines “reliability” as trips taking the same amount of time at any time of the day – middle of the night or rush hour — an incredibly unlikely scenario.

#5 When it comes to congestion, this treats highways the same as main streets — and could do real harm to our most economically vibrant places

Take a look at these two sets of streets from Nashville and Charlotte. First: US 41/Clarksville Pike in northern Nashville, and then Broadway in downtown Nashville.
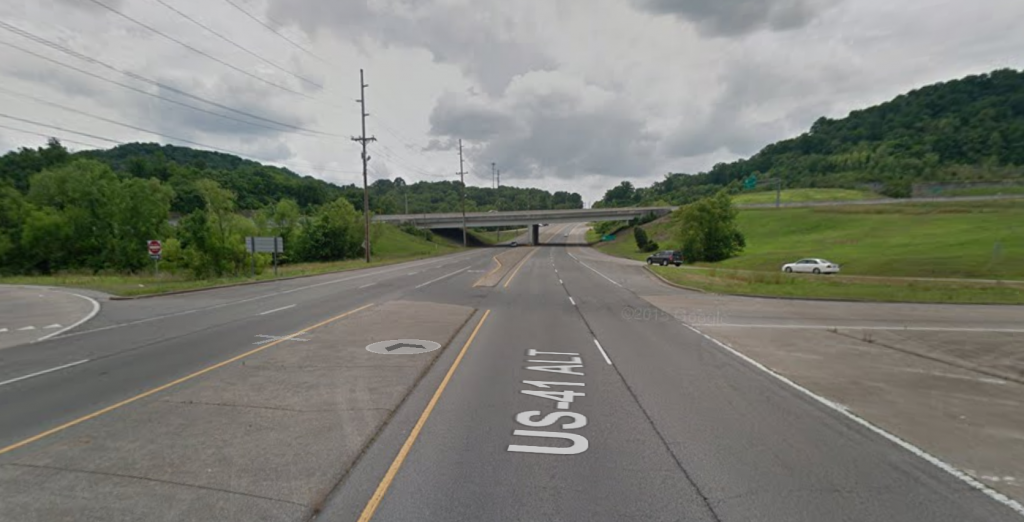
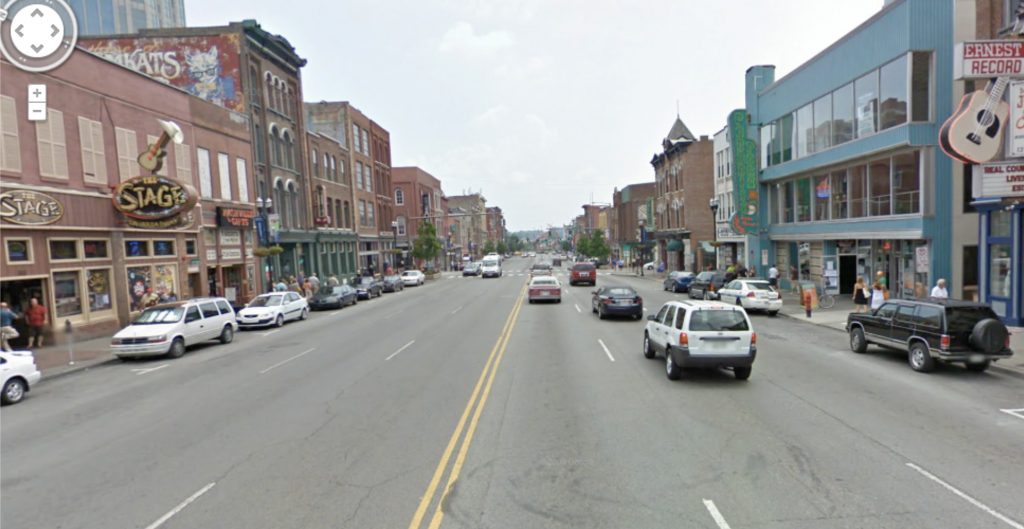
US 41 Nashville congestionNashville Broadway NHS congestion

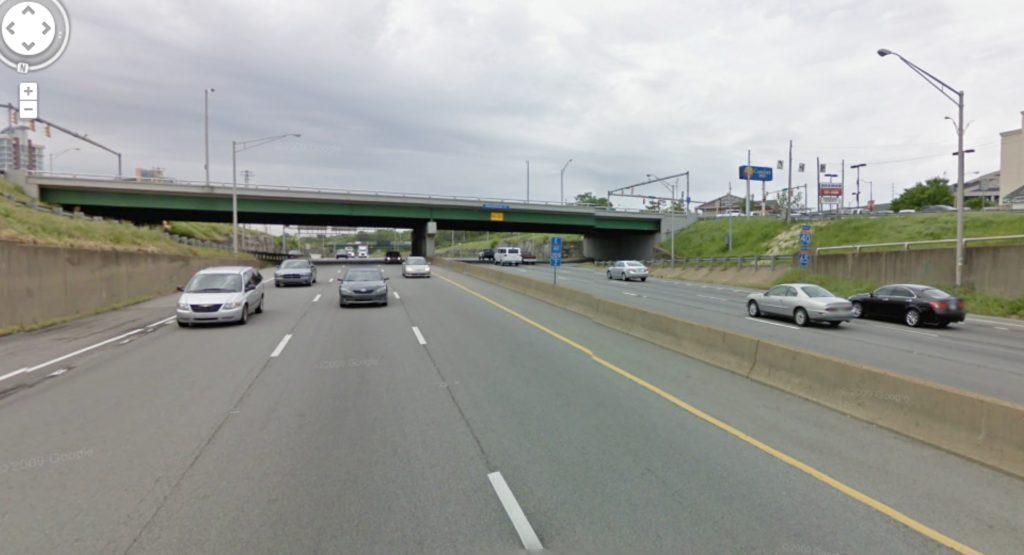
And Brookshire Blvd/NC-16 headed south into Charlotte, and Tryon Street near downtown
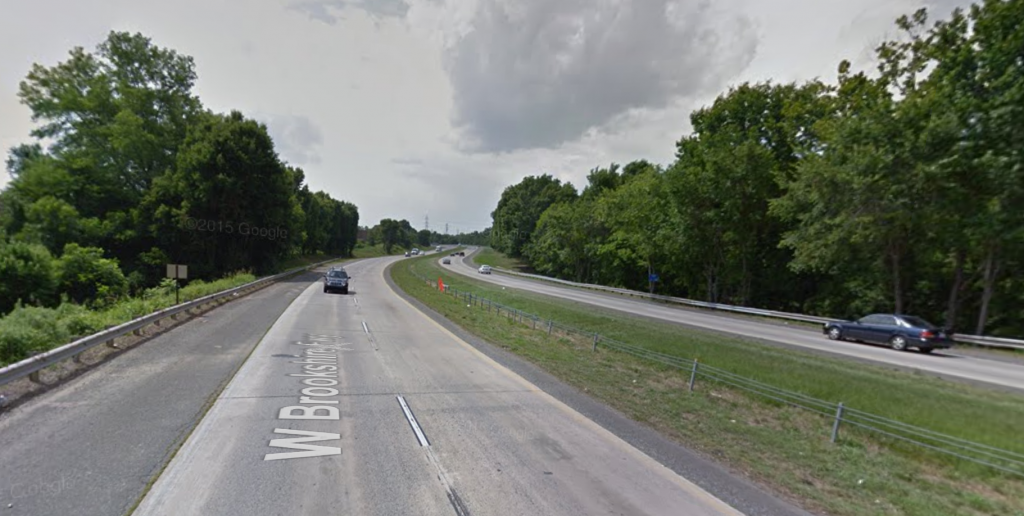
NC 16 Charlotte congestionCharlotte Tryon Street NHS congestion

Are the needs of all of these streets the same? Do they all need to accomplish the same thing? Should we expect them to function the same way?

Partially because of a decision made all the way back in 2012 in MAP-21 to expand what’s known as the National Highway System to include nearly every four-lane (or larger) road — regardless of what kind of traffic it carries or where it passes through, this measure proposes to measure congestion roughly the same way on all of them.

Whether in a rural small town or a big city, the needs of our country’s main streets are radically different from the highways and interstates designed to connect disparate places. For a main street to function well, it has to serve everyone who needs to use it.

On a main street, that which looks like “vehicle delay” to a traffic engineer looks like economic activity and success to a local merchant or mayor on a main street.

#6 USDOT ignores the innovative things other states and metro areas are already doing

California has already moved to scrap level of service (LOS) as an evaluation criteria for transportation projects, one that has typically resulted in the same outcomes as this narrow congestion rule. As Angie Schmitt wrote in Streetsblog back in January:

Instead of assessing how a building or road project will affect traffic delay, California will measure how much traffic it generates, period. Car trips, not car delays, will be the thing to avoid. This is likely to have the opposite effect of LOS, leading to more efficient use of land and transportation infrastructure.

At the same time that USDOT is proposing to double down on 1960’s measures for traffic congestion, other metro areas across the country are setting ambitious new goals and accompanying performance measures for improving health, improving access to jobs for more people or expanding transit to connect more people to opportunity.

#7 We can’t wait to develop better measures until we have the “perfect” data

Throughout the rule’s 425 pages, USDOT continues to perpetuate the myth that they lack adequate data to measure other modes of transportation, ignoring sources like (their own!) National Transit Database, the U.S. Census American Community Survey, and cell phone network data among others. USDOT invested millions of taxpayer dollars after the passage of MAP-21 to procure the data necessary to develop these vehicle-only measures. If USDOT is spending our money to collect data then they must find ways to acquire the data needed to better measure the entire system and all of its users.

#8 It puts containers above commuters

By defining congestion on interstates as speeds below 35 mph for commuters but below just 50 mph for freight trucks, this rule strangely prioritizes the needs of freight movement at the expense of people. While the movement of freight is indeed incredibly important, it should be on a level playing field with the people picking up the majority of the tab for the system’s maintenance. (To say nothing of the difficulty of actually implementing different standards for various types of vehicles on the same roadway.)

This rule also sets an impossible standard for freight movement in urban settings. Freight bottlenecks obviously occur far more often in urban areas where demand is far greater. Does anyone think that it’s feasible or affordable to spend enough or build enough capacity so that trucks can travel at 50 mph through the middle of major cities during rush hour?

#9 It undercuts the goal of protecting and enhancing the environment

This rule does include more than just measures for traffic congestion, including a requirement to measure mobile source emissions (i.e. pollution from vehicles). Yet states and metro areas would only have to measure the impact of the few projects funded by the relatively tiny Congestion Mitigation and Air Quality (CMAQ) program, which is akin to not being required to reduce highway deaths on a road because that road was built with highway dollars instead of safety improvement dollars.

Though the rule makes a first-ever move to include language on measuring the contribution of the potential emissions impacts of transportation, it stops far short of actually including any requirements with teeth. As Joe Cortright wrote earlier this week:

Despite some hopes that the White House and environmentalists had prevailed on the USDOT to tackle transportation’s contribution to climate change as part of these performance measures, there’s nothing with any teeth here. Instead—in a 425 page proposed rule—there are just six pages (p. 101-106) addressing greenhouse gas emissions that read like a bad book report and a “dog-ate-my-homework” excuse for doing nothing now. Instead, DOT offers up a broad set of questions asking others for advice on how they might do something, in some future rulemaking, to address climate change.

#10 We still have a chance to improve this rule — but we’ll need your help to do it

The comment period for this rule isn’t open yet — it will open on Friday, April 22 and run for at least 90 days. Though USDOT has gone in the wrong direction on many of these measures, we know from our past experience on similar rules that they are absolutely listening for suggestions for improving this. They’re eager to hear how it can be improved.

There are three things you can do in the next week to help.

Not on our email list already? Sign up here.

Will pending federal transportation rule double down on outdated view of congestion?

USDOT is on the cusp of releasing crucial directions for how states and metro areas will have to measure traffic congestion. The new rule could push local communities to try in vain to build their way out of congestion, or mark a shift toward smarter approaches like shortening trip times, rewarding communities that provide more options or better accounting for other travel modes and telecommuting.

Updated: The rule is out — read our more detailed post on ten things you should know about it, and take action by sending a letter to USDOT.

Friday Night Lights

Thanks to new requirements in the 2012 transportation law (MAP-21), USDOT is working to establish a new system of performance measures to help govern how federal dollars are spent and hold states and metro areas accountable for making progress on important goals. For two years, USDOT has been slowly developing, releasing and then refining new metrics for safety and state of good repair for highways and bridges. And any day now, they’re expected to release the final highway rule that will cover traffic congestion, air emissions, freight movement and system performance.

How we measure traffic congestion matters

While all of those specific metrics are important, how USDOT instructs states and metro areas to measure congestion will have huge impacts on communities of all sizes. Why? Because there’s a direct connection between how we decide to measure congestion and the resulting strategies for addressing it. And we need a measure that rewards solutions like aggressively investing in additional travel options, eliminating trips, reducing trip length, creating more places to live close to jobs or more effectively managing travel demand.

One of the most commonly used methods for measuring congestion today (and how proposed transportation projects would improve it or make it worse) is incredibly narrow and generates major criticism: roadway delay.

Every year, the Texas Transportation Institute releases their annual Travel Time Index congestion report that generates tons of news coverage across the country. Our piece from last year explained the limitations of comparing average rush-hour speeds to empty roads in the middle of the night, as TTI uses those middle-of-the-night speeds as their baselines for comparison. And then as a direct result of how congestion gets measured, many agencies attempt, at enormous price tags, to build enough road capacity to keep traffic moving at free-flow speeds during rush hour, usually bringing limited benefits (a few seconds of savings per commuter) at enormous costs.

Roadway delay, typified by TTI, also rewards places with long average commutes that happen at a high rate of speed, dinging places where people spend less time commuting or commuting shorter distances — just because they travel at slower speeds compared to that baseline of average travel speeds at the middle of the night.

Another major shortcoming is that roadway delay focuses only on drivers — not commuters as a whole, ignoring the millions of people opting out of congestion entirely by using various other options like transit, walking or biking or skipping the trip by telecommuting.  Under a roadway delay measure, if a city has made investments like these that allow a large share of its commuters to skip roadway congestion entirely, it can be rated the same as another city where the average delay on the roads is the same, even if 100 percent of that second city’s commuters are stuck in traffic.

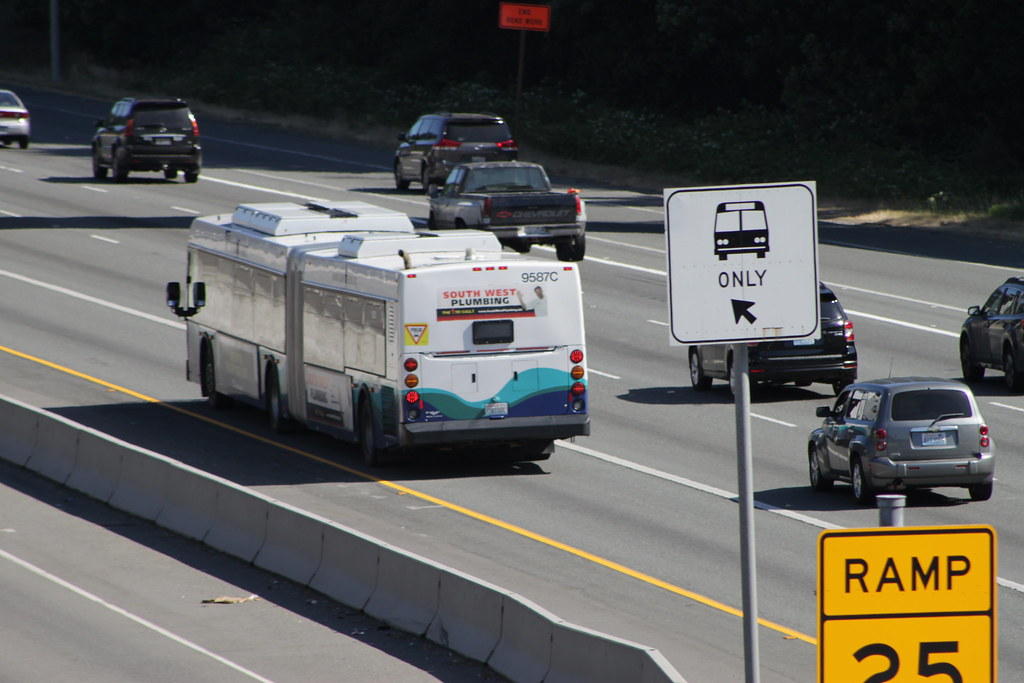
Delay is also blind to how many people a corridor is actually moving — it only looks at the number of vehicles. Should two similar corridors, where the first moves three times the amount of people as the second because of a carpool requirement or a lane dedicated to high-capacity transit, have the same scores for delay just because the travel speed is the same?

STEX 9587C deadheading in Mountlake Terrace

With USDOT about to propose this new framework for measuring congestion, it’s worth stating plainly: Roadway delay, similar to what TTI measures, represents a flawed and unrealistic view on measuring congestion.

It also doesn’t mesh with USDOT’s overall priorities, running counter to the stated goals of President Obama’s seven rounds of successful multimodal TIGER investments as well as the priorities of Secretary Foxx’s ambitious Ladders of Opportunity initiative.

A better, properly constructed measure will reward states and regions for investing in projects that make the most cost-effective difference in managing congestion, reducing travel times and improving system performance, regardless of what type of transportation mode is proposed.

What we’re expecting from USDOT

Unfortunately, early indications lead us to believe that the final congestion measure due to be released any day now will incorporate a variation on roadway delay. But that won’t be the end of the line for something better. Just like the past two rules that largely focused on safety and the conditions of roads and bridges, USDOT will be opening a comment period after the rule is released and then refining it one last time.

Though we’ll have an uphill battle, through coordination and agreement on a preferred alternative (more on that in our next post), we stand a strong shot at getting language included that acknowledges the limitation of these conventional congestion measures and invites development of a better, more holistic measure that provides a fuller picture of congestion and who is or isn’t affected.

But we won’t be able to do this alone. We will need cities, MPOs, transit agencies, the business community, state DOTs and advocates just like you to support our effort to ensure that the final congestion measure more fully accounts for all modes of transportation and doesn’t reinforce flawed 1950’s measures of success.

New traffic congestion report raises more questions than it answers

Most people sitting behind the wheel each day won’t be surprised by the findings of the latest edition of the Texas Transportation Institute’s report on urban congestion that shows, once again, that (surprise!) the roads in most major American cities are very congested during rush hour each day. The report’s methodology is flawed, but what really matters most is what policymakers and citizens decide to do about congestion in their communities.

(Updated: 8/27/15 12:15 a.m. with other articles at bottom.) Once again, The Texas Transportation Institute is in the headlines today with the release of their Urban Mobility Report and its Travel Time Index (TTI), which purports to rank metro areas by congestion but is mostly disconnected from what commuters experience on a day-to-day basis.

While TTI is striving to provide easy to understand measures and rankings to the complex issue of traffic congestion, their methodology is once again drawing criticism on a number of fronts.

The report’s touchstone metric is a blunt measure of peak-hour speeds compared to an empty road in the middle of the night. Did you know that trips take longer during rush hour compared to the middle of the night? You did? The comparison of rush-hour to free-flow traffic begs the question about the goal: is it reasonable or even possible to build enough road capacity to keep traffic moving at free-flow speeds from 6-9 a.m. when the bulk of the populace is going to work? (Those free-flow speeds being used as the baseline comparison also exceed the speed limit in many cases, by the way.)

The economist Joe Cortright wrote a comical April Fools post that showed how silly that logic is when applied anywhere else, in this case, at Starbucks, where consumers lose “$4 billion every year in wasted time” because of long lines during busy mornings. Yet:

No one would expect to Starbucks to build enough locations—and hire enough baristas—so that everyone could enjoy the 15 second order times [at 9 a.m.] that you can experience when there’s a lull [at 9 p.m.]. Consumers are smart enough to understand that if you want a coffee the same time as everyone else, you’re probably going to have to queue up for a few minutes.

The report focuses only on drivers — not commuters as a whole. The millions of people using growing modes like transit, walking or biking or skipping the trip entirely by telecommuting at peak aren’t included in the analysis. So when the report says “person” or “commuter,” what they’re really saying is “car commuter.” The nearly 1 million trips taken per day in Washington, DC —#1 on the “list of gridlock-plagued cities — on metro (bus and rail) and therefore not in a car? Not included in this analysis.

Trips not taken can be crucial, yet they’re ignored here. In February 2009, Inrix, the company partnering with Texas A&M on this release, reported that just a 3.7 percent drop in vehicle miles traveled in 2008 resulted in a 30 percent drop in congestion in the 100 most congested metro areas. We don’t need everyone to shift their trip, take transit, move closer to work, or telecommute — among many possible options. But smart investments and incentives that lead to very small reductions in trips taken can have huge benefits in reduced congestion. And they’re often far cheaper than massive projects proposed to shave a few seconds off of average commutes.

Live close to where you work? Oops. Your short commute can come out looking worse than someone else’s much longer commute. TTI completely ignores the actual time and distance of commutes. If you have a 20-minute commute home but move at a lower speed, your commute scores worse than the person driving 80 minutes at a higher speed. Yet who has the better experience each day?

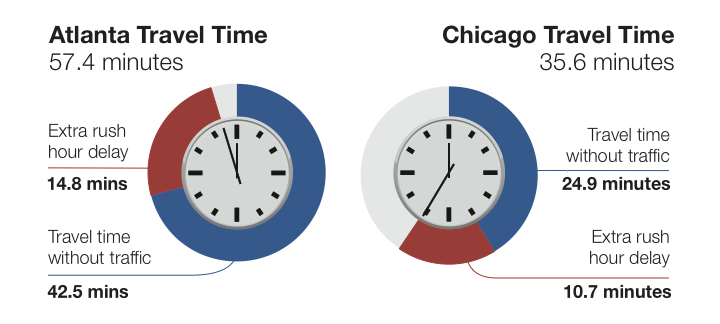
We share a graphic like this almost every time this report comes out, but it’s telling. According to this year’s Travel Time Index, Atlanta (1.24) is actually less congested than Chicago (1.31). Yet…

Chicago Atlanta travel time


In Chicago in 2007, the average peak hour car trip to work was 38% shorter (in time) than the 57.4 minutes it took Atlantans to drive to work in rush hour. Even the average non-peak commute in Atlanta in 2007 was longer than the average congested peak hour commute in Chicago.  A major reason for the better highway performance in Chicago is that drivers do not have to travel as far as drivers in Atlanta – 13.5 miles compared with 21.6 miles. Yet TTI rates Chicago worse.

Ranking congestion is fine, but what should we do about it? How can we manage congestion in the most cost-effective way possible given limited transportation dollars?

Doing more of the same certainly won’t solve the problem. Regions that have been aggressively investing in additional travel options, eliminating trips, reducing trip length, creating more places to live close to jobs or more effectively managing demand have seen their congestion numbers get better, according to this landmark CEOs for Cities report from a few years ago.

That’s why it’s so critically important that the rule for the congestion performance measure being developed by USDOT measure success (or failure) in ways beyond just this limited and flawed TTI measure. We do need a better measure of congestion if we want to avoid making the same decisions that got us into this mess.

How far do most people have to travel for work? How long does it take them? What is most effective at reducing the amount of time it takes to get places? How many people are exposed to the congestion? Congestion may be bad, but people telecommuting, in a vanpool or on a bike might not experience it. Credit should be given to areas that allow people to opt-out of the traffic. Those are the kinds of metrics we need to use in order to find real solutions.

The proposed rule for congestion being drafted right now by USDOT will lay out exactly how states and metro areas will have to begin measuring congestion — and measuring whether or not the projects they want to build will improve it. We’ve got some posts in the works that will discuss how some alternatives would work, so stay tuned on that front.

Updated: The quotes from the report’s author in this WAMU story from Washington, DC essentially acknowledge that their report is a limited measure of congestion, largely because it only focuses on auto commutes and ignores essentially everyone else.

In response to the coalition’s criticism, Lomax conceded the report’s methodology does not take into account non-car commuting modes.

“They have some good points,” Lomax said. “And they are points that we have included not only in our proposed solutions, but also in terms of our methodology.”

“We have backed away from trying to make estimates of what is happening on the transit side because we don’t have very good transit data. We don’t have good data about how people are walking. So we concentrated on where we have the data,” he said.

Here’s a sampling of other articles questioning the measures in the report and suggesting some better ways to measure a more accurate picture of congestion.

Telling only half the story of congestion, travel time and the quality of our metro areas

A popular study on traffic and congestion in our metropolitan areas is widely cited by the national, state and local media with every annual release, but it doesn’t tell the entire story. Far from it. That’s because measuring congestion while ignoring the actual time and distance spent commuting is a poor measure of what residents’ actually experience on a day-to-day basis.

The popular and oft-cited Texas Transportation Institute’s annual Urban Mobility Report isn’t an incorrect metric, it just tells half of the story. For starters, let’s consider two metros that appear to be ranked pretty close together in the latest report out today. Atlanta and Chicago appear to both be pretty miserable in regards to congestion, right? According to the 2012 Travel Time Index (pdf), they’re near the top with TTI scores of 1.24 and 1.25 respectively, and tied for seventh in yearly delay per commuter. (In 2009, Chicago’s TTI was 1.43 – 23% worse than Atlanta’s 1.35.)

That must mean that the commute is just as bad in both of these areas, right? Well, no.

Chicago Atlanta travel time

These statistics are from 2007, due to a limitation with how we can break down the TTI data.

Take an informal poll of your friends and co-workers: Who wouldn’t agree that a 35-minute commute is better than a 57-minute commute? Then why do we rely on measuring performance in a way that says the exact opposite? The TTI is almost the exact same for these two metros now, yet Chicago commuters had an average travel time of almost twenty minutes less than their counterparts in Atlanta a few years ago. That’s because TTI focuses only on how fast we can drive at peak while ignoring how far apart the destinations are in these two places.

In Chicago, the average trip to work is 35.6 minutes – 38% less time than the 57.4 minutes it takes Atlantans to drive to work. A major reason for the better highway performance in Chicago is that drivers do not have to travel as far as drivers in Atlanta – 13.5 miles compared with 21.6 miles. The amount of time it takes to go somewhere isn?t just about speed, that’s only half of it — it?s influenced both by how fast you travel and the distance you have to travel. Chicago and Atlanta are different places, so what about comparing an apple to an apple?

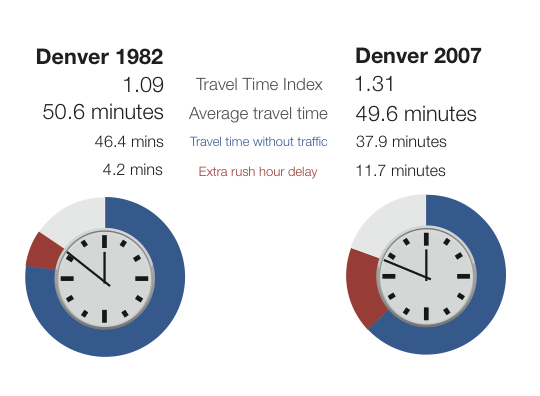
Denver, Colorado (8th worst TTI in 2012) has experienced a rebirth in its city core in the last decade or two, with residents flocking to new apartments and homes in the city center and close-in neighborhoods, attracted in part by the huge investment in regional transit. More people live near transit today in Denver than years ago, and with accompanying investments in new housing and jobs near transit and in more walkable neighborhoods, that means more people have shorter trips to get to work each day. Yet TTI shows that commuting in Denver is far worse in 2007 than it was 25 years ago. (TTI in 2012 is 1.27)

Denver 1982-2007 travel time 2

Look at the average travel time in 2007 in Denver compared to 25 years ago — it’s about the same. Rush hour delays have almost tripled, but the travel time without traffic (a good proxy for the average length of trips) actually decreased by almost ten minutes. Destinations are closer. Residents have more options. Commuters take shorter trips.

HPIM6863

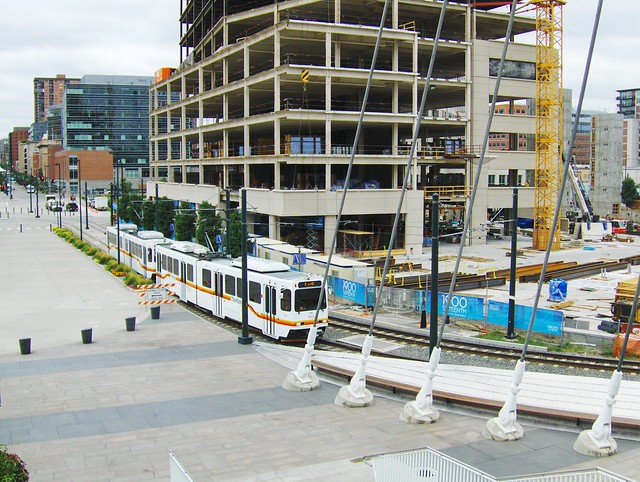
Denver downtown construction near light rail. Creative Commons Flickr photo by vxla ***

Relying solely on TTI to try and measure congestion and travel time in your city is like measuring only measuring two dimensions of a three-dimensional object. Like measuring the length and height of a new couch for your living room while ignoring the depth. The couch is 48 inches tall, but without measuring the depth, do you have any idea if it’ll fit through your front door?

This gets at the core problem with TTI — when cities and regions (or the USDOT) rely solely on TTI as the single measure of congestion and make all their decisions about future transportation investments based on only part of the whole picture, regions prioritize projects to reduce TTI or shave a few seconds off of rush hour delay.

Legislators, the Federal Highway Administration, state DOTs, and newspapers all use the Travel Time Index to measure highway performance. Then we spend millions or billions to build projects that lower this number, but we rarely get to work in less time.

As the nation shifts to a performance-based transportation system — beginning under MAP-21 — it is key that the first national performance measures get this right. Any national performance measure needs to allow communities to consider both factors — speed and distance.

There’s probably a handful of federal, state or local legislators looking at the headlines in their local newspaper today about congestion in their metro region. Maybe they’re saying “we’ve got to do something about this!” We need to do “something” — they’re right! But accurately measuring the problem is the only way to find an appropriate solution.

Let’s start there.