


New traffic congestion report raises more questions than it answers
Most people sitting behind the wheel each day won’t be surprised by the findings of the latest edition of the Texas Transportation Institute’s report on urban congestion that shows, once again, that (surprise!) the roads in most major American cities are very congested during rush hour each day. The report’s methodology is flawed, but what really matters most is what policymakers and citizens decide to do about congestion in their communities.
(Updated: 8/27/15 12:15 a.m. with other articles at bottom.) Once again, The Texas Transportation Institute is in the headlines today with the release of their Urban Mobility Report and its Travel Time Index (TTI), which purports to rank metro areas by congestion but is mostly disconnected from what commuters experience on a day-to-day basis.
While TTI is striving to provide easy to understand measures and rankings to the complex issue of traffic congestion, their methodology is once again drawing criticism on a number of fronts.
The report’s touchstone metric is a blunt measure of peak-hour speeds compared to an empty road in the middle of the night. Did you know that trips take longer during rush hour compared to the middle of the night? You did? The comparison of rush-hour to free-flow traffic begs the question about the goal: is it reasonable or even possible to build enough road capacity to keep traffic moving at free-flow speeds from 6-9 a.m. when the bulk of the populace is going to work? (Those free-flow speeds being used as the baseline comparison also exceed the speed limit in many cases, by the way.)
The economist Joe Cortright wrote a comical April Fools post that showed how silly that logic is when applied anywhere else, in this case, at Starbucks, where consumers lose “$4 billion every year in wasted time” because of long lines during busy mornings. Yet:
No one would expect to Starbucks to build enough locations—and hire enough baristas—so that everyone could enjoy the 15 second order times [at 9 a.m.] that you can experience when there’s a lull [at 9 p.m.]. Consumers are smart enough to understand that if you want a coffee the same time as everyone else, you’re probably going to have to queue up for a few minutes.
The report focuses only on drivers — not commuters as a whole. The millions of people using growing modes like transit, walking or biking or skipping the trip entirely by telecommuting at peak aren’t included in the analysis. So when the report says “person” or “commuter,” what they’re really saying is “car commuter.” The nearly 1 million trips taken per day in Washington, DC —#1 on the “list of gridlock-plagued cities — on metro (bus and rail) and therefore not in a car? Not included in this analysis.
Trips not taken can be crucial, yet they’re ignored here. In February 2009, Inrix, the company partnering with Texas A&M on this release, reported that just a 3.7 percent drop in vehicle miles traveled in 2008 resulted in a 30 percent drop in congestion in the 100 most congested metro areas. We don’t need everyone to shift their trip, take transit, move closer to work, or telecommute — among many possible options. But smart investments and incentives that lead to very small reductions in trips taken can have huge benefits in reduced congestion. And they’re often far cheaper than massive projects proposed to shave a few seconds off of average commutes.
Live close to where you work? Oops. Your short commute can come out looking worse than someone else’s much longer commute. TTI completely ignores the actual time and distance of commutes. If you have a 20-minute commute home but move at a lower speed, your commute scores worse than the person driving 80 minutes at a higher speed. Yet who has the better experience each day?
We share a graphic like this almost every time this report comes out, but it’s telling. According to this year’s Travel Time Index, Atlanta (1.24) is actually less congested than Chicago (1.31). Yet…
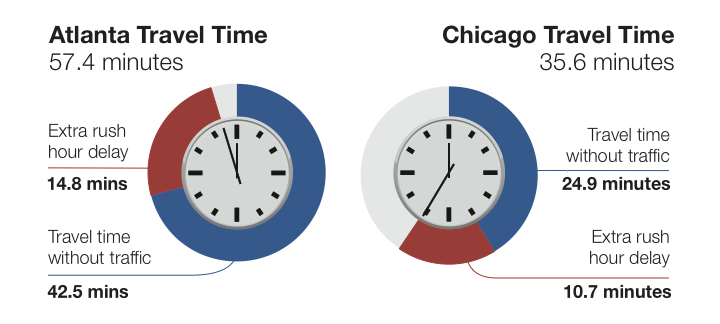
In Chicago in 2007, the average peak hour car trip to work was 38% shorter (in time) than the 57.4 minutes it took Atlantans to drive to work in rush hour. Even the average non-peak commute in Atlanta in 2007 was longer than the average congested peak hour commute in Chicago. A major reason for the better highway performance in Chicago is that drivers do not have to travel as far as drivers in Atlanta – 13.5 miles compared with 21.6 miles. Yet TTI rates Chicago worse.
Ranking congestion is fine, but what should we do about it? How can we manage congestion in the most cost-effective way possible given limited transportation dollars?
Doing more of the same certainly won’t solve the problem. Regions that have been aggressively investing in additional travel options, eliminating trips, reducing trip length, creating more places to live close to jobs or more effectively managing demand have seen their congestion numbers get better, according to this landmark CEOs for Cities report from a few years ago.
That’s why it’s so critically important that the rule for the congestion performance measure being developed by USDOT measure success (or failure) in ways beyond just this limited and flawed TTI measure. We do need a better measure of congestion if we want to avoid making the same decisions that got us into this mess.
How far do most people have to travel for work? How long does it take them? What is most effective at reducing the amount of time it takes to get places? How many people are exposed to the congestion? Congestion may be bad, but people telecommuting, in a vanpool or on a bike might not experience it. Credit should be given to areas that allow people to opt-out of the traffic. Those are the kinds of metrics we need to use in order to find real solutions.
The proposed rule for congestion being drafted right now by USDOT will lay out exactly how states and metro areas will have to begin measuring congestion — and measuring whether or not the projects they want to build will improve it. We’ve got some posts in the works that will discuss how some alternatives would work, so stay tuned on that front.
Updated: The quotes from the report’s author in this WAMU story from Washington, DC essentially acknowledge that their report is a limited measure of congestion, largely because it only focuses on auto commutes and ignores essentially everyone else.
In response to the coalition’s criticism, Lomax conceded the report’s methodology does not take into account non-car commuting modes.
“They have some good points,” Lomax said. “And they are points that we have included not only in our proposed solutions, but also in terms of our methodology.”
“We have backed away from trying to make estimates of what is happening on the transit side because we don’t have very good transit data. We don’t have good data about how people are walking. So we concentrated on where we have the data,” he said.
Here’s a sampling of other articles questioning the measures in the report and suggesting some better ways to measure a more accurate picture of congestion.
- City Observatory: Another Tall Tale from the Texas Transportation Institute
http://cityobservatory.org/another-tall-tale-from-the-texas-transportation-institute/ - Frontier Group: News Flash: Congestion Still Not Getting (Much) Worse http://www.frontiergroup.org/blogs/blog/fg/news-flash-congestion-still-not-getting-much-worse
- Brookings: Rethinking urban traffic congestion to put people first
http://www.brookings.edu/blogs/the-avenue/posts/2015/08/27-urban-traffic-congestion-puentes - Greater Greater Washington: Hey look, that flawed Texas A&M traffic study is back and grabbing the usual headlines
http://greatergreaterwashington.org/post/27908/hey-look-that-flawed-texas-am-traffic-study-is-back-and-grabbing-the-usual-headlines/ - Litman/Planetizen: 2015 Urban Mobility Scorecard: Still Measuring Urban Travel Conditions Incorrectly http://www.planetizen.com/node/80588/2015-urban-mobility-scorecard-still-measuring-urban-travel-conditions-incorrectly
Our three principles
It’s past time to elevate the national conversation about infrastructure beyond just the price tag.
Learn more about our platformLatest From The Blog


Progress for passenger rail in the South and…
Apr 10th, 2024


Building back better: Reflections on the state of…
Apr 9th, 2024
FTA helps deliver more buses for less
Apr 2nd, 2024

I cannot find the zoom link, I registered…
Jan 6th, 2024

A rare look behind the curtain of Transportation…
Jul 28th, 2023

In what Harrison Ford said was his most…
Jul 25th, 2023

Good example, walking to the local taco place…
Jul 24th, 2023

Pingback: Today’s Headlines | Streetsblog St. Louis
Pingback: Three views of traffic in Texas – Off the Kuff
Pingback: UPDATED (again): Another tall tale from the Texas Transportation Institute | City Observatory