
Divided by Design: Quantifying the damage of our transportation program

Our new report examines the racist roots of our current transportation system. Most importantly, it demonstrates how today’s policies and practices were shaped by the past, leading to racial disparities today. Without a fundamental change to the overall approach to transportation, today’s leaders and transportation professionals, no matter their intent, will perpetuate and exacerbate the damage.

Beginning in the 1950s, highways devastated communities of color and changed our cities forever. But the consequences continue, even as we begin to acknowledge our past mistakes.

To create a better system, we can’t settle for small changes. We need a total shift in approach. To learn more about the report and our analysis, join our webinar on July 25 at 2 p.m. ET.

Read the report Register for the webinar

A guide to this report

Part I examines the damage and inequities deliberately created by and in the federal transportation program from ~1950 onward. It concludes with a unique analysis of both an unbuilt and built highway segment within Atlanta and Washington, DC to quantify what was lost, who bore the brunt of the damage, and what could have been lost with highways that were never built.


Part II examines our current transportation program to demonstrate how the programs, standards, models, and measures have their roots in the previous era and exacerbate inequities—whether intentional or not.


Part III outlines what needs to change—concrete steps we can take to fundamentally reorient the program around unwinding those inequities.

Two cities divided

Divided by Design also quantifies the damage caused by highways in two U.S. cities: Atlanta, GA and Washington, DC. Like hundreds of others in the U.S., these cities are forever scarred by highways that demolished communities of color, robbing them of opportunity and potential.

Atlanta’s I-20 displaced over 7,500 people and destroyed 1,400 occupied homes. In DC, I-395/695 displaced over 5,000 people and demolished 2,200 homes. These numbers only scratch the surface of the full damage and dislocation.

More significant damage was also avoided in these cities. To understand what might exist in these communities if they hadn’t been disrupted by highways, we looked at two planned highway segments that were never built and the hundreds of businesses, office buildings, and homes that wouldn’t exist today. Click to read these stories:

The damage continues

The models, policies, and practices we use today took root in the highway era, and they continue to inflict the most harm on people of color. Our approach leads to worse health outcomes, greater congestion, and deadlier roadways. It leaves millions of Americans without access to reliable transportation options to get where they need to go. We can’t build a better system on a rotten foundation. It’s time for a paradigm shift.

We need a new approach.

Read Divided by Design

Explore the report’s full content—jump to one of the three parts with the graphics below.

report cover graphic showing a stylized highway cutting through a city.graphic showing a stylized scene of construction of a highway through a city neighborhoodgraphic showing a stylized scene a few blocks away from a highway running through a city neighborhoodgraphic showing a stylized scene of what a neighborhood could look like after tearing a highway down

Don’t miss supplemental maps, videos, and animations in the DC and Atlanta case studies which are not in the hard copy. Download a PDF version of the report.


New Community Connectors grant program and resources for advocates

A new grant program from Smart Growth America will help advance locally driven projects that will reconnect communities separated or harmed by transportation infrastructure and tap available federal and state funds to support them.

Removing divisive infrastructure is largely uncharted territory in the United States, but the need to fix the damage it has caused is imperative. Transportation infrastructure like divisive highways and dangerous arterial roads often separates and harms the communities living around them. This is particularly true for Black and Brown communities, who are more likely to live near large roads and have to live with the environmental, economic, and social harms they cause.

The movement to remove divisive infrastructure has often required communities to be pioneers and the lack of a roadmap and the nature of the work often meant that there were few others to easily learn from. The Community Connectors grant program aims to change that by providing financial resources to help build local capacity and advance these projects, but also by connecting local leaders to experts and other cities attempting to accomplish similar things.

Applications are due before July 15, 2023 at 11:59 p.m.

Who is eligible to apply for the program?

Community Connectors welcomes diverse, multi-entity project teams from small to mid-sized U.S. cities (between 50,000–500,000 in population) to apply for the program. Teams may consist of non-profit community-based organizations and advocates, government agencies (including U.S. territories), and tribes. For-profit entities may be part of the wider project team but are not eligible to receive any of the funds directly or indirectly disbursed through the grant or technical assistance.

What support will selected teams receive?

Selected teams will receive grants of up to $130,000 for capacity building and to advance their projects. In addition, the selected teams will also receive customized technical assistance and participate in a learning exchange program over the next 18-24 months, which includes an in-person convening in Atlanta, Georgia, in November 2023.

What kinds of projects are eligible?

We encourage teams to submit proposals for projects or concepts to reconnect communities separated or harmed by transportation infrastructure through an integrated transportation, land-use, housing and economic development approach. Applications for proposals at all stages are welcome. Teams are not required to have applied for or formalized an application for U.S. Department of Transportation programs.


The Community Connectors program is led by Smart Growth America in partnership with Equitable Cities, the New Urban Mobility Alliance, and America Walks and is supported by the Robert Wood Johnson Foundation.

Bonus: New tools for all “Community Connector” advocates

In coordination with this new grant opportunity, we have launched a brand new suite of resources to support all Community Connectors in communities of any size. These are the advocates all across the country who are working to reconnect their communities: fighting freeway expansions, advancing projects to remove old highways, making wide, dangerous arterial roads a little safer for people to cross, or just improving basic infrastructure people depend on each day.

While the new grant opportunity is limited, Transportation for America’s Community Connectors portal is for anyone, providing tools and information for advocates to decode the complex and confusing maze of programs, acronyms, and decision points that determine what gets built with federal and state transportation dollars.

Expect to hear much more about this new portal of resources. Our team will be regularly updating it with new explainers and stories over the coming months.

Want to get updates on new content? Be sure to sign up for our email list here.

What would a Green New Deal for transportation look like?

Current federal transportation policy is diametrically opposed to climate action. The Green New Deal framework released a year ago mostly left that unchanged. But a new report T4America contributed to fills in those gaps and gives transportation policy the same visionary makeover to show what we could achieve if our transportation and climate goals were aligned.

When the Green New Deal was first released last year, Transportation for America Director Beth Osborne had some pointed critiques.

The transportation sector is the largest source of greenhouse gasses in the United States and it’s also the one that federal officials have the most control over with the power of the purse. Yet the Green New Deal is largely devoid of the bold reimagining of federal transportation spending which encourages more roads, more driving, more sprawl, and more emissions.

The Green New Deal as originally introduced completely ignores the role development patterns play in driving the climate crisis and fails to align our transportation policy with our environmental goals and aspirations (to say nothing of what people actually want from our transportation system). Though the Green New Deal is a broad policy framework, that’s a glaring oversight for something billed as a comprehensive answer to climate change.

We also know that current federal policy is actively undermining any progress on achieving real climate progress. The way we distribute money incentivizes more road building and more driving. The amount we spend on transit is pitiful compared to the amount spent on highways. Americans want more transportation options, but are stuck with their cars. Electric buses would be welcome, but too many people can’t safely walk to the bus stop because our streets are designed to prioritize high-speed traffic over safety.

So what would our federal transportation policy look like if the Green New Deal reimagined it? How would we invest limited transportation dollars to align our environmental ambitions with our policy? In a new report that we contributed to—A Green New Deal for City and Suburban Transportation—we outline how federal transportation policy can reduce greenhouse gas emissions by:

  1. Putting the majority of Americans within walking distance of frequent, high-quality public transit by 2030, by providing agencies with operating assistance to run more buses and trains, expanding overall funding for transit projects, and encouraging transit-oriented development.
  2. Incentivizing and requiring communities to design transit-friendly streets and safe roadways for all users.
  3. Prioritizing roadway maintenance over expansion, and ensuring that any new road capacity meets environmental goals.
  4. Ensuring a “just transition” that creates secure, well-paying jobs and funds training and apprenticeship programs in the transit industry.
  5. Providing funding for research into barriers to equitable transit provision.
  6. Creating an EV incentive program weighted by income, geography, and vehicle size.

A better transportation system

Green New Deal done right provides an opportunity to break out of the status quo and do transportation better. It’s an opportunity to reevaluate our transit and roadway systems, invest in electric vehicles, and broaden our conception of frontline communities in this sector—namely, the suburban and urban communities where public transit service is sparse or non-existent and owning a personal vehicle is all but required.

We can use the transportation sector as a strategic lever toward a Green New Deal by tackling our highest sources of carbon emissions, putting millions of people to work upgrading and repairing existing infrastructure rather than building new roads. Bringing our road and transit systems into a state of good repair over the next 10 years could support or create over 6.6 million jobs across the U.S. economy.

By making our cities and suburbs easy and safe to navigate without driving, we’ll also equitably grow our economy. In an America with abundant transit and safe streets for walking, biking, and rolling, more jobs will be within reach of people with low incomes, and transportation costs will consume far less of their earnings. What’s more, with less driving we’ll have less congestion. Our expensive gambit to build our way out of congestion hasn’t worked, but a Green New Deal could.

By providing more options, we’ll enable millions of people to take advantage of jobs and opportunities throughout their cities and regions, reducing the current disparities in mobility linked to race, economic status, age, or ability. The incidence of asthma, cardiovascular disease, and other chronic ailments caused by car pollution—which disproportionately afflict communities of color—will fall.

Getting transportation and climate policy right

It’s striking that many climate plans almost completely ignore transportation and land use. But our new report makes it clear what a huge opportunity we would be squandering without more direct, visionary action with a Green New Deal.

We have an enormous opportunity to both reduce emissions and rethink our transportation system. Let’s focus on the outcomes we want to achieve, not just how much money we’re going to spend. We can’t keep doing the same old transportation policy. Download the full report to learn more.

The Congestion Con: You’ve been played

In a new report, The Congestion Con: How more lanes and more money equals more traffic, we show how our approach to curbing congestion with new and wider highways has failed. We have spent decades and hundreds of billions of dollars on highways in the name of beating back congestion, yet in all of the 100 most populous urbanized areas examined in the report, congestion has gotten worse as a result. The Congestion Con lays out a comprehensive look at congestion data, why our “solution” has failed, and what the federal government can do to correct course.

Widening I-85 from four lanes to eight lanes. (Image: NCDOT, Flickr)

In an expensive effort to curb congestion in urban regions, the U.S. has overwhelmingly prioritized one strategy: widening and building new highways. We added 30,511 new freeway lane-miles of road in the largest 100 urbanized areas between 1993 and 2017, an increase of 42 percent. That rate of road expansion significantly outstripped the 32 percent growth in population in those regions over the same time period.

Yet this strategy has utterly failed to “solve” congestion as our new report—The Congestion Con—makes abundantly clear.

All those new lane-miles haven’t come cheap. States alone spent more than $500 billion on highway capital investments in urbanized areas between 1993-2017, with a sizeable portion going to highway expansions. And the initial construction costs are just the tip of the iceberg. For roads that are already in good condition, it still costs approximately $24,000 per year on average to maintain each lane-mile in a state of good repair, creating significant financial liabilities now and for years into the future.

We are spending billions to widen roads and seeing unimpressive, unpredictable results in return. In those 100 urbanized areas, congestion has grown by a staggering 144 percent, far outpacing population growth. Further, the urbanized areas expanding their roads more rapidly aren’t necessarily having more success curbing congestion—in fact, in many cases the opposite is true.

Download the report

Why aren’t we reducing congestion?

First, the average person drives significantly more each year in these 100 urbanized areas. Vehicle-miles traveled (VMT) per person increased by 20 percent between 1993-2017. This increase in driving is partially due to how we have allowed these urbanized areas to grow: letting development sprawl, creating greater distance between housing and other destinations, and forcing people to take longer and longer trips on a handful of regional highways to fulfill daily needs. We should be addressing those sources of congestion, but instead, we accept more driving and more traffic as unavoidable outcomes that we must address through costly highway expansion. This is a significantly more expensive and less effective approach than reducing the need to drive or length of trips. And unfortunately, spending billions to expand highways can actually make congestion worse by encouraging people to drive more than they otherwise would, a counterintuitive but well-documented phenomenon known as induced demand.

Eliminating congestion is also simply the wrong goal. While severe congestion can have real negative impacts, congestion is also generally a symptom of a successful, vibrant economy—a sign of a place people want to be. Instead, we should be focused on providing and improving access.

The core purpose of transportation infrastructure is to provide access to work, education, healthcare, groceries, recreation, and all other daily needs. Congestion can become a problem when it seriously obstructs access, but may not be a major problem if it doesn’t. Car speeds—the main proxy measure for congestion—don’t necessarily tell us anything about whether or not the transportation network is succeeding at connecting people to the things they need, as efficiently as possible. Yet a narrow emphasis on vehicle speed and delay underlies all of the regulations, procedures, and cultural norms behind transportation decisions, from the standards engineers use to design roads to the criteria states use to prioritize projects for funding. This leads us to widen freeways reflexively, almost on autopilot, perpetuating the cycle that produces yet more traffic

What needs to happen: Five policy recommendations

We need to face the music: we are doubling and tripling down on a failed strategy. We cannot keep relying on the same expensive and ineffective approach. With discussions underway about the next federal transportation legislation—a process that only happens every five years—now is the critical time to make changes before we pour billions more into a solution that doesn’t work. This report recommends five key policy changes, many of which could be incorporated into the upcoming transportation reauthorization:

1) Reorient our national program around access—connect people to jobs and services instead of focusing narrowly on speed and delay.
2) Require that transportation agencies stop favoring new roads over maintenance.
3) Make short trips walkable by making them safe. Roads surrounded by development should be designed for speeds of 35 mph or under to create safer conditions for walking and biking.
4) Remove restrictions on pricing and allow DOTs to manage congestion.
5) Reward infill development and make it easier for localities. Stop rewarding sprawl with public highway investments and instead reward localities that seek more efficient ways of moving and connecting people.

Download the full report and join the conversation online using #CongestionCon.

Download the report

The inside scoop on Repair Priorities 2019

After the release of Repair Priorities 2019, we hosted a webinar in partnership with Taxpayers for Common Sense to talk about the findings and recommendations of our new report. During the webinar we heard from our own Director of Transportation for America, Beth Osborne, and Steve Ellis, Executive Vice President of Taxpayers for Common Sense, about why we need reevaluate our federal transportation policy (which governs how we spend money) before dumping more money into the same broken system.

We were also joined by two speakers from state DOTs working to prioritize repair with available funding. Jack Moran, Deputy Chief of Performance and Asset Management for the Massachusetts DOT, talked through the nitty-gritty of how MassDOT has set up a state transportation program that puts repair needs first and demonstrates accountability to the public. Dick Hall, Chairman of the Mississippi Transportation Commission, spoke about why and how Mississippi DOT has made a recent dramatic shift away from road expansion toward repair, including making a difficult decision to halt expansion projects already in the pipeline.

Watch the recorded webinar below and download your copy of Repair Priorities 2019.

Other related resources:

Forget the infrastructure plan — we don’t need it.
In a pointed opinion piece published by the Washington Post, Transportation for America Director Beth Osborne made the case for focusing on federal policy reform instead of a one-time infusion of more funding into a yet-to-be-defined infrastructure plan.

How to build a better state DOT
Smart Growth America took a long look at how current practices and policies at state departments of transportation (DOTs) lead to the construction of huge, expensive road projects (i.e. highways) as a ‘solution’ to almost every transportation problem and how they can do better. Governing Magazine also published a piece on the work with state DOTs that includes interviews with Beth Osborne and Washington State DOT Secretary Roger Millar.

Repair Priorities 2019 is here — and it shows that more money won’t fix our infrastructure problems

It’s infrastructure Week again and politicians are back at it, bemoaning our “crumbling roads and bridges” and insisting we must spend more to fix the problem. But we’ve got some cold water to throw on this pity party: Despite more transportation spending over the last decade, the percentage of the roads nationwide in “poor condition” increased from 14 to 20 percent.

That’s the headline from our new report—Repair Priorities 2019—which finds that states are neglecting repair and routine maintenance in favor of costly expansions and widenings. Even when given more flexibility by Congress to spend money as they see fit, states, on average, spent as much money expanding their road networks ($21.3 billion) as they did repairing their existing roads ($21.4 billion) each year.

In short, our infrastructure issues are more of a policy problem than a money problem.

As T4America Director Beth Osborne said in our release today, “While a handful of states are doing an admirable job putting their money where their mouth is by devoting the bulk of their federal dollars to repair, many other states are spending vastly more on expanding their roads or building new ones—creating new liabilities in the process—even as their existing system falls into disrepair.”

Download Repair Priorities for a state-by-state look at how states are spending their money and what it will take to fix the system. Then join us for awebinar on Wednesday May 15 at 3 p.m. ET/12 p.m. PT to hear from two state DOT officials about the findings.

Putting the (money) cart before the horse

Two trillion is the hottest number in Washington right now—it’s how much money politicians want to pump into a yet-to-be-fleshed-out infrastructure plan. Although they haven’t yet articulated what all that extra spending will actually achieve or how this money will be spent more responsibly than the hundreds of billions we spent over the last decade, they already know the price tag.

We need to #BuildForTomorrow, they say. We have a question: Build WHAT for tomorrow?

The scope of our vision and ambition should determine how much money we need to spend on infrastructure. And that vision should then be supported with thoughtful policy—not a blank check—that will make sure we achieve our goals.

Getting back on track

So what might thoughtful policy look like? For starters, we should give taxpayers an idea of what they’re paying for with clear, measurable outcomes—do we want to cut the number of roads in poor condition in half over the next six years? Reduce traffic fatalities by 60 percent? Decrease emissions by 70 percent? Define the vision and set some measurable goals first.

We could require states to use available federal funding—billions of dollars they’re given automatically every year—to fix the system before expanding it. We could establish a competitive funding program for new road capacity that requires a higher standard for asset management—just like we do for transit. We could require more frequent and diligent reporting so that taxpayers can hold their officials accountable.

What do all these ideas have in common? They’re about policy not money. Whether it’s a stand-alone infrastructure bill or our existing federal transportation program, policy is the key to fixing America’s infrastructure problem. It’s about time the policy makers took that to heart.

Download Repair Priorities 2019

Are we creating assets or liabilities?


New roads are often considered new assets, but by ignoring repair many states have let those assets become liabilities—as our upcoming Repair Priorities report shows.

Building new infrastructure is sexy—it’s a tangible sign of progress and officials get to cut ribbons. Policymakers often talk about new roads as economic “assets,” but they are more truthfully classified as liabilities, bringing decades of baked-in maintenance costs. Without a regular commitment to upkeep, these liabilities can break the bank.

As Repair Priorities 2019 will show next week, we have a lot of liabilities on our hands.

Look for the full report in your inbox on Tuesday, May 14. Then join us for a webinar on Wednesday, May 15 where we’ll dig into how states are spending their existing money, hear directly from a number of state DOT officials, and discuss our recommendations for fixing this looming financial crisis.

Register for the webinar

Not all states are in the same situation. Many states make responsible decisions to invest the majority of their money in repair. Other states are borderline irresponsible, spending vastly more on expanding new roads—and creating new liabilities—even as their existing system falls into disrepair. Much of this money comes directly from the federal government with little to no direction about how those funds should be spent.

In the midst of ongoing talk about a purported infrastructure plan—notably, all the talk is about funding levels, not what we want it to actually accomplish—and as Congress begins crafting a long-term replacement for the expiring FAST Act, Repair Priorities will be a wake up call.

More funding won’t fix our infrastructure problem without a serious change in priorities.

Register for the webinar next Wednesday at 3 p.m. ET/12 p.m. PT.

Is repair actually a priority?

While politicians are focused on how much more funding we should give to infrastructure, our upcoming report sheds light on how states are using existing funding for repair vs. new roads and how policy can get the nation back on track.

Earlier this week, President Trump, House Speaker Pelosi, and Senate Minority Leader Schumer met to discuss funding levels for a yet undefined infrastructure plan.

We don’t know what the plan will fund or build, what problems it’s trying to solve, or how we will measure its success—if at all—but politicians have somehow already settled on a $2 trillion price tag.

This is the standard practice on Capitol Hill when it comes to infrastructure, and we believe it’s time for a change.

Much of the rhetoric around this mythical infrastructure plan has focused on “repairing our crumbling roads and bridges.” But if past decisions are the best predictor of future behavior then much of any extra transportation spending will likely be squandered on building and expanding roads rather than repairing them—as we show in our forthcoming report, Repair Priorities 2019.

Repair Priorities 2019 will be released during Infrastructure Week on Tuesday, May 14. Join us for a webinar on Wednesday, May 15 at 3 p.m. ET for a closer look at the findings.

Register for the webinar

Despite the growing maintenance backlog, states have continued to spend a significant portion of funding to build new roads. Repair Priorities 2019 provides a national snapshot and state-by-state evaluation of current roadway pavement conditions, spending trends, and unmet needs. It also recommends crucial actions federal policymakers should take in the next transportation reauthorization bill to get the nation’s roads—and spending priorities—back on track.

As we have said repeatedly, when it comes to infrastructure we don’t have funding problem, we have a policy problem. But policy makers are still putting the cart before the horse, jumping straight to how much of our money they need before telling us why or what we’re going to get for it in the end. Repair Priorities will help make the case for policy change using the government’s own data.

Register for the webinar on Wednesday, May 15 at 3 p.m. ET.

Taming the TIGER: Trump turns innovative grant program into another roads program

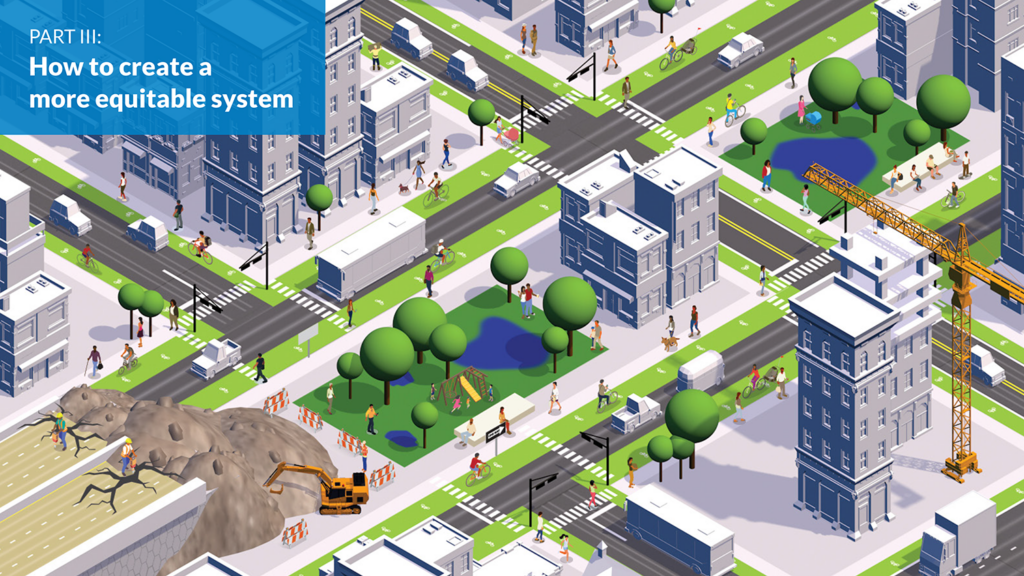
Under President Trump, the U.S. Department of Transportation has effectively turned the formerly innovative BUILD program—created to advance complex, hard-to-fund projects—into little more than a rural roads program, dramatically undercutting both its intent and utility.

Following this week’s announcement of an 11th round in BUILD competitive grants ($900 million) available to almost any public entity for transportation projects, Transportation for America is releasing this new comparative and constructive critique of USDOT’s BUILD program (formerly known as TIGER) in three parts. Up first today, what we found after examining ten years of awards. Read the second post in the series or download the full analysis.

The Better Utilizing Investments to Leverage Development (BUILD) program has been one of the most popular and impactful transportation programs in the federal arsenal. Conceived during the first few months of the Obama administration at the height of the financial crisis in 2009, the program originally bore the name TIGER: Transportation Investments Generating Economic Recovery.

This unique program was powerful precisely because of how it differed from most other federal transportation programs.

The program is uniquely popular because of its flexibility.
Funds can be awarded to any public entity—like a city government, public university, or tribal government—and can fund almost any kind of transportation project—roads, bridges, transit, freight, ports, bike, pedestrian, or any combination—in a wide variety of contexts. Given that most federal transportation programs award funding to state DOTs and restrict funding to one particular mode, the BUILD program has provided a much needed avenue for local entities to finance multimodal or complicated projects that cross numerous jurisdictional lines.

The program’s competition resulted in projects with greater benefits.
Unlike nearly all federal transportation dollars that are awarded automatically by formulas based on population, lane-miles, or other simple criteria, USDOT receives, scores, and awards BUILD funding based on the extent to which projects improve safety, state of repair, economic competitiveness, quality of life, and environmental sustainability. If you have a great project that’s multimodal, crosses city lines, and includes multiple partners, BUILD is an opportunity to fund it—and often the only way to do so with direct federal resources. Over the 10 rounds of the program so far, USDOT received more than 8,443 applications from all 50 states and U.S. territories requesting more than $156 billion in funding.1

The program encouraged more non-federal investment in transportation.
Since 2009, the program has awarded nearly $7.1 billion to 554 projects across the nation, leveraging billions more in non-BUILD funding. Over the first eight rounds, on average, projects attracted more than 3.6 additional, non-federal dollars for every TIGER grant dollar.

The focus has shifted since the Trump administration took over the program

A program which once heavily funded multimodal, transformative projects of regional and national significance which would otherwise be difficult to fund is now focused on expanding road capacity with an extreme bias for projects in rural areas. By comparing the projects selected for funding over the last 10 years and their level of funding, we identified four dramatic shifts in the program.

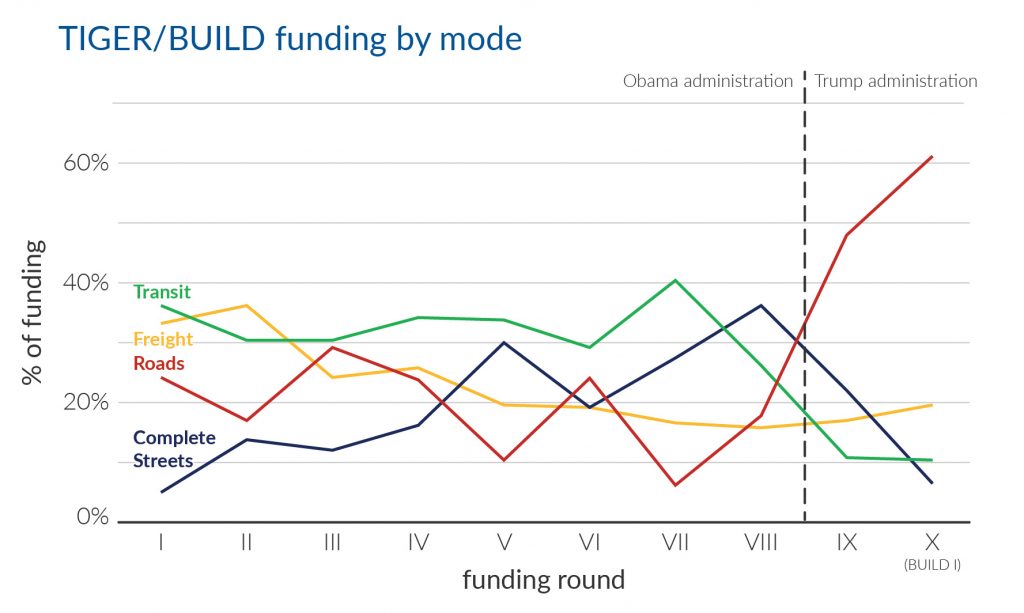
More roads, less multimodal

In the two most recent rounds of TIGER/BUILD awards—the first two years the program was managed by the Trump administration—only about 10 percent of funding went to transit projects. This is a big departure from the previous eight years when transit projects received between 28 and 40 percent of funding. Conversely, the share of funding dedicated to traditional road projects has grown to all-time highs; in 2018, road projects—most of which are eligible to receive normal formula dollars from their state—received more than 60 percent of the funding for the first time, after hovering below 30 percent for years.

While the name of the program may have been changed to BUILD in 2018, the congressional intent did not change. The small amount of funding for multimodal projects is inconsistent with the law which directs USDOT to invest “in a variety of transportation modes.”2 TIGER was created in part because most federal transportation dollars are already focused on roads via the highway formulas.

If a road project didn’t rank high enough to be funded from a state’s share of the $42 billion guaranteed to be spent annually from the Highway Trust Fund, it likely isn’t essential and shouldn’t displace other more creative projects that can’t be funded through conventional federal transportation programs.

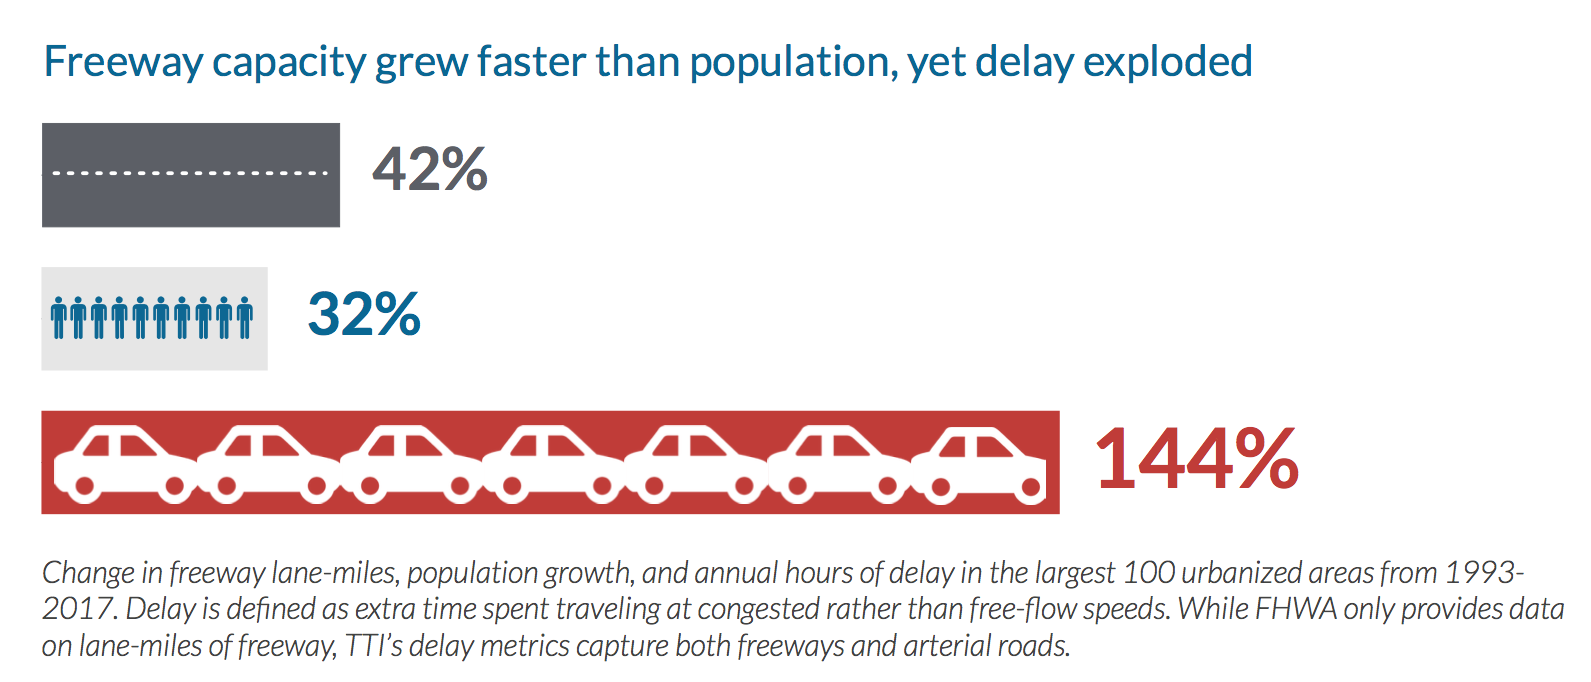
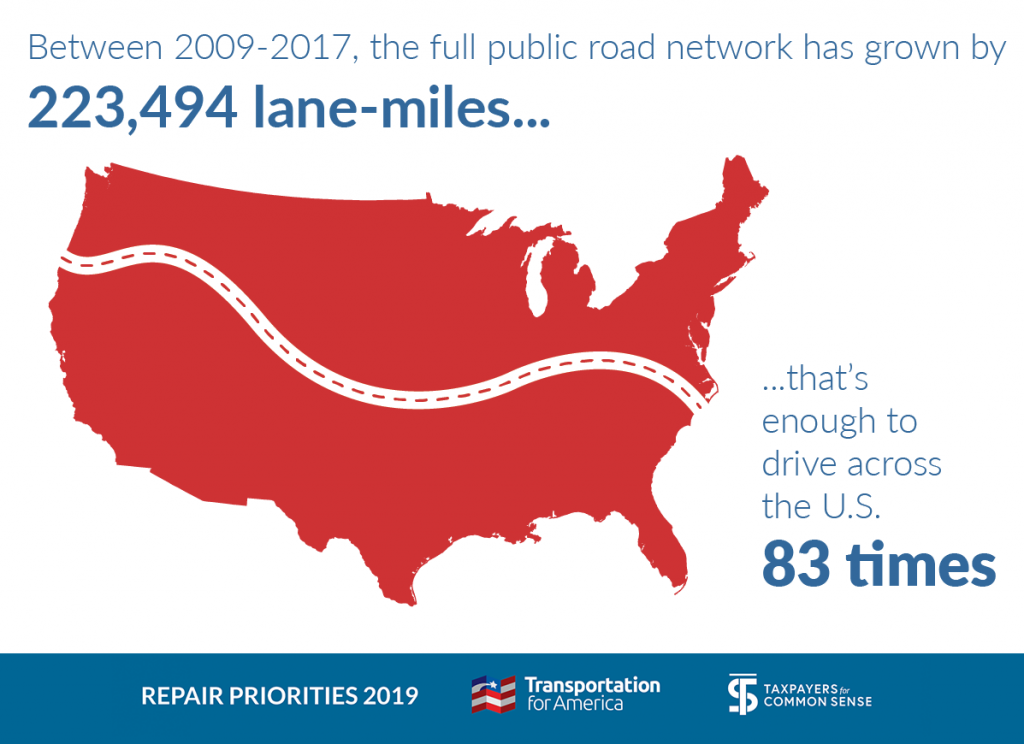
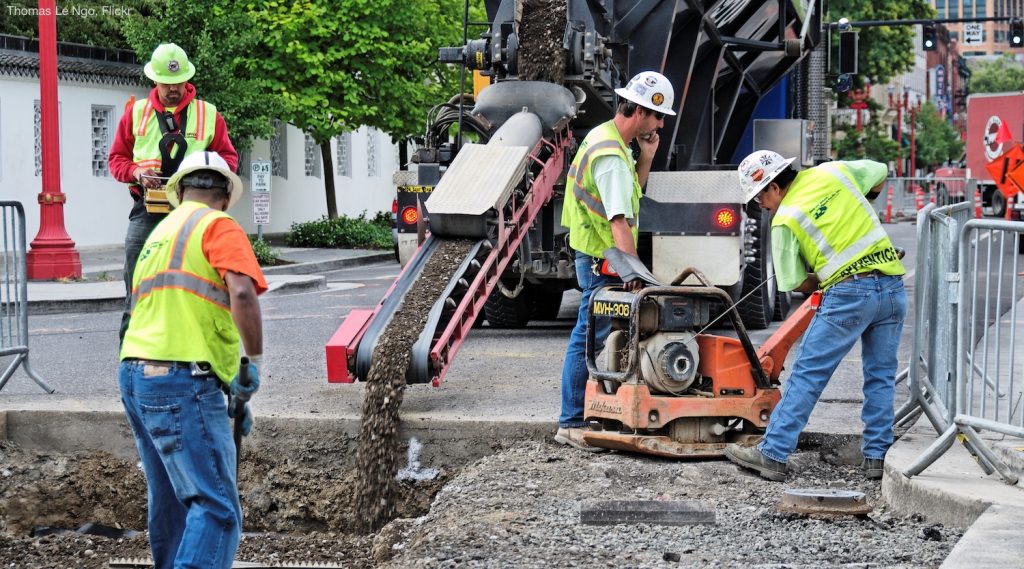
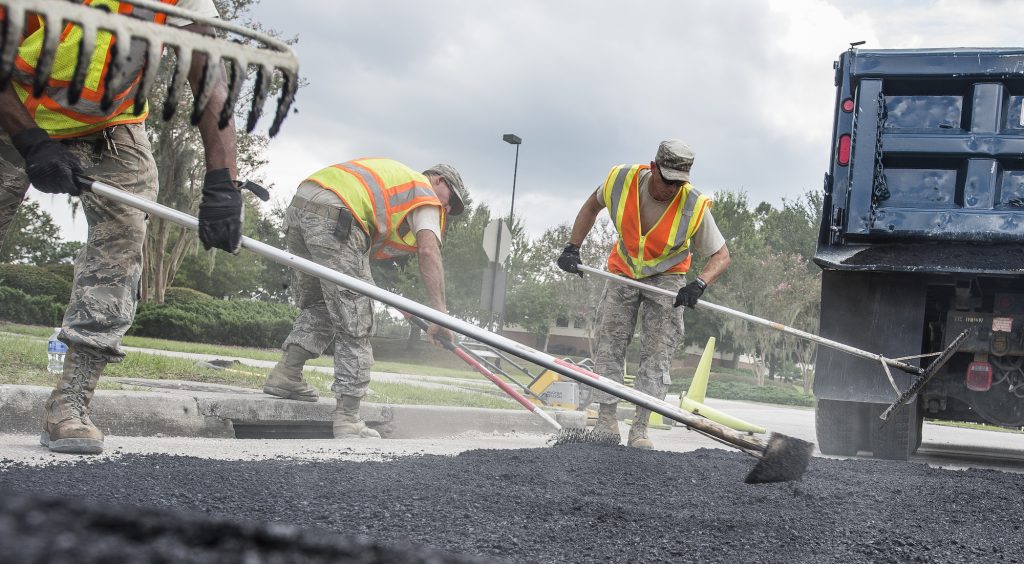
More capacity, less repair

A closer look at the road projects selected over the years shows that the Trump administration has focused more heavily on capacity expansion (i.e. new roads and road widenings) versus repair and bridge replacement. The first year of BUILD (round X) set two records: not only was a record share of total funding devoted to roads, a record percentage of that funding (70 percent) was dedicated to capacity expansion.

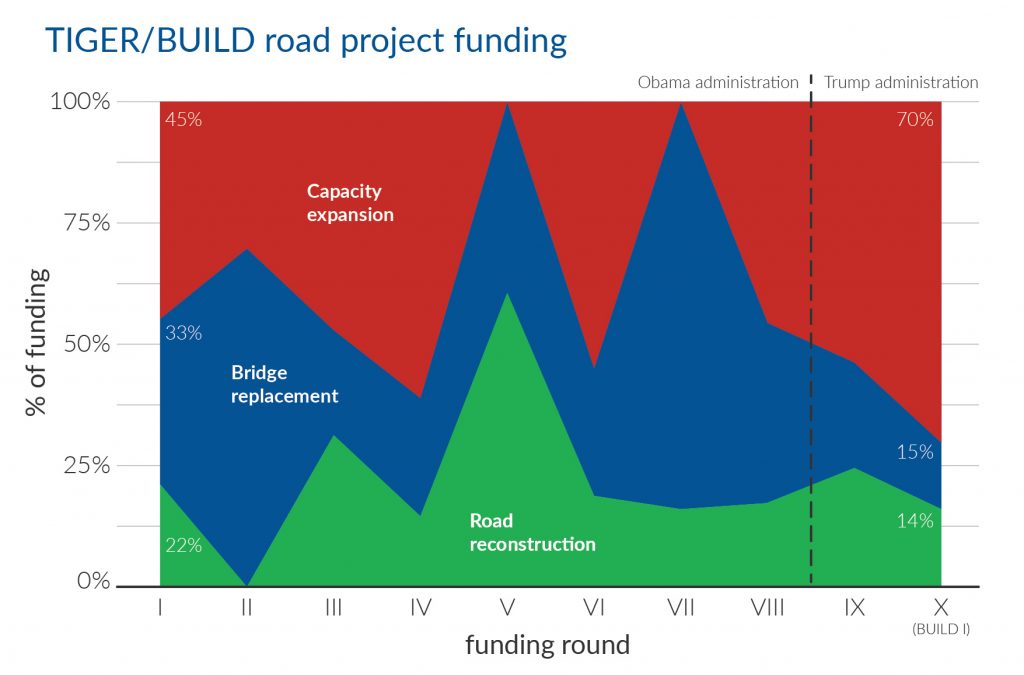
Note: this graphic only includes projects that were categorized as “roads” in the first graphic above. It does not include complete streets projects.

While policymakers of all stripes echo the constant refrain of “repairing our crumbling roads and bridges,” the Trump administration has prioritized doing the exact opposite with the BUILD program, largely opting to build new infrastructure (increasing the amount of infrastructure that needs to be maintained) rather than focusing on caring for our existing assets.

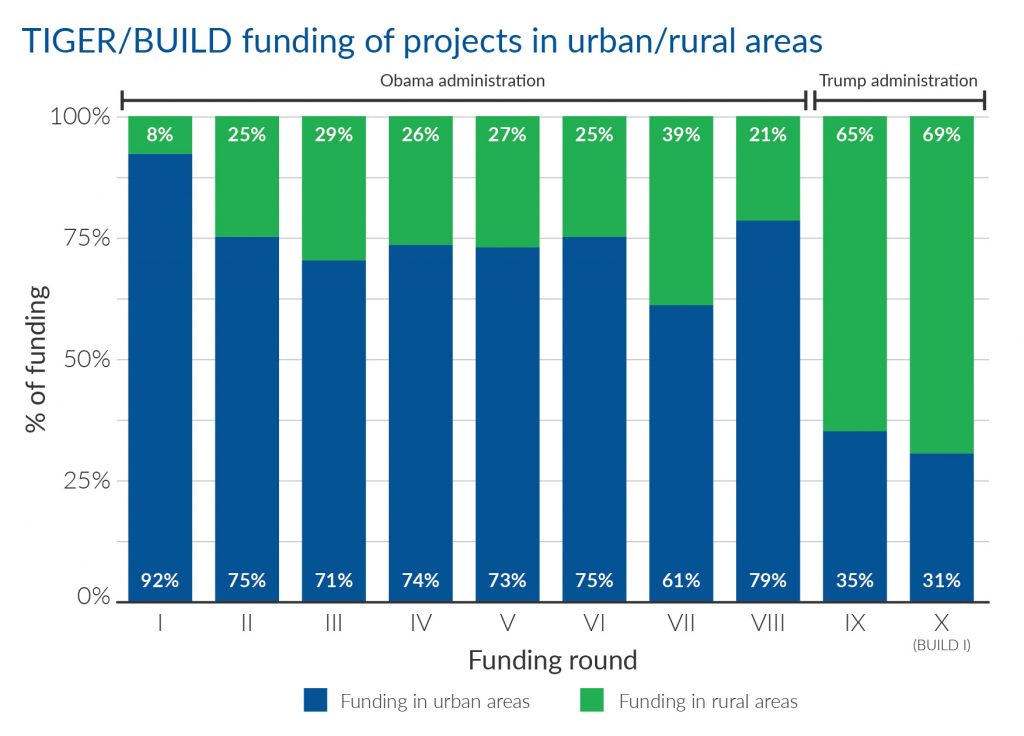
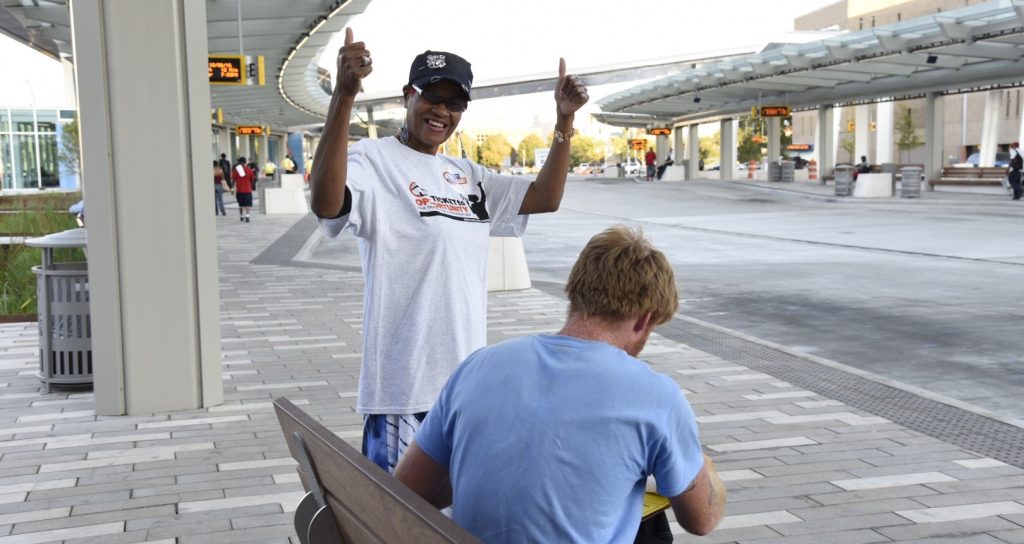
More rural, less urban

The past two of years of awards have disproportionately favored rural areas. While rural areas certainly deserve transportation investments, they should be proportional. The U.S. Census Bureau found that in 2016, approximately 19 percent of Americans lived in rural areas while 81 percent of Americans lived in urban areas.3 Reflecting where most Americans live, during the first eight years of the TIGER program (2009-2016) projects in urban areas received, on average, 75 percent of funding. Yet in the past two rounds of the program, projects in urban areas have only received an average of 33 percent of funding.

When providing BUILD funding in the last two appropriation bills, Congress directed USDOT to fund projects in rural and urban areas “to ensure an equitable geographic distribution of funds.”4 Disproportionately awarding grants to projects in rural areas is hardly equitable and is inconsistent with the intent and letter of the law.

Critics often complained during the earlier years of the program that it was too urban-focused based solely on the location of the chosen projects. However, many projects classified as urban were actually projects of national significance that have great utility and benefits for rural areas. For example, Port of New Orleans Rail Yard Improvements were funded during TIGER II “to reduce congestion, facilitate the movement of marine and rail cargo, stimulate international commerce, and maintain an essential port.” This project brings immense benefits for the city, the rural areas around it, and the country even though it was classified as an “urban project.” It creates jobs in New Orleans at the port and moves exports like poultry, paper, and pulp to market, a critical need for farmers and manufacturers across the country.

While the Trump administration has made investment in rural communities a key talking point, USDOT’s project selection reflects a very narrow and overly simplistic understanding of what can actually help those communities. Projects that get goods from rural America to market are left off the table just because they might be located in an urban area.

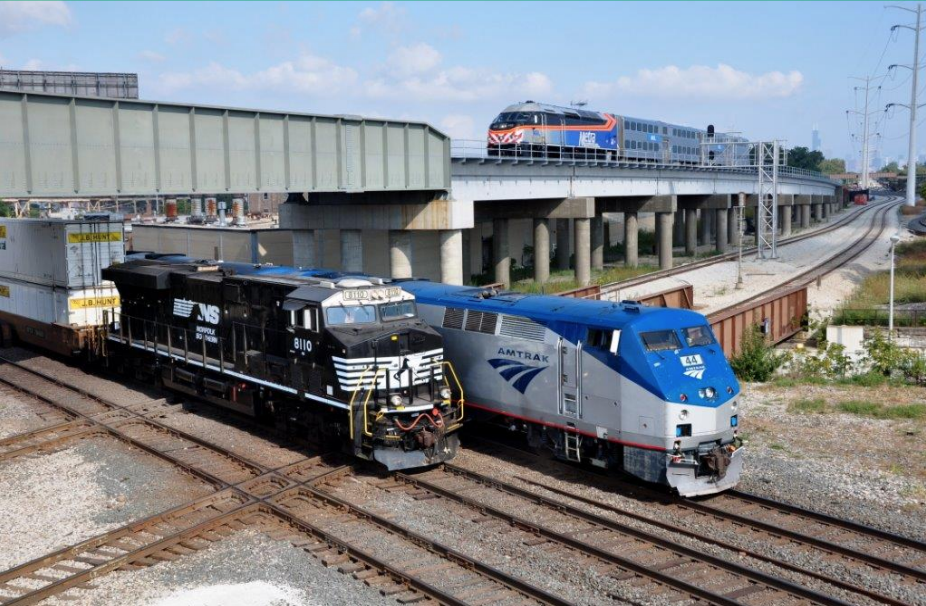
A new rail flyover at 63rd and State in Chicago that eliminated an at-grade crossing. TIGER I provided $100 million to a package of rail infrastructure projects in the Chicago region known as CREATE. While classified as an urban project, CREATE is addressing a series of bottlenecks that result in passenger delays in Chicago and freight delays throughout the country, bringing benefits to urban and rural communities alike across the region, state, and country. Photo by Mark Llanuza.

More funding for state DOTs, less for anyone else

One of the greatest strengths of the BUILD program is that it’s one of the few ways for local governments (or any public entity) to directly receive transportation funding from the federal government to advance their own priority projects, without having to go hat-in-hand to the state. If a municipality or public transit agency conceives of a great project that ticks the required boxes under the law—and if they can identify a local matching contribution—BUILD funding is an option.

Most other federal transportation funds are directed to and controlled by state DOTs. (A smaller share goes to regional metropolitan planning organizations.) As most mayors or other local elected leaders know from firsthand experience, a state DOT’s priorities for spending within their community’s borders are often not the same.

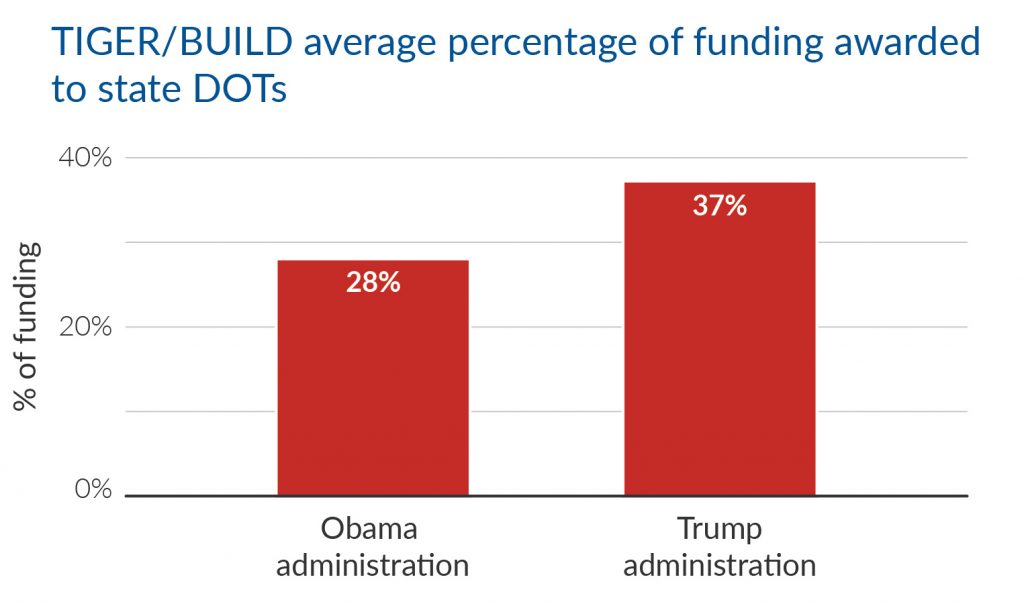
Under the Trump administration, more funds have been going to state DOTs—an average of 37.5 percent awarded to state DOTs compared to 28 percent under the Obama administration.5

Up next, our recommendations for re-BUILDing the program in the second post. Or download the full analysis.

Want to get updates on reports like this? Sign up for email from T4America.

SIGN UP

Sean Doyle was the primary author of this report for Transportation for America, with contributions from Beth Osborne, Scott Goldstein and Stephen Lee Davis.
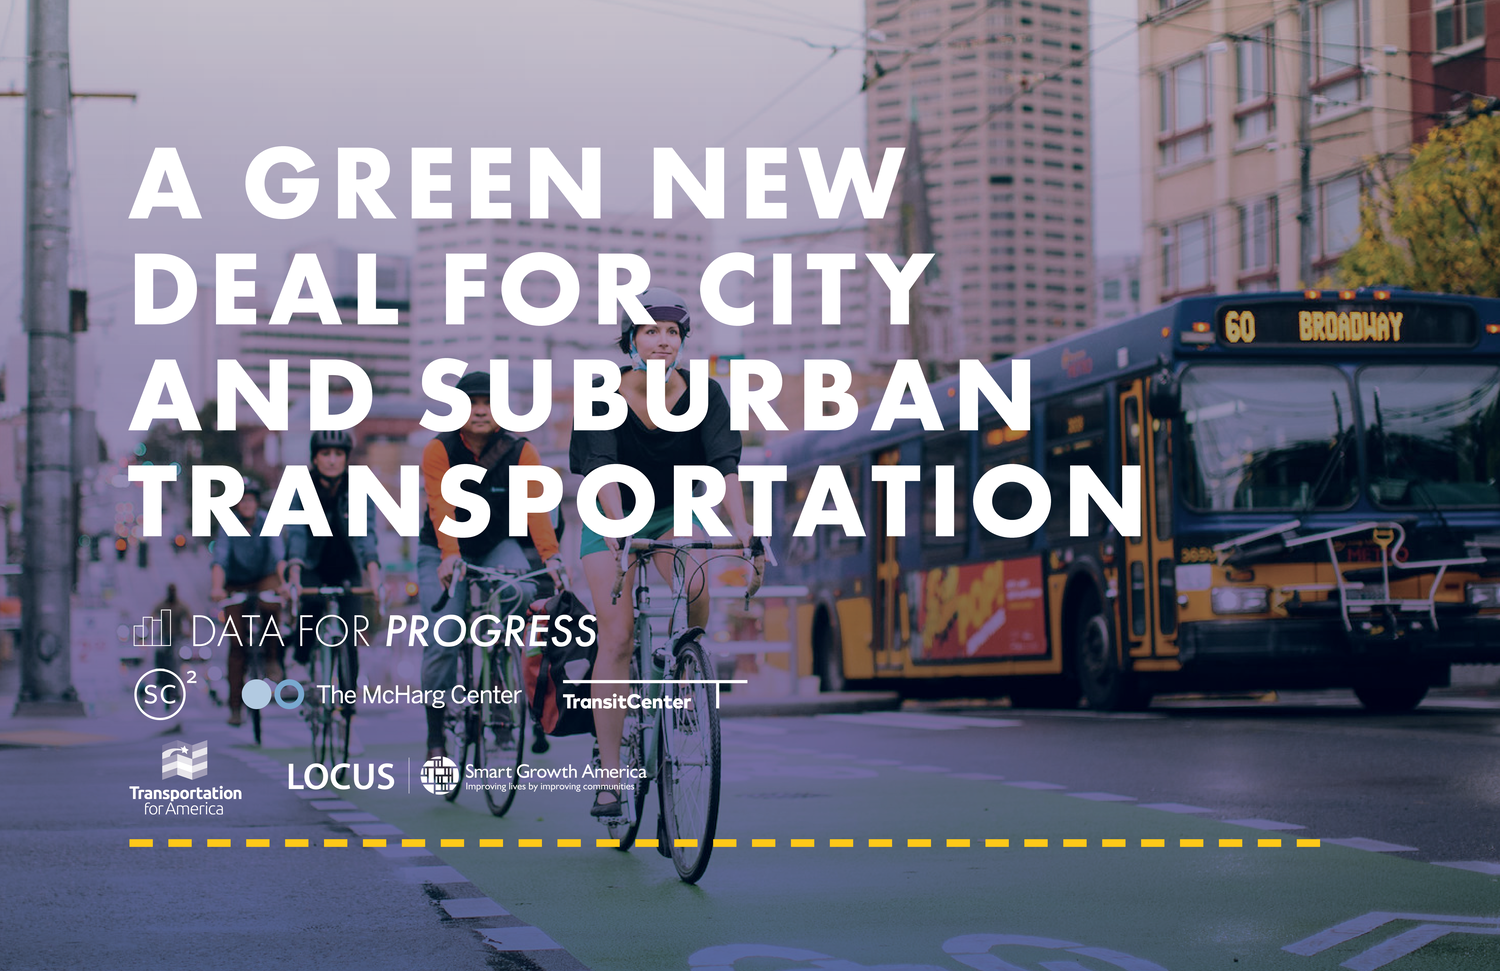
Exclusive Resources from T4A Micromobility Playbook

Produced in collaboration with 23 cities, Transportation for America released a new “Playbook” in January to help cities manage shared micromobility services like dockless bikes, electric scooters, and other new technologies that are rapidly being deployed across the country. The Shared Micromobility Playbook is intended to help cities better understand their policy levers and explores the core components of a comprehensive shared micromobility policy for local governments.

If you want the information from the playbook in a more digestible form, or are delivering a presentation to others about this issue, use our slide deck. If you want a T4A staffer to help you understand the playbook, or are interested in having someone do a presentation about it in your community, reach out to us!

Catch up with the launch discussion of our new guide for improving & expanding transit

Catch up with yesterday’s launch webinar for T4America’s new guidebook, Fight for Your Ride: An advocate’s guide for expanding and improving transit, which offers tangible ways to improve transit in your city and region.

Quality transit service is increasingly becoming a “must-have” for economic development. Amazon’s HQ2 search is only the most public example of major businesses choosing locations with quality transit to expand. Quality transit is also vital to improving access to jobs and opportunity and creating pathways to prosperity for residents in your region. But how can business leaders, local elected leaders, or transportation advocates improve their local transit service?

T4America’s new guidebook, Fight for Your Ride: An advocate’s guide for expanding and improving transit, offers tangible ways you can make these needed improvements to transit in your city and region.

On a webinar to release the guide earlier this week, two local transit leaders—Karen Rindge, Executive Director of WakeUp Wake County in the Raleigh, NC area, and Christof Spieler, board member for Houston METRO—presented lessons from their successful transit initiatives. View the full webinar here:

Fight for Your Ride includes tactical guidance on how to build your coalition, how to hone your message, and how to advocate to your federal representatives. On the launch webinar, Karen Rindge shared her firsthand lessons from organizing a coalition and successful campaign in Wake County.

Rindge explained that the most important asset that helped power Wake County’s transit referendum campaign was a broad and diverse coalition. WakeUp didn’t wait until a referendum was on the ballot to build this coalition, but began nearly ten years ago engaging key partners in the effort to develop a regional transit plan and build up community support for new investments in transit. Having partners who could talk directly to different constituencies—like seniors, environmentalists, and African-American communities—allowed the campaign to cut through the crowded campaign news cycle and directly inform key voters about the referendum.

Fight for Your Ride also helps to diagnose transportation challenges in your region and offers examples of how other regions have made improvements to transit. The guide illustrates more than a dozen different approaches. Some, like building new transit lines, carry a large price tag and will take years to complete. But many of the solutions offered in the guide are smaller and can be implemented much more quickly. These include adding late night transit service, speeding buses through congested chokepoints, reducing fares for low-income youth riders, adding shuttle service to reach job sites, and realigning transit service.

On the webinar, Christof Spieler offered an example of this last tactic, presenting the story of how Houston Metro reimagined their bus system map to provide better service for riders without more funding.

Speiler explained that for METRO to change its service map, it first had to acknowledge that it was not providing useful service to all potential riders across the region.

It wasn’t that Houstonians wouldn’t ride the bus—data showed that on commuter corridors with quality bus service, more that a third of commuters were already choosing transit. But many dense corridors outside of downtown lacked frequent service, or were served by meandering routes that were too confusing for anyone except daily riders to understand. Spieler described the effort he and METRO’s leadership led to reroute all of Houston’s bus routes, all at once, to offer quality, frequent service across the city. He spoke about the obstacles they faced and how political support was critical for moving the new plan forward.

As he closed, Christof reminded us that improving transit is about more than just the right techniques or strategies — we have to be storytellers too.

“We need to talk about transit,” he said. “The more we tell the story of what transit does well, the more we tell the story of how to make transit effective, and the more we keep this on the front of people’s minds, the more success we’ll have in getting things done.”

We hope you will use Fight for Your Ride to plan efforts to improve transit in your community. We can help by leading workshops or leadership academies in your region to bring together diverse leaders and organize a transit improvement or turnaround plan.

Read the guide.

Fight for your ride: An advocate’s guide for expanding and improving transit

In their search for a second HQ site, Amazon’s essential requirement for high-quality transit was, in the words of Laura Bliss at The Atlantic, “a come to Jesus moment for cities where high-quality service has long been an afterthought.” In many regions, the public transportation service just isn’t up to the task, offering infrequent, slow service and poor access to job centers or critical destinations—turning away potential riders and punishing those who must rely on transit.

But long before Amazon’s kick in the pants last year, scores of community leaders, business leaders, local elected officials, and grassroots advocates have been looking for ways to change the status quo. Many are eager to improve their local transit systems to speed up commutes, expand access to jobs and opportunities, attract and retain businesses and talent, and grow their economies.

This Transportation for America guidebook, Fight For Your Ride: An advocate’s guide for improving & expanding transit, offers local advocates and transit champions practical advice for making real improvements to public transit. Drawing examples from successful campaigns and reform efforts in small, medium, and large cities across the country, the guide illuminates effective ways to speed up transit, expand its reach, and improve service for riders. It offers tactical lessons on building a coalition, developing an effective message, and organizing a campaign for better transit in your community.

Download your copy now >>

Coming soon: A new report on how metro areas are building more and better bicycling and walking projects

Metro areas of all sizes across the country are strategizing, developing, and implementing new ways to improve bicycling and walking in their regions. Over the last year, T4America worked with metro areas across the country to collect and document these stories, ideas, and strategies into a guidebook that we’re releasing on December 11.

Join us on December 11th at 12 p.m. EST for a launch webinar where we’ll release Building Healthy and Prosperous Communities: How Metro Areas are Building More and Better Bicycling and Walking Projects and hear from three of the agencies featured in it.

Over the last two years, Transportation for America, in conjunction with the American Public Health Association, has worked with metropolitan planning organizations (MPOs) across the country to collect and document stories about how they are planning, funding and building more and better walking and bicycling projects in communities. (Find our previous resources on this topic here and here.)

As the gatekeepers of billions of federal transportation dollars, MPOs have an influential role in expanding and improving options for walking and bicycling. They may establish policies, develop plans, direct funding, and help design transportation projects to allow more people to easily walk, bicycle, or ride in a wheelchair. Doing so can help people get the physical activity they need to be healthy — and healthier residents bring economic benefits for an entire region.

Places that have made biking and walking from place to place a safe, convenient, and enticing choice have produced positive impacts on businesses, jobs, and revenue. When it’s safer and more convenient for people to walk or bicycle as part of their regular routine,  more people get the amount of physical activity that science proves they need to reduce their risk of certain chronic diseases.

The following MPOs and scores of others are excelling, but there’s much more that can be done to build the necessary infrastructure to keep people thriving, safe, active, and connected to the places they need to go. The examples in this guidebook can inspire and inform your efforts, help tailor them for your region, and improve upon them to give the residents of your region the bicycling and walking infrastructure they demand and deserve.

The guidebook has detailed profiles of the work of these metropolitan planning agencies:

  • Atlanta Regional Commission (Atlanta, Georgia)
  • Broward MPO (Broward County, Florida)
  • Chattanooga-Hamilton County/North Georgia Transportation Planning Organization (Chattanooga, Tennessee)
  • Corpus Christi MPO (Corpus Christi,Texas)
  • Delaware Valley Regional Planning Commission (Philadelphia, Pennsylvania)
  • Denver Regional Council of Governments (Denver, Colorado)
  • Mesilla Valley MPO (Las Cruces, New Mexico)
  • Metro (Portland, Oregon)
  • Metropolitan Transportation Commission (Bay Area, California)
  • Nashville Area MPO (Nashville, Tennessee)
  • Mid-Ohio Regional Planning Commission (Columbus, Ohio)
  • Puget Sound Regional Council (Seattle, Washington)

During the webinar we’ll hear from three featured MPOs: The Chattanooga TPO will share how they created a new performance measures framework to prioritize multi-modal projects for funding. The Corpus Christi MPO will talk about how they customized a Bicycle Mobility Network through accessibility planning and community engagement. Finally, we’ll hear how Metro in Portland, Oregon encouraged higher rates of active transportation by changing the design of walking and bicycling projects.

Register today!

New report: Transit funding supports manufacturing jobs from coast to coast

Public dollars devoted to making capital improvements to public transportation systems support thousands of manufacturing jobs, in communities small and large, in nearly every state across the country.

This new short paper from T4America examines the supply chain for public transportation, and illustrates how proposed cuts to federal transit funding threaten thousands of manufacturing jobs at more than 2,700 suppliers from coast to coast.

The supply chain for public transportation is as deep as it is wide, touching every corner of the country and employing thousands of Americans who produce everything from tracks, to seats, windows, communications equipment, wheels and everything else in between. As just a snapshot, recent capital improvements made in just four transit systems — San Francisco, Denver, Chicago, and Portland — supported jobs in 21 states.

Heavy cuts to federal transit spending, as proposed by Congress, would have a devastating effect on these local businesses and the tens of thousands of jobs they support. Without continued federal support, transit projects underway could stall, new or planned projects would be postponed or canceled, and transit agencies would scale back or cancel orders of new railcars or buses. The factories and suppliers that produce or manufacture components for transit systems would have to downsize or shutter without a steady pipeline of projects.

To preserve these jobs and support main streets from coast to coast, Congress and the administration should support and fund the Transit Capital Investment Grants (CIG) Program at or above FAST Act levels of $2.3 billion.

View the full report here, which includes a handful of maps and graphics, and rankings of the top ten states and congressional districts by the number of transit manufacturers located within their borders.

What’s at stake for small and rural transit providers?

Federal transit funding is still on the chopping block. Those who operate or depend on transit — whether in small, rural areas or large, urban ones — must band together to convince both Congress and the President of the vital nature of public transportation services.

While we’ve frequently highlighted the ongoing, existential threats to the main source of federal funds for helping cities expand or create new public transportation lines or service, smaller cities and rural areas are also at risk of funding reductions, phase-outs or the total elimination of vital programs they depend upon.

In this new detailed memo (pdf), T4America lays out the specific threats facing rural areas and explains Congress’ and the administration’s efforts to cut or eliminate vital funding programs for public transportation. Get the full summary on:

  • What the president has proposed and the status of the current appropriations process
  • What you can do today
  • Formula transit programs, Small Starts, the TIGER competitive grant program, and
  • The outlook for the transit program

Transit providers of all sizes, in all parts of the country, should band together and start making the strongest possible case for preserving the federal transit program. Read our full summary and learn how you can take action.

Join us on October 23 for a live webinar discussion

Our team of experts will discuss rural transit providers, the projects that are at risk from these cuts, and what you can do to defend transit in your region. Join the live discussion on Monday, October 23, 2017  from 3:00-4:00 p.m. EDT. Register today.

Register for the webinar

How are metro areas prioritizing health and building more biking and walking projects?

Though there’s booming demand all across the country to build more projects that can help residents get out and bike or walk — whether for exercise or just for getting around safely from A to B — it can be an uphill battle to do so. How are metro areas upending the conventional wisdom and building more projects that help improve their residents’ health?

How we get around each day shapes our quality of life, especially our health. People who walk or bicycle more for transportation are shown to have lower rates of heart disease, diabetes and other conditions that can complicate or shorten lives. And the demand for more opportunities to safely walk and bicycle is at an all-time high in cities and towns of all sizes across the country.

Communities are responding by planning, funding, and fast-tracking projects to make bicycling, walking, and riding transit safer, more convenient, and more realistic as travel options.

But getting these projects planned, designed and built can be a challenge. How can regions bring more of these projects to fruition?

This new paper, produced with the American Public Health Association, outlines four policy levers MPOs have at their disposal to help increase and improve active transportation projects to meet the demand, decrease health disparities, increase access to opportunities, and strengthen local economies — with specific short real-life stories to go with each.

For the launch of the paper, we had an online discussion with a number of the metropolitan planning organizations (MPOs) featured in this paper to hear how they’re successfully prioritizing bicycling and walking projects.

We spent some time exploring the specific policies these MPOs have adopted, and how they’ve implemented them. Catch up with the recording below.

New national survey examines how metro areas use performance measures to evaluate their spending

Thanks to action taken by Congress, metro areas will be required to use a data-driven process to measure the performance of their transportation spending. But some metro areas already go far beyond the modest new federal requirements. T4America’s new national survey of over 100 metro planning agencies examines the current state of the practice — and where it’s headed.

The federal transportation law enacted in 2012, MAP-21, ushered in a new era by requiring metropolitan planning organizations (MPOs) to start evaluating the performance of their transportation investments against a handful of federally required measures. (We’ve written about this just a bit over the last few years.)

Some metro areas have been doing this for years, going far beyond the federal government’s modest new requirements (such as safety or condition of roads & bridges) to assess their transportation investments in terms of more ambitious goals like return on investment, public health and access to jobs. With the new suite of measures finalized by USDOT in early 2017, it’s no longer an option for MPOs now — it’s a requirement.

To find the answers to some of these key questions and establish a state of the practice, T4America conducted a national survey of 104 MPOs from 42 states in 2016. Our survey tried to assess:

  • How many MPOs are already using performance measures in some form?
  • How many are interested in going beyond the new modest federal measures?
  • What’s keeping them from doing more?
  • What other key goals and metrics are they interested in measuring?

Among a range of interesting findings, we discovered that the majority of the MPOs surveyed (75 percent) are already using performance measures in some fashion. However, there is significant room for improvement in how they use them — only 30 percent of all MPOs utilize performance measures to evaluate specific projects for inclusion in the fiscally constrained five-year plans that govern all short-term spending.

While most MPOs are focused on meeting the new federal requirements, two-thirds of all agencies surveyed also want to become national leaders in using performance measures — including many MPOs currently doing only the minimum or just getting started. When it comes to additional measures outside of MAP-21’s modest new requirements, nearly half of MPOs surveyed chose equity and/or health as one of the five additional goals they are interested in measuring and assessing.

View the full survey results here.

Apply for technical assistance from T4America

In addition to the survey, T4America is today announcing a new technical assistance program specifically designed to help MPOs successfully respond to federal, state and local requirements. Find out more about applying, including info on an upcoming webinar to explain more about the application process.

Learn more & apply

How metro planning agencies are promoting physical activity and health

Join us for the release of a new paper showing how regional transportation planning agencies are promoting physical activity and health while improving mobility and access to opportunity.

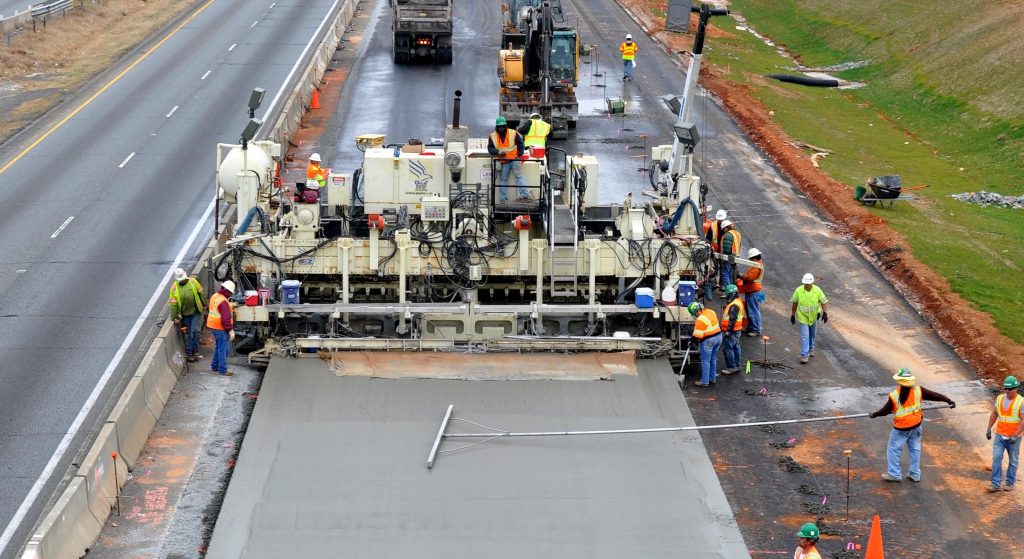
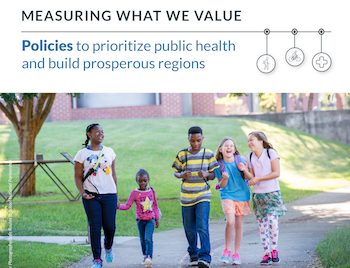
Register for the launch of Measuring what we value: Policies to prioritize public health and build prosperous regions on February 21st at 12:00 p.m EDT.

REGISTER NOW


How we get around each day shapes our quality of life, especially our health. People who walk or bicycle more for transportation are shown to have lower rates of heart disease, diabetes and other conditions that can complicate or shorten lives. And the demand for more opportunities to safely walk and bicycle is at an all-time high in cities and towns of all sizes across the country.

And communities are responding by planning, funding, and fast-tracking projects to make bicycling, walking, and riding transit safer, more convenient, and more realistic as travel options.

But getting these projects planned, designed and built can be a challenge. How can regions bring more of these projects to fruition? How can they integrate them into the processes of choosing what to build? How can they upend perhaps decades of radically different priorities to make these types of projects the norm?

This new paper, produced by T4America and the American Public Health Association, outlines four policy levers MPOs have at their disposal to help increase and improve active transportation projects to meet the demand, decrease health disparities, increase access to opportunities, and strengthen local economies — with specific short real-life stories to go with each. On this launch webinar, we’ll be joined by staff from a number of metropolitan planning organizations (MPOs) to hear how they’re successfully prioritizing bicycling and walking projects. We’ll explore the specific policies these MPOs have adopted, and how they’ve implemented them.

REGISTER NOW


Register today and we’ll also send you a short four-page preview of the full paper to be released on February 21st, a doc summarizing the specific strategies that MPOs are using to make more of these projects a reality.

Already joining us on February 21? Spread the word!

(Note: We profiled four of these MPOs at length in this package of related short case studies, released late in 2016.)

Introducing “Empty Spaces,” new research about parking requirements for transit-oriented developments

The oversupply of parking around transit — usually at the direction of outdated engineering guidelines — takes up valuable land, raises the cost of development, and misses key opportunities. This new research from Smart Growth America analyzes the amount of parking actually used in five transit-oriented development areas and how it compares to the guidelines that many planners, engineers or developers follow.

The land near transit stations is a valuable commodity. Hundreds or thousands of people travel to and through these places each day, and decisions about what to do with this land have implications for local economies, transit ridership, residents’ access to opportunity, and overall quality of life for everyone in a community.

Many communities choose to dedicate at least some of that land for parking. The question is, how much? Standard engineering guidelines are designed for mostly isolated suburban land uses—not walkable, urban places served by transit. But few alternative guidelines for engineers exist.

Empty Spaces: Real parking needs at five TODs, released today by Smart Growth America, set out to determine how much less parking is required at transit-oriented developments (TODs) and how many fewer vehicle trips are generated than standard industry estimates.

Professor Reid Ewing and his research team at the University of Utah College of Architecture + Planning selected five TODs across the country, each with a slightly different approach to development and parking: Englewood, CO; Wilshire/Vermont in Los Angeles, CA; Fruitvale Transit Village in Oakland, CA; Redmond, WA; and Rhode Island Row in Washington, DC. The research team counted the number of people entering and exiting the TOD buildings, and conducted brief intercept surveys of a sample of them. The team also counted parking inventory and occupancy.

The study found that all five TODs generated fewer vehicle trips than standard guidelines estimate, and used less parking than many regulations require for similar land uses. Most of the TODs included in this study also built less parking than recommended by engineering guides, yet even this reduced amount of parking was not used to capacity: the ratio of demand to actual supply was between 58 and 84 percent. Fewer vehicle trips is one likely reason why parking occupancy rates were lower than expected. Another possible reason is that standard engineering guidelines do not fully account for other travel modes that are available and actively encouraged at TODs.

This was crossposted from Smart Growth America

Join us for the kickoff webinar, today at 1 pm

If you’re reading this before 1 p.m. Eastern on 1/31, join us for a kickoff webinar. You are invited to join us:

Register now


Register for the event to to learn more about the findings and to hear from the report’s author, national policy experts, and planners from two of the cities included in this survey. Developers, regulators, and practitioners are already rethinking how much parking is needed at TOD. This new information can help them make better informed decisions, and ultimately create the development needed most at these in-demand locations.

Introducing “Dangerous by Design 2016”

Crossposted from Smart Growth America and the National Complete Streets Coalition.

Dangerous by Design 2016, released today by our colleagues at Smart Growth America and the National Complete Streets Coalition, takes a closer look at the alarming epidemic of pedestrian deaths, which are on the rise after years of declining.

Share this on Twitter Share this on Facebook

Between 2005 and 2014, a total of 46,149 people were struck and killed by cars while walking. That averages out to about 13 people per day.

Each one of those people was a child, parent, friend, classmate, or neighbor. And these tragedies occurred across the country — in small towns and big cities, in communities on the coast and in the heartland.

The fourth edition of this report being released today again ranks the most dangerous places for people walking by a “Pedestrian Danger Index,” or PDI. It also explores who is most at risk of being struck and killed by a car while walking, including data that looks at pedestrians by age, race, ethnicity, and income.

Explore the online feature to see the full rankings of the 104 largest metro areas in the country and all 50 states, as well as interactive maps of where fatal collisions occurred.

View the data and maps


Join us for the kickoff

Interested in learning more about Dangerous by Design, and what states and metro areas are doing to combat this epidemic? The report authors and other special guests will be talking about this new research during a kickoff webinar today (Tuesday) at 1 pm EST. You are invited.

REGISTER


Register for the event to to learn more about the findings and to hear from the report’s authors, national transportation policy experts, and local advocates about how we can make streets safer by design.

Will Elaine Chao address pedestrian safety?

A confirmation hearing for Elaine Chao, Trump’s nominee for transportation secretary, is scheduled to take place this week, on Wednesday, January 11th on Capitol Hill. We want to make sure pedestrian safety is on her mind.

Tell the Senate Commerce Committee to ask Chao how she plans to address pedestrian safety.

As always, we welcome your reactions, questions, and ideas. Share them on Twitter at the hashtag #DangerousByDesign.