Connecting people to jobs and services week: Hey Congress, we need your help to measure access

The Des Moines Area MPO wants to make a shift to award funding the transportation projects that do the most to improve the region’s resident’s access to jobs and services. But—like most MPOs and local governments across the country—its budget for the technology that makes this possible is small. It’s time for Congress to help local communities invest in the right projects. 

Ariels of Des Moines, Iowa from 10,000 feet May 6, 2017. USDA photo by Preston Keres

It’s “Connecting people to jobs and services” week here at Transportation for America. All week we’ll be exploring why improving access should be the goal of the federal transportation program—not vehicle speed. This guest post comes from Todd Ashby, CEO/Executive Director at the Des Moines Area MPO, which is trying hard to upend the broken status quo.

No matter how much funding a region has, there will never be enough money for every possible project. In Greater Des Moines, we want to guarantee that we spend our limited resources on projects that will do the most to connect our residents to their daily needs with affordable, efficient transportation.

Last year, Transportation for America came to Iowa to help the Des Moines Area Metropolitan Planning Organization (DMAMPO) do exactly that: create a scoring system to evaluate how proposed transportation projects work to achieve our goals, like improving people’s access to jobs and services (and not just for people driving cars). T4America inspired us to become a national leader in using performance measures to better align our project funding with regional priorities. 

To us, improving access to jobs and services is the gold standard for transportation investment, and one of the very best ways to use this relatively new idea of performance measurement. With improving access as our goal—not increasing vehicle speed or throughput— we would prioritize the projects that would do the most to improve our residents’ connections to jobs and services.  

But while very possible thanks to cloud computing and GPS, measuring access is expensive. We need data on where trips begin and end, where jobs are located, where people live, and where daily needs are located. This data is incredibly expensive. We also need additional resources and funding for models that help us process this data; the DMAMPO—like most other MPOs—has neither. 

Congress could help usher in a new era of picking projects based on how they improve access rather than on outdated 1950s measures like level of service or vehicle delay, but the federal program today is not oriented around this goal, nor around equipping states and metros to do so.

This is why the DMAMPO asked Iowa Senator Joni Ernst to cosponsor S. 654, the COMMUTE Act in Congress. This bill—an acronym for “Connecting Opportunities through Mobility Metrics and Unlocking Transportation Efficiencies”—would create a competitive pilot program at the U.S. Department of Transportation to provide states, local governments, and MPOs with data sets to calculate how many jobs and services are accessible by all modes of travel. 

Access to this data would transform how we are able to choose projects, empowering us with far better information to determine which proposed transportation projects would connect the most people to the highest quantity of jobs and services.

For a long time, ensuring high speed of travel within a corridor or minimal delay was a good enough rubric for spending billions of transportation dollars. It’s our goal to do something far better in Greater Des Moines. The COMMUTE Act would be a good start, but Congress can do so much more.

Changing the transportation paradigm, one project selection at a time.

Ringling Bridge in Sarasota, FL. (Image: Rich Schwartz, Flickr)

Thanks to support from the Kresge Foundation, Transportation for America helped several regions around the country take tangible steps toward aligning their spending with their policy goals using performance measures. We asked them about it…here’s what they said.

“If you can’t measure it, you can’t manage it.”

If that mantra ever needed to be applied anywhere, it’s in the world of transportation investment decision making. The state and regional transportation agencies that make funding decisions often say they want to fund the projects that best align with their community’s goals—such as increasing access to jobs and opportunity, improving health, making more equitable investments, and ensuring a good state of repair, to name a few. But too often, their practices don’t line up with intent. That’s why it is noteworthy that some regions around the country are making real headway to better align their spending with their stated priorities.

In a previous post, we explored this idea of choosing transportation projects that actually match our priorities. But what does it look like in practice to match funding decisions to a goal like economic competitiveness? And how is this process changing the transportation funding paradigm?

From the horse’s mouth

Rather than speak for them, we asked some of the professionals we worked with about how this assistance helped them address the specific transportation goals that their community is focused on. Each community has different goals, and the focus of our work shifted accordingly with each community, but the principle is the same: measure what you want to manage.

Reevaluating the status quo:

Typically, regions prioritize projects using factors like political priorities and geographic distribution, but this approach rarely produces the best set of investments to accomplish a long-term vision with limited funding. By contrast, some of the regions we worked with have established measurable goals and scoring systems to rank potential projects based on those goals. Many common policy priorities like equity and quality of life have traditionally been difficult to measure, so this systematic approach is a game-changer.

“In reviewing our past planning efforts we realized that there was not always a great connection between the projects selected for funding and our long-range plan’s goals. We also had more project requests than funding. Identifying performance measures and targets allowed us to prioritize the projects that would best help achieve our plan’s goals and make the best use of limited resources. T4America helped us refine our scoring process to ensure it was meaningful and performance-based, understood by non-technical stakeholders, and easily implementable by MPO staff.”

– Dylan Mullenix, Assistant Director of the Des Moines Area MPO

“The Lake Charles region is currently updating its long-range metropolitan transportation plan and will soon be selecting priority projects to fund. The Transportation for America team gave us ideas to simplify the measures used in project selection, eliminate duplication, consider the cost-effectiveness of projects, and make our scoring criteria publicly available. These suggestions and examples from other MPOs will allow the region to better prioritize projects based on a clear vision moving forward.”

– Cheri L. Soileau, AICP, Lake Charles MPO Director

Creating equitable and affordable transportation:

Equity was a common thread throughout this work. Many regions consider equity a priority, but have trouble effectively applying it to funding decisions. We helped these regions elevate needed investments in disadvantaged communities to improve access to economic opportunities and essential services. Some regions also wanted to prioritize investments that address community affordability. For example, the Sarasota/Manatee MPO hopes to raise the priority of projects that make it easier to walk, bike, and take transit to food, medical, or education facilities to help reduce the costs associated with accessing those necessities.

“Our partnership with T4A changed the transportation planning conversation in our region by bringing new voices to the table, from health and social service providers to environmental scientists. Using the FHWA performance measures framework, we have gone beyond traffic management and turn lanes to consider affordable housing, access to services for disadvantaged neighborhoods, and advancing best practices. We are confident this will lead to project priorities that consider all modes and that better serve all users.”

– Leigh Holt, Strategic Planning Manager, Sarasota/Manatee MPO

Supporting people who want to walk and bike safely:

Projects that make it easier to walk and bike not only improve the health of residents by providing options for exercise, they also support local economies by contributing to a quality of life that attracts residents and tourists. We helped several regions determine how to use performance measures to elevate the investments that make it easier to walk and bike safely.

“During Transportation for America’s workshop, the team encouraged us to renew our initiatives in active transportation for healthier communities. Our agency had developed a metropolitan bike and pedestrian master plan; however, as a result of the push, we began the process of actually producing every project in that plan. These 57 miles of active transportation improvements will be in place within the next six years! Furthermore, we are now replicating the same award-winning process in a neighboring urban area to further the goal of healthier communities through active transportation across our region.”

– Matt Johns, Executive Director, Rapides Area Planning Commission

Ensuring economic competitiveness:

Many regions measure their economic success by looking at how projects would reduce traffic congestion. But traffic congestion goes up with good economies and down with bad; so while it may be an important transportation priority, congestion reduction is not a good proxy for economic strength. We helped several of the regions determine how to use performance measures to invest in the right projects for the long-term economic vitality of their regions—projects that will help draw a talented workforce, retain residents, and grow a tourist economy.

“The Roanoke Valley Transportation Planning Organization is working to make the region more economically competitive by identifying places where growth is desirable and sustainable because plans for future development enable multimodal connectivity and mobility. The technical assistance provided by T4A helped us better understand performance measures and how we can more directly achieve our transportation and economic development goals through targeted investments.”

– Cristina Finch, Director of Transportation, Roanoke Valley-Alleghany Regional Commission.

These regions are able to make real change:

The six regions we worked with are already leading the way by seeking new ways of doing business. And thanks to Kresge’s support, we were able to introduce them to tools, approaches, and ways of thinking to help them do so. We are excited to see more innovative practices from these regions moving forward.

“The technical assistance provided by the Transportation for America team was more than a typical workshop—it opened the eyes of our local technical experts to a revolutionary way of thinking about transportation planning. We were taught how to better identify what problem we actually wanted to solve in order to avoid jumping to the usual prescribed solutions of cookie-cutter type thinking. In a way, the team provided a deeper validity and appreciation for REAL planning working in concert with engineering, and this is a necessity for better planning in an era when we truly cannot afford to “build our way out” of our problems.”

– Matt Johns, Executive Director, Rapides Area Planning Commission

Choosing transportation projects that actually match our priorities

Arial views of the Des Moines, IA region, one of the metro areas Transportation for America worked with. (Image: USDA photo by Preston Keres)

Transportation for America recently wrapped up a year of work with six metro areas to direct their transportation dollars to projects that help them achieve their goals and become the kinds of places they aspire to be.

Here’s a simple and perhaps obvious fact about transportation funding: There will never be enough money to do all the things we want to do. Even when the federal government, states, or localities come up with additional new money through a ballot measure or a gas tax increase or the like, the list projects that we want to build just grows along with the dollars.

So what’s the recipe for success? Like most truths in life, the answer is simple, but hard. Transportation agencies that want to succeed must: 1) articulate their goals, 2) evaluate transportation projects to ensure they are well-connected to those goals, and then 3) track how those projects perform after they are built. That is the simple idea behind performance measures in transportation. And sadly, their use is rare.

While 75 percent of the metropolitan planning organizations (MPOs) we surveyed in 2017 (78 of 104) used performance measures in some fashion in their last long-range plan, less than half (45 out of 104) actually used them to explicitly select which projects to include in the plan. Less than half of them actually created a system to determine “whether or not this project will move the needle on our overall goals.” (MPOs are the federally created regional agencies that plan and distribute federal transportation money within metro areas.)

Pretty much every metro area across the nation has a clear list of priorities or goals for their transportation dollars, but those goals are rarely used to choose projects for funding. For example, “repair” is a top, stated priority for transportation agencies everywhere. But all too often, the state or metro area is more likely to fund new, expensive projects that add capacity—projects that also come with years of embedded maintenance costs. And then you end up with a situation similar to Mississippi’s, where they’ve spent millions building highways across the state that they can’t afford to maintain.

This isn’t a funding problem, this is a failure to set priorities.

Over the last year, thanks to support from the Kresge Foundation, Transportation for America has worked closely with six MPOs that want to change this paradigm. We worked with these transportation leaders to create more effective systems that fund the transportation projects that best line up with their stated priorities. Those MPOs were:

  • Des Moines Area Metropolitan Planning Organization (Des Moines, IA);
  • Imperial Calcasieu Regional Planning and Development Commission (Lake Charles, LA);
  • Michiana Area Council of Governments (South Bend, IN);
  • Rapides Area Planning Commission (Alexandria, LA);
  • Roanoke Valley Transportation Planning Organization (Roanoke, VA); and
  • Sarasota/Manatee Metropolitan Planning Organization (Sarasota, FL).

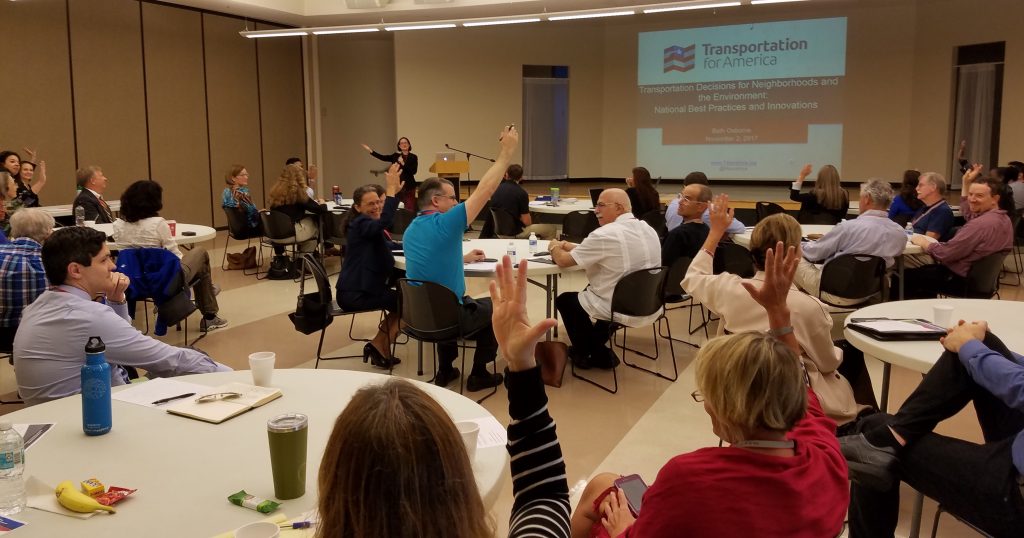
Beth Osborne presenting at a workshop with the Sarasota/Manatee MPO. (Image: Staff)

Our work with these six unique metro areas was intended to align their project funding with their regional priorities. None of these metro areas are huge cities or regions with a large staff or tons of funding to buy elaborate models; but all six of these MPOs are well on their way to becoming national leaders in using performance measurement to better line up the projects they choose with the goals they’re pursuing.

Throughout or work, we were also encouraged by how every single one of these MPOs were interested in moving beyond the traditional, simple performance measures like pavement condition, congestion, or safety. All six were interested in coming up with measures that work for all of their residents and better reflect what their residents deal with on a daily basis—not just measures that assess how the system works for people who drive everywhere. There was a strong undercurrent of concern about equity and ensuring that they create processes that steer transportation investments in ways that create opportunity for everyone.

The challenges that these six metro areas are facing are unique and really digging in to solve them demands a tailored approach. For example, Sarasota is facing housing and transportation costs that might be distorted because a percentage of their housing market is made up of second vacation homes, while a place like Roanoke has faced challenges attracting a labor pool and maintaining its young adult population. The kind of tailored assistance that the Kresge Foundation enabled us to provide relevant support that, in turn, made change possible on the ground.

Transportation is a particularly difficult field to change—we’ve done things the same way for generations. Change does not come overnight, but we’re excited to see how these six metro areas lead with performance measures. Our sincere thanks goes to the Kresge Foundation for their support of this valuable work and we hope other MPOs are given the opportunity to learn like these six did.

Watch the recap discussion of “Building Healthy and Prosperous Communities”

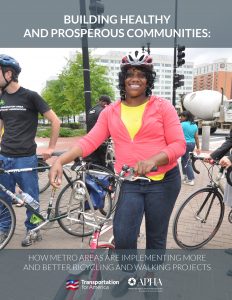
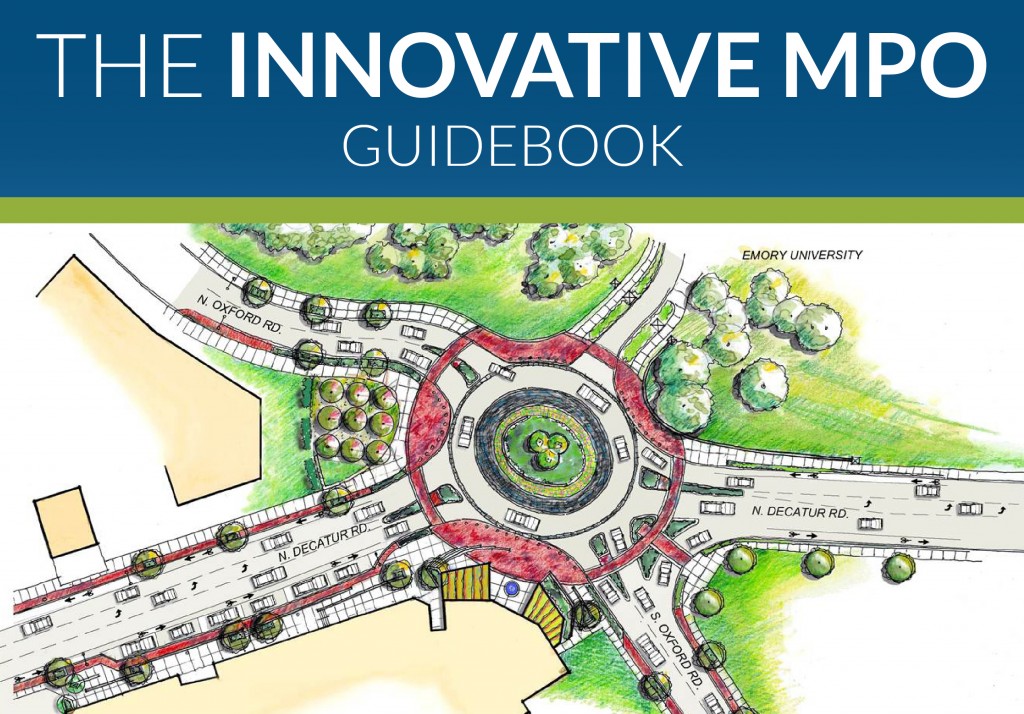
Building Healthy and Prosperous Communities: How Metro Areas are Building More and Better Bicycling and Walking Projects identifies ways that metro planning agencies are planning, funding and building more and better walking and bicycling projects in their communities. To learn more, download the guidebook, view the recording of the webinar below, or read some of the questions answered by the presenters.

On December 11, Transportation for America hosted a webinar discussion highlighting the eight strategies covered in the guidebook:

  1. Design guidance for bicycling and walking projects
  2. Complete Streets policies and programs
  3. Bicycle and walking data collection
  4. Performance measures
  5. Dedicated funding for bicycling and walking projects
  6. Improving walking and bicycling connections to public transportation and essential destinations
  7. Grassroots community engagement
  8. Understanding the public health impacts of transportation behaviors.

In the guidebook each of these eight strategy areas are explained through in-depth, technical case studies of metropolitan planning organizations (MPOs) across the country who have done this work, navigated barriers, and succeeded.

Joining the discussion were representatives from three of the MPOs featured in the guidebook. Cortney Geary from the Chattanooga-Hamilton County/North Georgia Transportation Planning Organization shared about their “Community to Region” performance measures framework which has helped prioritize multimodal projects for federal funding. Daniel Kaempff from Metro in Portland, Oregon shared how Metro has improved the design of walking and bicycling projects to encourage active transportation and keep people safe. And Jeff Pollack from the Corpus Christi MPO discussed the development of the region’s customized Bicycle Mobility Network plan and extensive community engagement process.

Want to learn more?

Check out the following resources to learn how to make more progress in building more and better projects to encourage walking and biking:

Stay tuned

In 2018 we’ll take a deep dive into a handful of the case studies featured in this guidebook. Stay tuned for more information about how you can get more technical questions answered by your MPO peers and experts.

Questions and answers

For those of you who really want to dive in deep, we went back and obtained detailed answers from our presenters to some of the questions that we weren’t able to answer during the webinar. You can view them here.

Coming soon: A new report on how metro areas are building more and better bicycling and walking projects

Metro areas of all sizes across the country are strategizing, developing, and implementing new ways to improve bicycling and walking in their regions. Over the last year, T4America worked with metro areas across the country to collect and document these stories, ideas, and strategies into a guidebook that we’re releasing on December 11.

Join us on December 11th at 12 p.m. EST for a launch webinar where we’ll release Building Healthy and Prosperous Communities: How Metro Areas are Building More and Better Bicycling and Walking Projects and hear from three of the agencies featured in it.

Over the last two years, Transportation for America, in conjunction with the American Public Health Association, has worked with metropolitan planning organizations (MPOs) across the country to collect and document stories about how they are planning, funding and building more and better walking and bicycling projects in communities. (Find our previous resources on this topic here and here.)

As the gatekeepers of billions of federal transportation dollars, MPOs have an influential role in expanding and improving options for walking and bicycling. They may establish policies, develop plans, direct funding, and help design transportation projects to allow more people to easily walk, bicycle, or ride in a wheelchair. Doing so can help people get the physical activity they need to be healthy — and healthier residents bring economic benefits for an entire region.

Places that have made biking and walking from place to place a safe, convenient, and enticing choice have produced positive impacts on businesses, jobs, and revenue. When it’s safer and more convenient for people to walk or bicycle as part of their regular routine,  more people get the amount of physical activity that science proves they need to reduce their risk of certain chronic diseases.

The following MPOs and scores of others are excelling, but there’s much more that can be done to build the necessary infrastructure to keep people thriving, safe, active, and connected to the places they need to go. The examples in this guidebook can inspire and inform your efforts, help tailor them for your region, and improve upon them to give the residents of your region the bicycling and walking infrastructure they demand and deserve.

The guidebook has detailed profiles of the work of these metropolitan planning agencies:

  • Atlanta Regional Commission (Atlanta, Georgia)
  • Broward MPO (Broward County, Florida)
  • Chattanooga-Hamilton County/North Georgia Transportation Planning Organization (Chattanooga, Tennessee)
  • Corpus Christi MPO (Corpus Christi,Texas)
  • Delaware Valley Regional Planning Commission (Philadelphia, Pennsylvania)
  • Denver Regional Council of Governments (Denver, Colorado)
  • Mesilla Valley MPO (Las Cruces, New Mexico)
  • Metro (Portland, Oregon)
  • Metropolitan Transportation Commission (Bay Area, California)
  • Nashville Area MPO (Nashville, Tennessee)
  • Mid-Ohio Regional Planning Commission (Columbus, Ohio)
  • Puget Sound Regional Council (Seattle, Washington)

During the webinar we’ll hear from three featured MPOs: The Chattanooga TPO will share how they created a new performance measures framework to prioritize multi-modal projects for funding. The Corpus Christi MPO will talk about how they customized a Bicycle Mobility Network through accessibility planning and community engagement. Finally, we’ll hear how Metro in Portland, Oregon encouraged higher rates of active transportation by changing the design of walking and bicycling projects.

Register today!

Six metro areas selected to receive in-depth, hands-on assistance with performance measures

T4America is proud to announce the six recipients of a new technical assistance program aimed at helping metro areas better measure and quantify the multiple benefits of transportation spending decisions.

Through the support of the Kresge Foundation, T4America will be working with six metropolitan planning organizations (MPOs) over the coming year to help them better measure and assess their transportation spending to bring the greatest return possible for citizens. After a competitive process conducted last month, T4America is awarding assistance on performance measures to these six MPOs across the country:

  • The Des Moines Area Metropolitan Planning Organization in Des Moines, IA
  • The Michiana Area Council of Governments in South Bend-Elkhart, IN
  • The Sarasota/Manatee Metropolitan Planning Organization in Southwest Florida
  • The Roanoke Valley-Alleghany Regional Commission in Roanoke Valley, VA
  • The Imperial Calcasieu Regional Planning and Development Commission in Lake Charles/Southwest Louisiana
  • The Rapides Area Planning Commission in Alexandria/Pineville, LA

Why performance measures? To the general public, the perception is that the decisions about what to build, where and how are made in a murky, mysterious, political process. And once we do build new transportation projects, there’s little confidence that we ever go back and determine if it brought the benefits that were promised. Performance measurement is a way to start to change this perception and make spending more focused on accomplishing tangible goals.

As the survey we released earlier this year shows, the vast majority of MPOs want to find ways to do more with performance measurement, but they’re eager for some help. This new assistance program is specifically designed to help MPOs successfully respond to federal, state and local requirements — or go beyond them.

Over the next year, these six MPOs will receive hands-on technical support in meeting the new federal requirements and also with developing measures that address other goals for their regions, like increasing access to jobs and other services, supporting community-driven creative placemaking, improving public health, and supporting social equity, among others

“There will never be enough transportation dollars to get to every project idea — everyone has to do a better job of identifying the most beneficial projects. These six MPOs share a commitment to using performance measures to better serve their region’s goals and improve the accountability and effectiveness of their transportation programs,” said Beth Osborne. “They are already looking for ways to integrate these goals more directly into the decisions they make about which transportation investments to prioritize. With the support of the Kresge Foundation, T4America is excited to be able to help them do so.”

Congratulations to these six regions. T4America and our team of experts look forward to working with you over the coming year.

How are metro areas prioritizing health and building more biking and walking projects?

Though there’s booming demand all across the country to build more projects that can help residents get out and bike or walk — whether for exercise or just for getting around safely from A to B — it can be an uphill battle to do so. How are metro areas upending the conventional wisdom and building more projects that help improve their residents’ health?

How we get around each day shapes our quality of life, especially our health. People who walk or bicycle more for transportation are shown to have lower rates of heart disease, diabetes and other conditions that can complicate or shorten lives. And the demand for more opportunities to safely walk and bicycle is at an all-time high in cities and towns of all sizes across the country.

Communities are responding by planning, funding, and fast-tracking projects to make bicycling, walking, and riding transit safer, more convenient, and more realistic as travel options.

But getting these projects planned, designed and built can be a challenge. How can regions bring more of these projects to fruition?

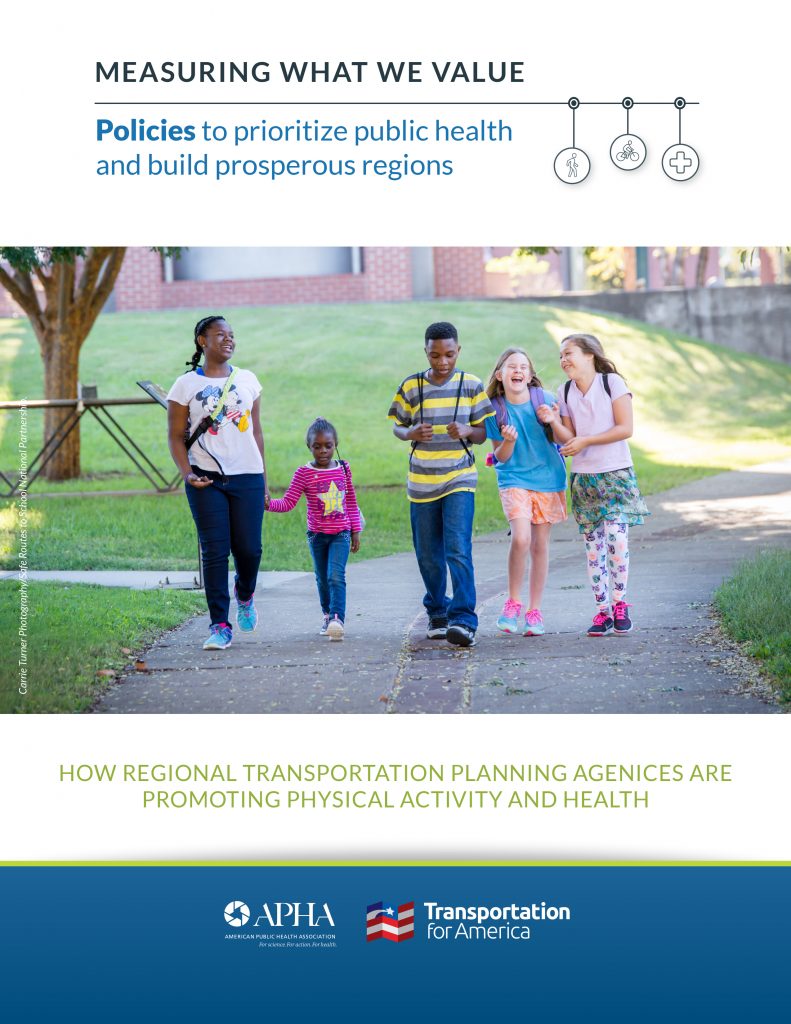
This new paper, produced with the American Public Health Association, outlines four policy levers MPOs have at their disposal to help increase and improve active transportation projects to meet the demand, decrease health disparities, increase access to opportunities, and strengthen local economies — with specific short real-life stories to go with each.

For the launch of the paper, we had an online discussion with a number of the metropolitan planning organizations (MPOs) featured in this paper to hear how they’re successfully prioritizing bicycling and walking projects.

We spent some time exploring the specific policies these MPOs have adopted, and how they’ve implemented them. Catch up with the recording below.

New national survey examines how metro areas use performance measures to evaluate their spending

Thanks to action taken by Congress, metro areas will be required to use a data-driven process to measure the performance of their transportation spending. But some metro areas already go far beyond the modest new federal requirements. T4America’s new national survey of over 100 metro planning agencies examines the current state of the practice — and where it’s headed.

The federal transportation law enacted in 2012, MAP-21, ushered in a new era by requiring metropolitan planning organizations (MPOs) to start evaluating the performance of their transportation investments against a handful of federally required measures. (We’ve written about this just a bit over the last few years.)

Some metro areas have been doing this for years, going far beyond the federal government’s modest new requirements (such as safety or condition of roads & bridges) to assess their transportation investments in terms of more ambitious goals like return on investment, public health and access to jobs. With the new suite of measures finalized by USDOT in early 2017, it’s no longer an option for MPOs now — it’s a requirement.

To find the answers to some of these key questions and establish a state of the practice, T4America conducted a national survey of 104 MPOs from 42 states in 2016. Our survey tried to assess:

  • How many MPOs are already using performance measures in some form?
  • How many are interested in going beyond the new modest federal measures?
  • What’s keeping them from doing more?
  • What other key goals and metrics are they interested in measuring?

Among a range of interesting findings, we discovered that the majority of the MPOs surveyed (75 percent) are already using performance measures in some fashion. However, there is significant room for improvement in how they use them — only 30 percent of all MPOs utilize performance measures to evaluate specific projects for inclusion in the fiscally constrained five-year plans that govern all short-term spending.

While most MPOs are focused on meeting the new federal requirements, two-thirds of all agencies surveyed also want to become national leaders in using performance measures — including many MPOs currently doing only the minimum or just getting started. When it comes to additional measures outside of MAP-21’s modest new requirements, nearly half of MPOs surveyed chose equity and/or health as one of the five additional goals they are interested in measuring and assessing.

View the full survey results here.

Apply for technical assistance from T4America

In addition to the survey, T4America is today announcing a new technical assistance program specifically designed to help MPOs successfully respond to federal, state and local requirements. Find out more about applying, including info on an upcoming webinar to explain more about the application process.

Learn more & apply

NOTICE OF FINAL RULEMAKING: Assessing performance on the NHS, freight movement on the interstate system, and the CMAQ program

DATE EFFECTIVE: FEBRUARY 17, 2017

[FEDERAL REGISTER NOTICE, HERE]

Overview

Less than one year after the Federal Highway Administration (FHWA) first proposed outdated measures of congestion (see T4America’s blog post here) and after thousands of our members and partners provided comments, FHWA is now finalizing this rule. Published on January 18, the final rule rolls back some of the redundant, vehicle-focused measures initially proposed in the notice of proposed rulemaking (NPRM) and incorporates some significant changes, many of which we advocated for.

In response to comments from T4A and others, the final rule adds two new measures – a carbon dioxide emissions measure and a multimodal measure. To better reflect the number of people traveling on the system, two of the other proposed measures were modified so they are based on person-travel instead of vehicle travel.

In addition, the faulty measures for percentage of the interstate freight mileage uncongested and Peak Hour Travel Time Reliability (PHTTR) included in the NPRM were both deleted from the final rule. The final rule also simplifies the required data processing and calculation of metrics.

While the final rule is much improved, changes to the speed thresholds for the congestion measure may have some negative impacts on signalized downtown roads with low speed limits.

Background

On the same day that FHWA released this final rule on system performance and congestion, FHWA also released its final rule establishing regulations to assess pavement and bridge conditions. (See T4America summary here). These final rules are the last of several regulations issued to implement the performance management framework established by the recent national transportation authorizations bills, known as MAP-21 and the FAST Act.

In addition to these two rules, FHWA published rules on safety performance measures and the integration of performance management into the Highway Safety Improvement Program (HSIP) in March 2016 and published a rule on asset management plans in October 2016. In May 2016, both FHWA and FTA published a joint rule implementing changes to the planning process.

Together these rulemakings establish regulations for state DOTs and MPOs to evaluate and report on surface transportation performance across the nation.

Final measures

In the draft rule, 7 of the 8 proposed measures were based on vehicle travel time data. Now, only four of the final measures are derived from vehicle travel times, three of which are weighted to reflect all people traveling on the system.

The seven measures established in the final rule include:

  • Three measures of system performance
    • Percentage of reliable person-miles traveled on the Interstate
    • Percentage of reliable person-miles traveled on the non-Interstate NHS
    • Percent change in CO2 emissions from 2017, generated by on-road mobile sources on the NHS
  • A measure for freight movement on the Interstate system
    • Average truck travel time reliability index (TTTR)
  • Three measures to assess the CMAQ program, including two measures on traffic congestion
    • Total emission reductions for applicable criteria pollutants, for non-attainment and maintenance areas
    • Annual hours of peak hour excessive delay per capita
    • Percent of non-single occupancy vehicle (SOV) travel, including travel avoided by telecommuting

Timeline and enforcement

State DOTs will establish their first statewide targets one year after the effective date of this rule, February 17, 2017. MPOs have up to 180 days after state DOTs establish their targets to establish their own targets.

State DOTs must establish both 2-year and 4-year targets. The MPOs are subject only to a 4-year target-setting requirement. MPOs must either: (a) agree to plan and program projects so that the projects contribute toward the accomplishment of the relevant state DOT target for the performance measure, or (b) commit to a quantifiable 4-year target for the performance measure for the MPA. FHWA will assess every 2 years to determine if a state DOT has made significant progress toward achieving their targets.

If States/MPOs fail to meet their targets after 4 years, they have to set new ones for the next 2- and 4-year performance period. If they fail again, there is no real consequence.

Under the new administration, the White House ordered a freeze on the regulatory process. For regulations that have been finished but have not taken effect, the order calls for temporarily postponing their effective date for 60 days or possibly longer. This order could delay the effective date of this rule.

System performance

In the NPRM, FHWA proposed calculating performance on the interstate and non-interstate system by using two metrics: (1) Level of travel time reliability (LOTTR), and (2) Peak hour travel time ratio (PHTTR).

T4America and others expressed concern about the PHTTR measure as a poor measure of performance because it assumes the goal is for roadways to operate in free flow conditions at all times of day – a prohibitively expensive and infeasible goal that can undermine local economic development and multimodal travel. There was already another congestion measure under the CMAQ program and a different reliability measure looking at how consistent travel was from one day to the next. Due to this, we recommended that this measure be vacated, which FHWA did in the final rule..

The final rule also changes the weighting of the travel time reliability measures from system miles to person-miles traveled using overall occupancy factors from national surveys. This prioritizes roadways that move more people through carpooling and transit over roads that only move SOVs.

New CO2 emissions measure

The final rule adds a new emissions measure – percent change in tailpipe CO2 emissions on the NHS from calendar year 2017. This measure applies to the NHS in all states and metropolitan planning areas. All state DOTs and MPOs that have NHS mileage in their state geographic boundaries and MPAs will be required to establish targets and report on progress.

State DOTs will calculate the measure by multiplying motor fuel sales volumes by the FHWA-supplied emissions factors of CO2 per gallon of fuel and percentage VMT on the NHS.

Freight movement on the interstate

The draft rule proposed two measures of freight movement on the interstate: (1) Truck Travel Time Reliability (TTTR), and (2) percent of the interstate system mileage uncongested. T4A and our partners were concerned that the TTTR measure would prioritize freight movement over the movement of people. In response, FHWA removed the TTTR measure from the final rule.

FHWA also changed the form of this measure from one based on the percent of the system providing for reliable travel to an overall average truck reliability index for the Interstate. This change removes the hard threshold in the definition of reliable travel for trucks and recognizes incremental improvements that could be made to improve reliability.

CMAQ program

Three measures are established for the CMAQ program, including total emissions reduction measure and two traffic congestion measures.

Traffic congestion

The NPRM proposed measuring traffic congestion under the CMAQ program by looking at annual hours of excessive delay per capita. As mentioned above, a separate peak hour travel time reliability (PHTTR) measure was also proposed for measuring system performance on the interstate and non-interstate systems. The PHTTR measured percent of the interstate system in large urbanized areas over 1 million in population where peak hour travel times meet expectations. These two measures merge in the final rule creating the Peak Hour Excessive Delay (PHED) measure.

In response to comments, a new multimodal measure – percent of non-SOV travel – was also added in the final rule.

APPLICABILITY

Both the PHED and the multimodal measure adhere to the same applicability requirements. As proposed, the CMAQ congestion measure applied to areas in nonattainment with a population over 1 million. The final rule expands applicability to also include areas with a population over 200,000.

The applicability of both CMAQ traffic congestion measures will be phased in, beginning with urbanized areas with a population over 1 million that contain any part of nonattainment or maintenance areas for one or more air pollutants in the first performance period (2018). It will be expanded to urbanized areas with a population over 200,000 that contain any part of nonattainment or maintenance areas for one or more air pollutants beginning in the second performance period (2022).

The final rule also moves up the date of measure applicability determination to one year earlier than initially proposed. FHWA will determine measure applicability based on the most recent available data on October 1, 2017.

PHED – SPEED THRESHOLD

As proposed in the NPRM, the traffic congestion measure would have established a 35 mph threshold for freeways and a 15 mph threshold for other NHS roadways. In the final rule, FHWA responded to concerns about these static speed thresholds by setting the excessive delay threshold to 60 percent of posted speed limit, with a minimum limit of 20 mph. This may be a slight improvement for measuring excessive delay for expressways, but this same threshold will also apply to non-expressway facilities. Particularly when applied to signalize urban roads marked at 25mph, vehicle speeds might fall below 60% of the speed limit even during free-flow conditions.

In the final rule, FHWA encourages state DOTs and MPOs to share their strategies using volume limiting techniques to address concern when extremely slow speeds exist. FHWA plans to make provisions within HPMS to capture posted speed limit data by adding a field that can be populated for the full extent of the NHS.

PHED – PEOPLE-CENTRIC CHANGES

FHWA agreed with comments that the measure should represent the cumulative delay of all people using the NHS and not just the delay experienced by vehicles. As a result, the PHED measure requires the use of average vehicle occupancy (AVO) factors for cars, buses, and trucks and hourly traffic volumes to calculate person-hours of excessive delay. To support this approach, FHWA will establish AVO factors for applicable urbanized areas using the National Transit Database for buses and national surveys, such as the American Community Survey, for cars. State DOTs and MPOs have the flexibility of choosing to use these AVO factors or substituting more specific AVO data that they may have.

In response to comments, including comments from T4A, the final rule requires the use of annual population estimates using U.S. Census estimates (i.e. most recent ACS 5-year estimates) as opposed to the decennial census populations to normalize the excessive delay measure. The most recent annual population estimate will be used each time the PHED per capita measure is calculated.

PERCENT OF NON-SOV TRAVEL 

This measure includes modes that are in the ACS Journey to Work data, which includes travel avoided by teleworking. State DOTs and MPOs have three options for calculating modal share:

  1. use the ACS Journey to Work mode share data
  2. use locally specific surveys, or
  3. use volume counts for each mode.

FHWA encourages state DOTs and MPOs to report data not currently available in national sources, such as pedestrian or bicycle counts. For state DOTs and MPOs that chose to use count data, FHWA encourages this data to be voluntarily submitted to FHWA via national sources or databases (such as TMAS, NTD, or GTFS-RT).

On-road mobile source emissions

APPLICABILITY

While FHWA acknowledged T4A’s comments, FHWA did not agree that this emissions measure should apply more broadly to include all states or regions that receive CMAQ funds, or to consider all capital and operational opportunities to reduce emissions, not just those that receive CMAQ funding.

The measure is applicable to all states and MPOs with projects financed with funds from the CMAQ program, apportioned to state DOTs for areas designated as non-attainment or maintenance for ozone, carbon monoxide, or particulate matter. FHWA clarified in the final rule that the baseline non-attainment and maintenance area designations should be based on area status as of October 1, 2017.

FHWA narrowed the definition of ‘maintenance area’ to exclude any areas that have completed their 20-year maintenance plan for an applicable pollutant. States and MPOs can also request exclusion from this requirement at the midpoint of the performance period, if their designation changes (i.e. the 20-year maintenance plan is achieved, or the area is no longer designated as non-attainment or maintenance).

While state DOTs and MPOs can still use CMAQ dollars to fund projects where is it not possible or easy to quantify the emissions benefit, these projects will not be accounted for in this performance measure.

METRIC & TARGET ADJUSTMENT

The final rule removes the conversion from kilograms per day emissions data to tons per year data. The final rule calculates total emission reduction as cumulative reductions in emissions over 2 and 4 federal fiscal years.

As in the proposed rule, the final rule allows states or MPOs that believe they would not be able to meet a target due to a change in models to adjust the target at the performance period’s mid-point or explain in their final performance report why they were unable to meet their targets due to model-based emissions estimate.

TIMELINE

Consistent with CMAQ Program Guidance, state DOTs must enter their CMAQ project information for the previous fiscal year into the CMAQ Public Access System by the March 1 deadline. In this rule, FHWA adds a new July 1 deadline, for when all information must be in the CMAQ Public Access System. This due date will apply on July 1 after the final rule is effective.

States and MPOs must use projects in the 4 years prior to the first performance year as a basis for establishing a target for the first performance period. The projects entered into the CMAQ Public Access System during the 2-year and 4-year performance period will be taken as is to calculate the measure.

Additional measures

FHWA notes that state DOTs and MPOs may voluntarily report additional measures beyond their baseline requirement. Additional measures, or variations, could include metrics for per capita emissions, VMT-based estimates, or other useful indicators. Some of the priority outcomes not addressed by the Congressionally mandated measures promulgated by this rule are jobs access, freight movement off the Interstate, public health, stormwater runoff, and household transportation cost.

Review & analysis

FHWA will review this rule after the first performance period to assess effectiveness of the requirements and identify any necessary changes. FHWA also plans to revisit the reliability and congestion measures after the completion of its multimodal research study in Fall 2018.

USDOT made significant improvements in this final rule. However, the ability to set negative targets (e.g., a target of more fatalities) remains an area of concern as does the lack of real accountability for failing to meet any of the self-set targets. This is a flaw in the underlying legislation and not anything FHWA could have addressed in the rulemaking.

Furthermore, the progress made under this rule could be rolled back, if the new Congress overturns this rule under the Congressional Review Act (CRA). At a minimum, the effective date of this rule may be delayed for 60 days. T4America continues to monitor this rule and will provide updates as necessary.

NOTICE OF FINAL RULEMAKING: Assessing pavement and bridge condition for the national highway performance program

DATE EFFECTIVE: FEBRUARY 17, 2017

[FEDERAL REGISTER NOTICE, HERE]

Overview

This rule establishes measures for state departments of transportation (DOTs) to evaluate bridge and pavement condition. These measures are intended to direct states to spend federal-aid funds from the National Highway Performance Program (NHPP) to achieve the performance targets in states’ asset management plans.

Background

On the same day that FHWA released this final rule regarding pavement and bridge conditions, FHWA also released its final rule establishing regulations to assess performance of the NHS and Interstate System, freight movement on the Interstate System, and congestion and mobile source emissions. (See T4America summary here). These final rules are the last of several regulations issued to implement the performance management framework established by the recent national transportation authorizations bills, known as MAP-21 and the FAST Act.

In addition to these two rules, FHWA published rules on safety performance measures and the integration of performance management into the Highway Safety Improvement Program (HSIP) in March 2016 and published a rule on asset management plans in October 2016. In May 2016, both FHWA and FTA published a joint rule implementing changes to the planning process.

Together these rulemakings establish regulations for state DOTs and MPOs to evaluate and report on surface transportation performance across the nation.

Summary of Requirements

State DOTs and MPOs must establish targets for each of the following performance measures:

  • Percentage of pavements on the Interstate System in good condition;
  • Percentage of pavements on the Interstate System in poor condition;
  • Percentage of pavements on the NHS (excluding the Interstate System) in good condition;
  • Percentage of pavements on the NHS (excluding the Interstate System) in poor condition;
  • Percentage of NHS bridges classified as in good condition; and
  • Percentage of NHS bridges classified as in poor condition.

“Good” and “poor” pavement ratings are based on quantitative measures of roughness, cracking, rutting and misalignment of pavement surfaces. Since 2010, most state DOTs have reported roughness, cracking, rutting, and faulting data annually to FHWA through the Highway Performance Monitoring System. Ratings for bridge conditions are based on measures submitted to the National Bridge Inventory (NBI). State DOTs have been required to submit NBI reports to FHWA since 1978. Bridge ratings are based on the lowest component (e.g. deck, superstructure, substructure) rating.

Process

State DOTs must set 2- and 4-year targets for a 4-year performance period for the condition of highways and bridges. State DOTs will establish their first statewide targets in 2018. Each state DOT will submit its established targets in a baseline report at the beginning of the performance period and report progress at the midpoint and end of the performance period. DOTs will be allowed to adjust their 4-year target at the midpoint of the performance period.

MPOs will establish targets by either supporting a state DOT’s statewide target, or defining a target unique to the metropolitan area each time state DOTs establish a target. The MPOs have up to 180 days after state DOTs establish their pavement and bridge condition targets to establish their own targets. MPOs are not required to provide separate reporting to FHWA. However, state DOTs and MPOs must develop a process for coordinating their targets, which will be included in the MPOs’ metropolitan planning agreements or documented in another, mutually determined manner.

Targets and measurement apply to all highways and bridges on the NHS, regardless of ownership. MPO targets will apply to the extent of the metropolitan planning area; state targets apply to the entire state.

State DOTs and MPOs set their own targets; there is no provision in statute for FHWA to review or approve the targets these agencies set.

State DOTs may set additional targets for portions (e.g. urbanized or non-urbanized areas) of the state.

State DOTs must submit the following reports to FHWA:

  • Baseline performance reports, due October 1, 2018 and every four years thereafter, will include baseline conditions and 2- and 4-year performance targets.
  • Mid performance period progress reports must be submitted three years into the four-year performance period (to address the first two years of the period). This report will include the actual condition, progress toward performance targets, target adjustments, any extenuating circumstances that prevent the state from achieving its targets, and a description of the actions to be taken to meet the targets.
  • Full performance period progress reports, due one year following the end of the referenced period, will include actual condition, four-year progress toward targets, any extenuating circumstances that prevent the state from achieving its targets, and a description of the actions to be taken to meet the targets

The report timeline is summarized in the Figure 1 below.

MPOs must report their targets, baseline conditions, and progress toward targets to their states’ DOTs in a mutually agreed upon manner.

FHWA will determine states’ progress toward their targets after receipt of the mid- and full-performance period progress reports. FHWA will determine that a State DOT has made significant progress toward the achievement of each 2-year or 4-year NHPP target if either:

  • The actual condition/performance level is better than the baseline condition/performance; or
  • The actual condition/performance level is equal to or better than the established target.

State DOTs that fail to meet or make significant progress toward meeting pavement and bridge condition performance targets in a biennial performance reporting period will be required to document the actions they will undertake to achieve their targets in their next biennial performance report.

Additionally, this rule sets minimum standards for Interstate highway pavement condition and bridge condition. These thresholds are not more than 5 percent of Interstate pavement in poor condition and not more than 10 percent of bridge deck area rated structurally deficient. FHWA will annually determine if these conditions are met.

If a minimum pavement condition on the Interstate is not met the state DOT must set aside an amount equal to the state’s 2009 federal apportionment for the pre-MAP-21 Interstate Maintenance program. However, in some cases this amount of funding may be less than the state is already spending on Interstate maintenance and less that is necessary to fix the problem.

If the minimum bridge condition is found to have not been met for the previous three year period the state DOT must set aside and amount equal to the state’s 2009 federal apportionment for the pre-MAP-21 bridge maintenance program. This set-aside requirement remains in effect for each subsequent year until less than 10 percent of the total deck area of bridges in the state on the NHS is classified as structurally deficient. However, in some cases this amount of funding may be less than the state is already spending on bridge repairs and less that is necessary to fix the problem.

Changes from the proposed rule

Two changes were made to comport with new statutory provisions from the FAST Act.

The proposed rule required a state DOT to document how it would meet its performance targets if it failed to meet these targets over two, consecutive biennial reports. The final rule requires a report on corrective action if a state DOT does not make significant progress in a single biennial performance report.

Similarly, under the final rule, FHWA will impose a requirement for additional repair spending if the state’s Interstate pavement condition has fallen below the minimum condition level for the most recent year (instead of most recent 2 years).

The final rule makes several technical adjustments to the way particular measures are calculated and revises certain thresholds.

T4America critiqued the provision of this rule that allows state DOTs to adjust their 4-year performance targets when they submit their two-year, mid-period progress report. Especially considering that states already set their own targets, allowing states to change their targets halfway through the performance period when they see their results lagging undermines the accountability of performance management system. However, several DOTs commented requesting more flexibility to revise their targets. In the final rule FHWA did not change the provision and allows for state DOTs to reset their targets in the mid-period report. The final rule additionally adds a provision that state DOTs must coordinate with MPOs before adjusting performance targets.

T4America also urged changes to the rule to assign state DOTs and MPOs equal responsibilities in setting targets. This final rule, however, makes requirements primarily of states while encouraging coordination with MPOs.

Review

FHWA will review this rule after the first performance period to assess the effectiveness of the requirements to identify any necessary changes.

Trickle-up performance measures

While working to enhance its performance-based planning framework, Metro, the metropolitan planning organization for the Portland, Oregon region, can draw from the experience of local jurisdictions within its own region — bringing unanticipated benefits through “trickle-up” learning.

This is the second of a series of posts on the issues and challenges of performance-based planning in the Portland region.

When Metro kicked off the process of developing its long-range transportation plan governing the next ten years of spending it was clear that performance measures would be a focus, both because of the new requirements created by the 2012 federal transportation law (MAP-21) and a growing public interest in making smarter choices about transportation investments.

Metro convened a workgroup of stakeholders to provide guidance on performance measures. To get things started, Metro hosted a workshop in January of 2016, which included presentations on the performance measure work of two local jurisdictions: City of Portland and Washington County.

The experience of each of these jurisdictions offered up lessons that have informed the workgroup’s efforts to identify performance measures and develop a framework to inform Metro’s next long-range plan.

As part of its transportation plan, Portland has used performance-based criteria as a way to prioritize investment, and has been careful to ensure that those criteria reflect the city’s values. Criteria were derived from numerous sources that incorporate citizen input. The seven criteria are “cross-modal”; they evaluate various concerns and support a balance among modes.

Portland’s evaluation criteria

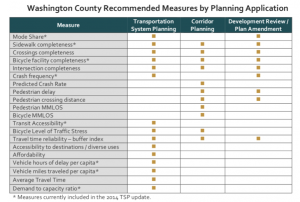
In 2014, Washington County published Multimodal Performance Measures and Standards, prepared by Kittleson & Associates. The report strives to identify performance measures that are relevant to non-automobile modes of travel. While the suite of performance measures identified in this study are useful fodder for Metro’s workgroup, some of the greatest value is the lessons learned in the process, and the opportunity to adapt some of the study’s approaches to evaluating the performance measures themselves.

While the study lists five lessons learned, the first two are most of interest:

  • Different measures are best for different planning applications.
  • Different measures may be needed to assess the same goal.

These two lessons, along with the use of matrices to visually compare proposed measures, are playing the biggest role in informing the work of Metro’s performance measures workgroup.

Performance Measures, Graphic, Transportation Planning, Grid, Chart, Corridor Planning, Development, Crash, Pedestrian, Mode Share, Travel Time, Portland, Oregon

Washington County, Oregon developed matrices to identify how proposed performance measures could be applied.

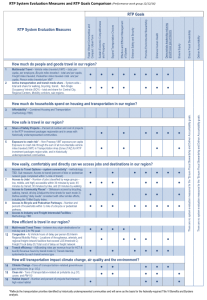
Taken together, these lessons led the workgroup to ask for matrices to illustrate the role of performance measures under consideration for Metro’s long-range plan. Metro is using two types of matrices to answer two questions. First, what is the relationship between the proposed performance measures and the region’s goals. Second, at what stage of planning can each performance measure be applied?

For example, Metro is using vehicle miles traveled as a performance measure in several stages of planning. It’s important to understand how this measure relates to several of the regions’ goals including efficiency of the transportation system, reducing household transportation costs, reducing greenhouse gas emissions and improving safety. A matrix comparing proposed measures with the region’s goals helps workgroup members to visualize those relationships and identify redundant measures.

RTP, Evaluation System, Matrix, Graphic, Chart, Portland, Oregon, Measures, Evaluation, Travel, Region, Efficient, RTP Goals

Metro staff developed a matrix that communicates how each proposed performance measure addresses the region’s goals.

Likewise developing a matrix to look at how measures can be applied is also helpful. For example, crash rate is something that cannot be predicted in Metro’s travel model. So while safety is a major goal for most transportation agencies, a proxy may be needed to inform selection of a preferred scenario or project prioritization. Metro is considering a measure they are calling “VMT exposure” which is the amount of traffic on surface streets. While this isn’t an exact measure of safety by any means, it is strongly correlated and can be easily forecast in a transportation model. Crash rate will be used as a monitoring measure to determine if the region’s investment strategy is working to reduce crashes in hindsight.

Besides the ideas on how to evaluate performance measures, there is an additional benefit to learning from local jurisdictions: consistency between local measures and regional measures. Getting everyone on the same page to coordinate regional investments helps ensure that all dollars are going to accomplish goals that are shared across the region. Regional performance measures that reflect those bubbling up from local jurisdictions will help local jurisdictions like Portland and Washington County that are already ahead of the game develop local plans that reflect their own local values while still being consistent with the regional plan.

T4America member summary- MPO Coordination Rule

NOTICE OF FINAL RULEMAKING:  MPO Coordination and Planning Area Reform  Date Effective: January 19, 2017

[Federal Register Notice, here]

OVERVIEW

FHWA released its final rulemaking on Metropolitan Planning Organization (MPO) Coordination and Planning Area Reform on December 20, 2016. The final rule differs from the proposed rule (see T4America summary here) in two significant ways:

EXTENDED TIMELINE

The final rule phases in implementation of the rule’s requirements. Full compliance is extended from the two-year timeframe proposed under the Notice of Proposed Rulemaking (NPRM) to two years after the 2020 census information on Qualifying Urban Areas data is released.

POSSIBLE EXCEPTIONS

Under a new process multiple MPOs in a single Metropolitan Planning Area (MPA) may be granted an exception to the unified planning products requirement if they can demonstrate that the goals of the rule are being achieved through an existing coordination mechanism. To be granted an exception, the affected governor(s) and all MPOs in the MPA must submit a joint request that must be approved by the U.S. Secretary of Transportation. An approved exception is permanent.

PROVISIONS OF THE FINAL RULE

As in the proposed rule, the final rule requires all MPOs within the same MPA to develop a single metropolitan transportation plan, a single transportation improvement program, and a jointly established set of performance targets for the MPA. A MPA must include an entire urbanized area (UZA) and the contiguous area projected to become urbanized within a 20-year forecast period in the metropolitan transportation plan (MTP).

As in the proposed rule, MPOs have three compliance options under the final rule:

  • MPOs adjust the boundaries of their MPAs to encompass the entire urbanized area plus the contiguous area forecast (by the MPOs) to become urbanized over the 20 years of the metropolitan transportation plan. Many MPOs may be able to adjust MPA boundaries in such a way that they remain separate from contiguous MPOs.
    • For example, if an MPO’s current jurisdiction includes a portion of a UZA primarily served by another MPO, the two MPOs can work together to adjust their jurisdictions so that each MPO serves an MPA with the appropriate UZA.
    • If the forecasted growth areas for the two MPAs overlap, then the governor(s) and MPOs can work together to determine the most appropriate way to allocate that growth area between the MPAs. governors and MPOs are encouraged, although not required, to consider merging the multiple MPAs into a single MPA under these circumstances.
  • Multiple MPOs located in a single MPA merge.
  • Multiple MPOs in a single MPA may remain separate if the governor(s) and MPOs determine that the size and complexity of the MPA justifies multiple MPOs. However, these MPOs would still have to coordinate and prepare unified planning products.

The final rule adds a fourth option by establishing criteria under which MPOs may seek an exception from the new unified planning requirements (See ‘Exception Process’ below).

Under the final rule and the underlying statute, MPA boundaries cannot overlap. FHWA and FTA plan to provide future guidance on making MPA boundary adjustments. The agencies also plan to issue guidance and offer technical assistance to help states and MPOs understand options for coming into compliance with the rule.

FHWA and FTA also plan to engage with the U.S. Census Bureau to provide input into how UZAs should be delineated following the 2020 decennial census to help address concerns that UZAs may not reflect regional transportation patterns and systems.

The final rule maintains the provision in the proposed rule that metropolitan planning agreements would be required to identify strategies for cooperative decision-making and a dispute resolution process. The final rule does not establish a default dispute resolution process.

Phase-in period

The final rule extends the implementation period for MPA boundary and MPO jurisdiction agreement provisions, documentation of the determination of the governor and MPO(s) that the size and complexity of the MPA make multiple MPOs appropriate; and MPO compliance with requirements for unified planning products. Compliance must be achieved by the next metropolitan transportation plan update that occurs two years after the U.S. Census Bureau releases its notice of Qualifying Urban Areas after the 2020 census. Since this notice is typically released two years after the census, that effectively pushes compliance out to 2024.

In the proposed rule, states and MPOs only had two years from the date of the final rule to incorporate the required changes.

In addition, the final rule extends the time period for adjusting MPA boundaries after a decennial census from 180 days to two years. This means that if a decennial census results in two previously separate urbanized areas being defined as a single urbanized area, then the governor and MPOs would have two years after the census release to re-determine the affected MPAs as a single MPA that includes the entire new urbanized area plus the contiguous area expected to become urbanized within a 20-year forecast period of the transportation plan. The new single MPA may still be served by multiple MPOs, if the governor and the MPOs determine that the size and complexity of the MPA make the designation of multiple MPOs appropriate.

The compliance date for all other changes made by the rule are effective upon the date of the final rule, January 19, 2017.

Exception process

Nearly a month after the public comment period for the NPRM for this rule closed, USDOT decided to reopen the rule for an additional month of comments. During this comment period, USDOT specifically asked for feedback on establishing potential exceptions, including criteria for those exceptions, in the final rule. (See T4America summary here). The final rule addresses the comments received by establishing a new exception process, under which multiple MPOs in a single Metropolitan Planning Area (MPA) may be granted an exception to the unified planning products requirement

APPLYING FOR AN EXCEPTION

All MPOs in the MPA and the governors of all affected states must submit a joint written request and justification to FHWA and FTA that both:

  • explains why it is not feasible, for reasons beyond the reasonable control of the governor(s) and MPOs, for the MPOs to produce unified planning products for the MPA; and
  • demonstrates how the multiple MPOs in the MPA are effectively coordinating with each other and producing consistent MTPs, TIPs, and performance targets, and are therefore, already achieving the goals of the rule through an existing coordination mechanism.

If the U.S. Secretary of Transportation determines the exception request does not meet established requirements, the Secretary will send the governor(s) and MPOs a written notice of denial of the exception, including a description of the deficiencies. The governor(s) and MPOs have 90 days from the receipt of the notice to address the identified deficiencies and submit supplemental information for review and a final determination by the Secretary. The Secretary may extend the 90-day period upon request.

An approved exception is permanent. FHWA and FTA will evaluate whether the MPOs covered by an exception are sustaining effective coordination processes that meet the requirements described above through their certification reviews and planning findings.

FHWA and FTA plan to develop guidance on how requests should demonstrate that current coordination procedures meet the exception requirements. This may include, for example:

  • documenting a history of effective regional coordination and decision-making with other MPOs in the MPA that has resulted in consistent plans;
  • submitting procedures used by multiple MPOs in the MPA to achieve consistency on regional priorities and projects of regional impact; and
  • demonstrating the technical capacity to support regional coordination.

WHAT QUALIFIES FOR AN EXCEPTION

The exception process is intended to address cases where it is not feasible for MPOs to prepare unified planning products due to conditions affecting coordination or other aspects of the unified planning process. FHWA and FTA intend to provide guidance regarding the types of situations where an exception may be appropriate.

In the final rule, FHWA and FTA acknowledge that a multistate MPA typically presents greater coordination challenges and governors and MPOs of multistate MPAs may seek exceptions. While an exception will not be granted to MPAs simply because an MPA crosses state lines, exceptions may be granted to ensure that the MTP and TIP appropriately address the needs of the MPA as a whole.

Exceptions may be granted where it is infeasible to develop unified planning products due to the number of MPOs in the MPA, the number of political jurisdictions within separate MPOs serving a single MPA, the involvement of multiple states with differing interests and legal requirements, or transportation air quality conformity issues.

Exceptions may also be granted for cases where using unified planning products in the MPA would produce unintended consequences that run contrary to the purposes of the rule. If applicable, a request for an exception should provide evidence for concerns related to public involvement, Title VI, or environmental justice requirements.

USDOT notes in the final rule that FHWA and FTA cannot provide exceptions based on the population in an MPA, the size of the part of a UZA that crosses into an adjoining MPO’s planning jurisdiction, the degree to which the MPA includes rural areas, or the air quality status of the area.

Air quality conformity

The final rule removes language originally included in the NPRM that called for MPOs sharing an MPA to agree on a process for making a single air quality conformity determination on their plan and TIP. Instead, during implementation of the final rule, FHWA and FTA will coordinate with the EPA on maintaining consistency with EPA’s transportation conformity regulations, seeking to avoid the impact on nonattainment and maintenance area designations, and on the need for state and local air quality agencies to revise approved state implementation plans, motor vehicle emissions budgets, and conformity procedures. FHWA and FTA also plan to work with EPA to provide technical assistance and training to help MPOs address conformity issues.

If it is not feasible for multiple MPOs serving the same MPA to comply with unified planning products requirements due to conformity issues, the MPOs and governor(s) may request an exception.

Metropolitan planning for healthier, safer, more prosperous regions

How can metro area planning agencies strengthen the local economy, improve public health outcomes for all of their residents, promote social equity and better protect the environment? Join us to hear the stories of how a handful of metro areas have found smart, data-driven ways to better conceive, select and build the transportation projects that will help meet those regional goals.

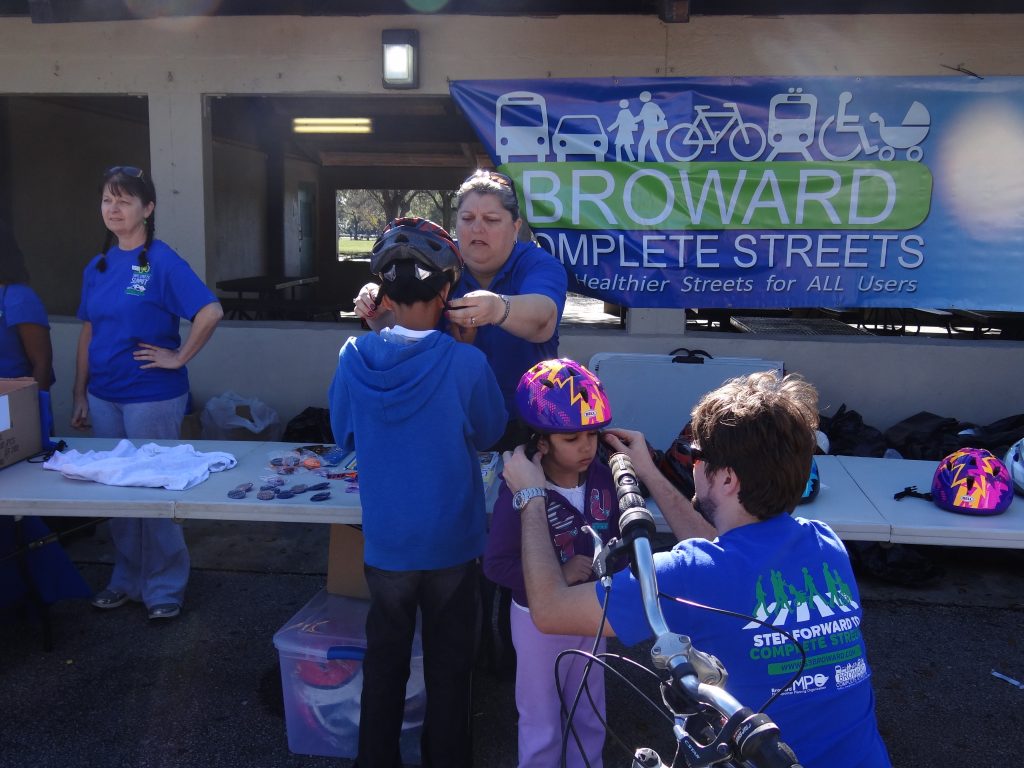
Flickr photo by the Broward MPO. /photos/speakupbroward/24986492294

Flickr photo of an event by the Broward MPO. /photos/speakupbroward/24986492294

Metropolitan planning organizations (MPOs) not only have responsibility to create regional plans that govern federal spending within their borders, but those in larger regions also control a limited amount of transportation funds directly. How they manage these responsibilities has a huge impact on the health of their residents and their access to jobs and other opportunities.

Can the people in neighborhoods more likely to be unhealthy easily get out for a walk or bike ride without having to traverse dangerous streets? Does an MPO effectively consider the impacts on regional air quality as they choose which projects to build? Is the area putting forward the most competitive possible walking and biking projects to win limited state or federal funding?

We’re excited to bring you the stories of a handful of MPOs that have good answers to all of these questions next week via a new series of short case studies and an accompanying webinar on Thursday, September 22 at 1 p.m. EDT. Register for the webinar with the link below.

REGISTER NOW


Register for the webinar and you’ll be the first to receive a copy of these new case studies. If you work for an MPO, advocacy group or health organization and want to learn about ways to increase or improve the quantity and quality of active transportation projects in your region, this one is for you.

The MPOs we’re featuring have found ways to better use data and modeling tools to win funding for active transportation projects, standardize the process for building safer, more complete streets, or promote health and economic prosperity through transparent, data-driven decision-making. And we’re excited to share their stories with you.

On the webinar, we’ll have a short conversation with staff from four MPOs featured in the case studies. They’ll share details on their policies and programs, the transportation projects that resulted and the partnerships they had to forge to taste that success.

Join our team and experts on September 22nd at 1pm EDT. Register today!


Development of the case studies featured in this webinar was made possible through a contract between the American Public Health Association and Transportation for America funded through cooperative agreement 5U38OT000131-03 between the Centers for Disease Control and Prevention and the American Public Health Association.  The contents of this document are solely the responsibility of the authors and do not necessarily represent the official views of the American Public Health Association or the Centers for Disease Control and Prevention.

Announcing a new academy for local leaders who want to dig in on performance measures for transportation

In partnership with the Federal Highway Administration (FHWA),T4America is announcing a new yearlong training academy for metro regions that are hoping to learn more about the emerging practice of performance measurement, and applications are open now.

Transportation leadership academy performance measures

2012’s transportation law (MAP-21) ushered in a new era, creating a nascent system for states and metropolitan planning organizations (MPOs) to better determine success or failure by measuring the performance of their investments against federally-required measures. Some metro areas have been doing this for years before MAP-21 passed, and others are now scrambling to understand how to incorporate this new system into their process of creating plans, selecting projects, and measuring the effects of those projects and the effectiveness of each transportation dollar that gets spent.

Register for the webinar


This year-long leadership training program will educate local business, civic, elected leaders, and practitioners at the early stages of performance measure development, and will prepare participants to act on opportunities within their communities while plugging them into a dynamic national network of like-minded leaders throughout the country.

We know it sounds like wonky stuff, but with money for transportation harder to come by than anytime in recent history, a more accountable system that sets goals with input from the community, chooses transportation projects accordingly to meet those goals, and then measures the outcomes in a feedback loop will be essential for ensuring we get the best bang for the buck going forward.

This new academy for 2016 builds off the successful experience in 2015 with our partners at TransitCenter in a similar yearlong academy with leaders from three metro regions who have plans to invest in transit as part of their long-term economic development strategies. There are scores of smart, capable people at the local level who are trying to make great things happen in their communities, and we’re hopeful that this Transportation Leadership Academy will provide participants at the metropolitan level with the tools and support they need to set up a system for measuring performance to guide their planning and project selection processes.

Four things to know about applying: Get your application. Common questions are answered in this FAQ. Applications are due on November 13th. We’re hosting an informational webinar on October 21st at 2 p.m. EDT for those who want to learn more. Register for the webinar today.

Who should apply: Individuals who are working on transportation at the metropolitan level in regions that are at the early stages of performance measure development. Participating individuals may include local business, civic, elected leaders, and practitioners. For example, individuals may be elected officials on the board of an MPO or senior staff of chambers of commerce, labor organizations, civic groups, community associations, local or regional foundations, or major employers. Each regional team should have a participating staff member or board member of their local MPO. Both a staff member and Board member are encouraged to participate on a team.

Not sure who your MPO is? Search USDOT’s database of MPOs to find out. 

How can MPOs and citizens better engage with each other?

Building on the range of new ideas for metropolitan planning organizations outlined in our Innovative MPO Guidebook, join us on September 30, 2015, at 3 p.m. EDT for the fourth webinar in our series as we address a common complaint from both metropolitan planning organization (MPO) staff and citizen activists: how to best engage one another to shape the regional planning process.

In next week’s webinar, we will offer examples of reliable and cost-effective options to interact with the public, including a preview of a new resource we’re producing on an approach known as “creative placemaking” which will be released this Fall.

Innovative MPO web graphic 2Join experts from T4A and the Indian Nations Council of Governments (INCOG) from Tulsa, Oklahoma, to learn helpful techniques that support planning processes and community partnerships.

Register today for our Innovative MPO webinar on Wednesday, September 30th, at 3pm.

By the way, if you haven’t yet read it, our Innovative MPO Guidebook offers examples that both groups can use to bring them closer together. Cost effective techniques such as scenario planning, new technologies and toolkits are just a few of the innovative examples the guide covers. You can read and download the guidebook for free.