
More highways, more driving, more emissions: Explaining “induced demand”

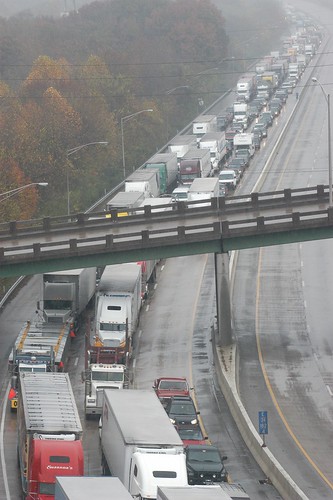
Even if we hit the most ambitious targets for changing our cars and trucks over to electric vehicles, we will fail to meaningfully reduce emissions from transportation without confronting this simple fact: new roads always produce new driving. This costly feedback loop referred to as “induced demand” is the invisible force short-circuiting the neverending attempts to eliminate congestion by building or expanding roads.

This gif explaining induced demand is from Driving Down Emissions

Today, Transportation for America is partnering with RMI and the Natural Resources Defense Council to release a new calculator that shows how highway expansion repeatedly fails to reduce congestion and instead increases traffic and pollution. The SHIFT Calculator provides transparency about new traffic created by highway widening and expansion so transportation agencies can make smarter, more sustainable transportation investments. Read the press release.

Check out the calculator here

Imagine a guy who, struck with a wild but charitable fever of generosity, decided to give away 100 gallons of tasty, free coffee every morning at a small downtown stand. During that entire first week, he struggled to give it all away before lunchtime and went home with quite a few gallons of leftover lukewarm coffee. In week #2, he started seeing familiar faces each day from the nearby buildings, because people walking by know a good deal when they see one (the low price of free!) Many of them returned each day and the coffee was gone by 11 a.m. By the third week, the word was out across downtown about the “crazy free coffee guy” and he started running out earlier each day. By the start of week four, people were coming from all over downtown and he had a line queued up waiting for him at 7 a.m. to ensure they got their free cup before work, and it was all gone before 9 a.m. 

Say hello to “induced demand.”

Giving something away for free shapes the behavior of those who want it

It’s a fundamental principle of economics: Provide a tangible good at no cost that people value and the demand will outstrip supply.

Yet political leaders and transportation agencies refuse to believe that this same basic principle will apply when they spend billions to widen or expand highways in the name of “solving” traffic congestion in urban regions, and then give away all of that newly created space for free. They refuse to believe that anyone will take new trips on the newly freed-up highway space, that people will shift existing off-peaks trips to rush hour, that someone on transit might decide to return to driving (like thousands of people did during the pandemic), or that developers might take advantage of the new capacity to build yet more houses or retail on land that’s now more easily accessible.

They refuse to believe that this is possible, even when all of that expensive new highway space fills right up in a short period of time, wiping out any benefits and failing to deliver on all those promises of speedy commutes, improved travel times, and money in our pockets from all the “time savings.”

Attempting to “solve” congestion by building new roads or expanding existing ones has been the animating purpose behind billions of dollars of federal and state transportation investment for decades now. 

Armed with this single-minded purpose and billions in no-strings money from the federal government, states have spent hundreds of billions of dollars to widen or build new highways. We built enough new roads and lanes from just 2009-2017 to build a brand new road back and forth across our enormous country 83 times. State transportation departments have added 5,325 new lane-miles just since 2015.

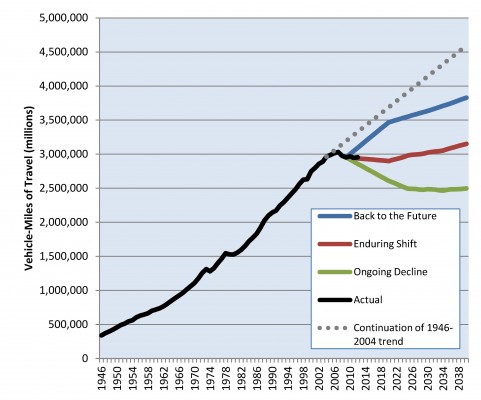
All the lanes we’ve built have led to a predictable increase in driving. From 1980-2017, per capita vehicle miles traveled (VMT) increased by 46 percent. In 1993, on average, each person accounted for 21 miles of driving per day in those 100 urbanized areas. By 2017, that number had jumped to 25 miles per day. Every year, Americans are having to drive farther just to accomplish the same things we did back in 1993 every day.

The problem isn’t too few roads

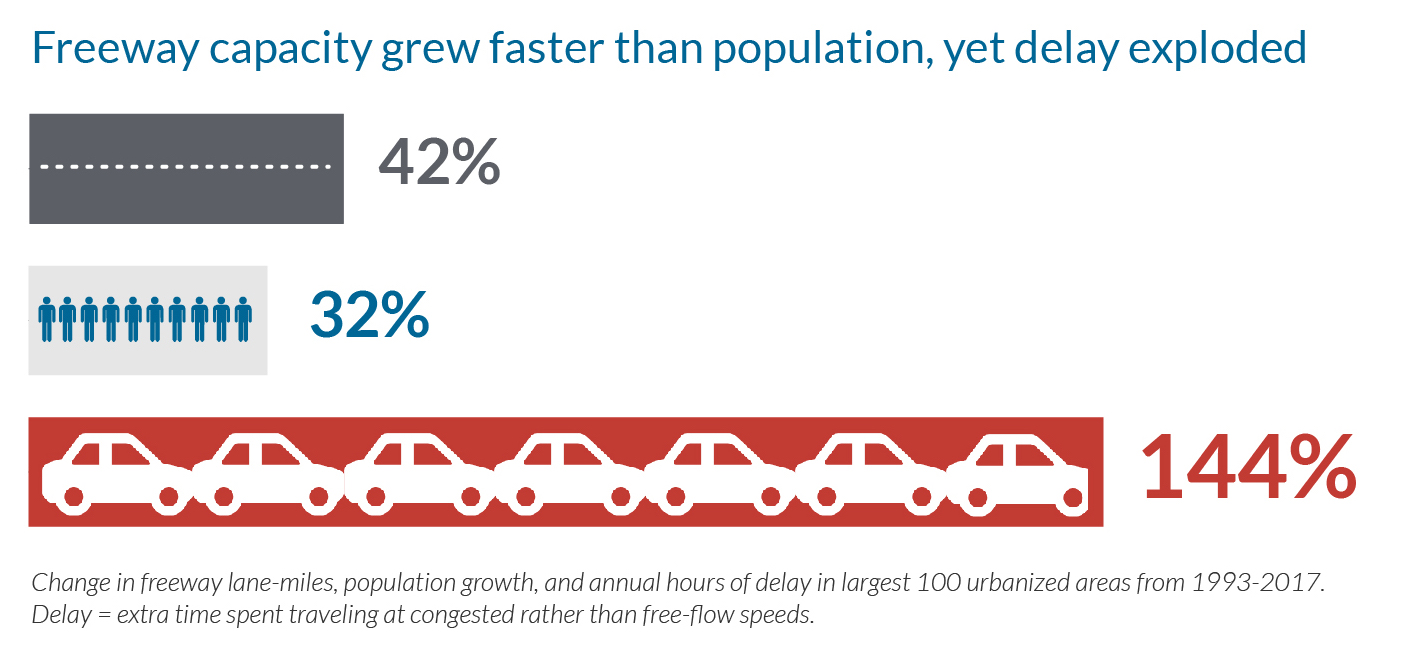
Delay skyrocketed in our 100 largest urbanized areas from 1993-2017, rising by 144 percent. Yet we expanded our freeway system in those areas by 42 percent, while the population only increased by 32% during that time. We built roads like crazy, yet delay just got worse.

Delay increased because new highways, roads, and lanes are proven to induce more driving, which leads to more emissions and ultimately more congestion. The evidence for induced demand is overwhelming. In a landmark study, Kent Hymel at Cal State Northridge suggests the relationship is perfectly correlated—a 10 percent increase in lane miles leads to a 10 percent increase in driving.

If you’re celebrating the notable but small climate and transit provisions in the current enormous infrastructure deal, you should know that this shortsighted 1950s-style deal will provide states with historic levels of virtually no-strings highway funding that they can continue to blow on the same old bankrupt strategy for congestion without even any basic requirements to repair things first.

Profligate spending on highways also undermines the relatively limited investments being made in other lower emission transportation options like biking, walking, and transit.

Why do transportation agencies deny this reality?

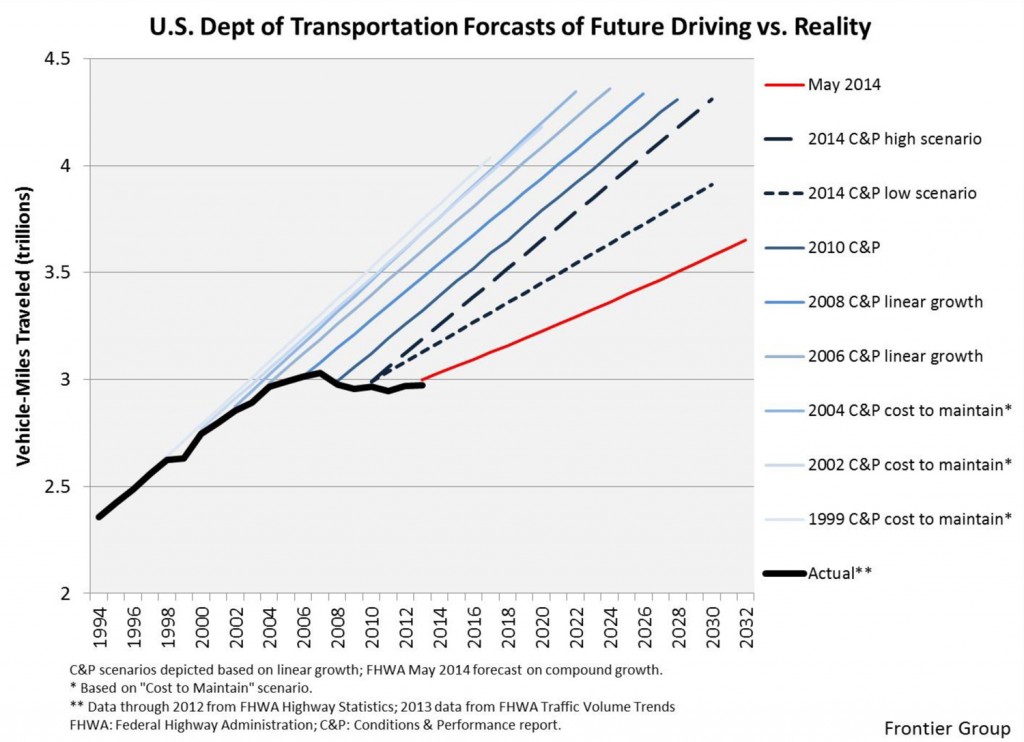
The unreliable models that agencies depend upon have a poor track record of success, but they never look backward to consider their accuracy or how they can be improved.  When is a state DOT ever held to account for repeatedly making predictions about traffic that fails to materialize? Who even remembers what they predict? This great thread from Kevin DeGood about Texas DOT’s repeated failure to make accurate predictions shows just how rarely anyone looks backward:

19 years ago, the Texas DOT predicted that average daily traffic (ADT) on I-35 through downtown Austin would be 330,000 daily vehicles by last year. The reality wasn’t even close: Actual totals in 2019 were only 201,000 daily trips. As Kevin notes, in 2016, with the state totally ignoring how wildly inaccurate their current projections were turning out to be, they projected “that total VMT on I-35 in the Austin area would increase by 50% by 2040.”

Rinse and repeat. 

TxDOT is certainly doing their best to make those 2040 projections come true. All it’s going to cost taxpayers is $5 billion to widen I-35 right through downtown.

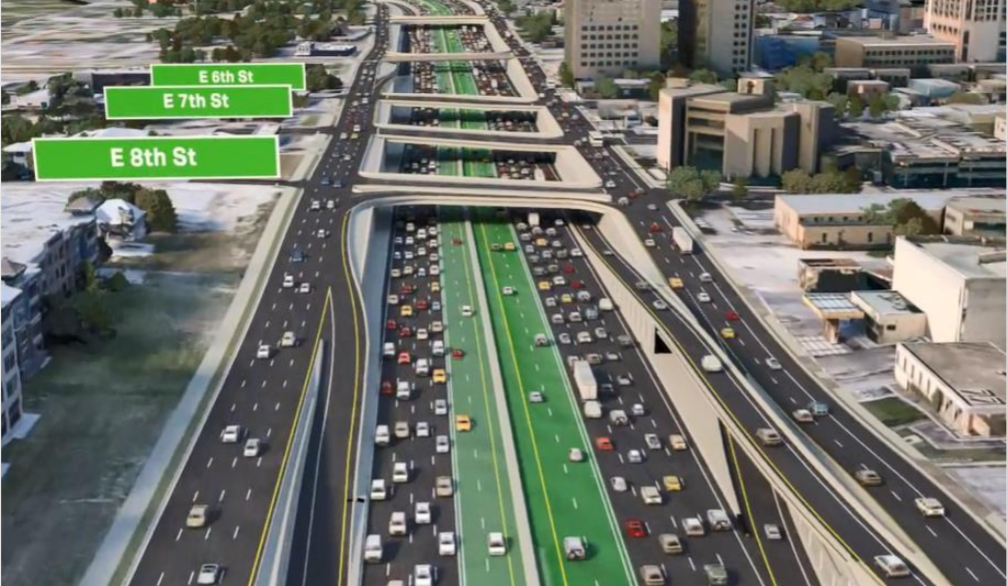
If the state follows through on this staggeringly expensive project, they’d be creating millions of new trips and increasing pollution, all while failing to make a dent in congestion over the long term and wiping out hundreds of acres of some of the most valuable land in the entire state.

Screenshot of SHIFT calculator's results on Austin, TX I-35 widening project
This data comes from the new SHIFT Calculator’s estimates for the I-35 widening project which would add 42 lane-miles to the interstate through downtown Austin

The cynical answer to “why” is that if state DOTs around the country finally admitted that expansions fail to actually solve congestion, they would lose their #1 strategy of continued expansions that allow everyone other than the taxpayer to make more money. They’d be admitting that they’ve placed all of their bets on a losing horse, and they’ve been doing so for years. On top of that, they’d then have to do far more sophisticated work to better understand the complicated reality of our travel needs and rebuild their models from the ground up to focus on moving people rather than just “make cars go fast.” 

Even the most progressive states with ambitious agendas to lower transportation emissions aren’t fully willing to acknowledge this reality

Advocates and residents and local leaders need to start holding them to account. How?

We can’t put our heads in the sand anymore

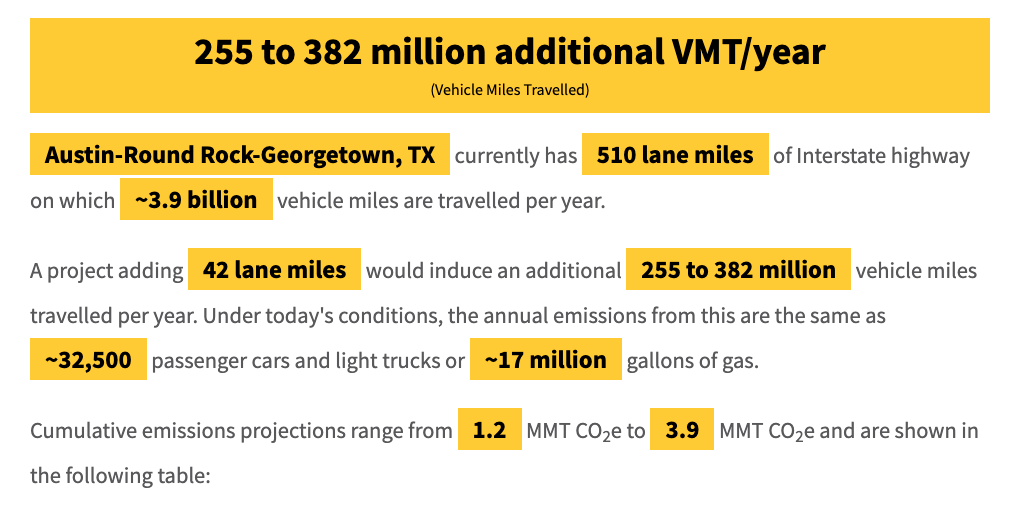
This new, rigorously vetted calculator produced by RMI, the Natural Resources Defense Council and Transportation for America provides more accurate and transparent data about increases in driving and pollution, as well as the other impacts of highway expansions. 

Our hope is that advocates, local governments, and anyone who cares about finally getting more accurate and transparent data about increases in driving and pollution will use this new tool to hold their transportation agencies to account. And we want transportation agencies to use it to bring a fuller picture to their current transportation modeling that leads them to “solutions” that fail to address congestion, divide neighborhoods, increase pollution, devastate nearby communities, and fail to meaningfully improve our access to jobs and services.

Find a proposed project in your metro area and run it through the calculator.


Some parts of the above post were adapted from Driving Down Emissions, a report from Smart Growth America and Transportation for America which explores how changing transportation policy and land-use patterns are key to lowering greenhouse gas emissions.

Minnesota takes important steps to drive down emissions

To address urgent climate needs, every state will need to make it possible for their residents to drive less every day. But too many shy away from taking concrete steps to do so, putting all of their efforts into improving fuel efficiency and electric vehicle adoption. The Minnesota Department of Transportation (MnDOT) just took a key step in the fight against climate change: setting an ambitious target for reducing driving (measured as vehicle miles traveled, or VMT). 

Riders on a bus in the Twin Cities of Minnesota, June 2020. Photo by Metro Transit.

The Minnesota Department of Transportation (MnDOT) recently made a highly anticipated decision to adopt a number of recommendations from the state’s Sustainable Transportation Advisory Council (STAC) made in December 2020, including setting a preliminary statewide goal for a 20 percent VMT reduction statewide and per capita by 2050. For the average Minnesota driver, that will mean traveling about 45 miles less per week in 2050 than today. 

MnDOT’s VMT reduction target is preliminary, and will be finalized after engaging the public and stakeholders through the Statewide Multimodal Transportation Plan process that will occur throughout 2021. MnDOT may also set interim targets, as well as different targets for the Twin Cities region (which already has locally-established targets) compared to the rest of the state.

Minnesota has already had some success reducing emissions from the transportation sector in recent years, particularly compared to some of its peers, but setting VMT reduction goals has been a gap in the state’s efforts. We highlighted the need for VMT reduction targets with our partners at Move Minnesota in our Minnesota case study for our Driving Down Emissions report, as have local advocates and stakeholders, so it is great to see the state step out as a national leader working toward reducing the need to drive. 

This step is a big deal—most states are still heavily focused on improving fuel efficiency standards and electric vehicle adoption with little or no emphasis on how growing VMT is undercutting those efforts. This is shortsighted and leaves valuable strategies that would also create more livable and equitable communities on the table. 

Importantly, MnDOT also plans to develop an approach for estimating the VMT that will result from its program and proposed projects by assessing both induced demand from adding lanes and reduced demand from increasing walking access. MnDOT will also evaluate the accuracy of existing travel demand forecasting methods—an important step, since many traditional forecasting models have a poor track record of accuracy and can prompt premature or unnecessary highway expansions that induce more driving and more emissions. 

Minnesota isn’t the only state taking action this month to reduce emissions by reducing the need to drive. The California State Transportation Agency (CalSTA) recently released a public discussion draft of its plan to reduce VMT. The Climate Action Plan for Transportation Infrastructure (CAPTI), created in response to Governor Gavin Newsom’s executive order, will be finalized later this year. It includes 28 action items with a number of potential strategies aimed at reducing driving, including pricing, using state transportation funds to incentivize land use decisions that reduce the need to drive, and establishing VMT mitigation banks that allow transportation project sponsors to purchase VMT allowances if their project will induce more driving, creating a fund for VMT-reduction projects. 

California’s plan also includes strategies aimed at addressing the transportation system’s entrenched inequities, such as pollutants that disproportionately affect low-income and minority communities. And California has also already developed an approach for estimating the induced driving that will result from its highway projects, which other states can and should adopt. 

We are very excited to see MnDOT take bold steps to address climate change emissions in transportation by addressing the role the transportation system plays in forcing people to drive more and further. They are showing themselves to be leaders and we hope to see many more states follow.

Webinar recap: How the Senate’s transportation proposal would make climate change worse

Transportation is the largest source of U.S. carbon emissions, and most of it comes from driving. But a long-term transportation bill passed by a Senate committee last summer would only make this problem worse. Last week, along with Third Way, we discussed the role federal transportation policy plays in making climate change worse—and what a better transportation bill looks like. 

Last summer, the Senate Environment and Public Works (EPW) Committee passed a long-term transportation bill that was, quite frankly, a wolf in sheep’s clothing. The bill included a groundbreaking $10 billion for carbon reduction programs (“groundbreaking” simply because no prior transportation law had ever included any climate-related funding), while pouring 27 times that amount into programs that are perfectly designed to increase carbon emissions.. 

That’s why we teamed up with Third Way to host a webinar debunking the bill’s climate-friendly ethos. Our Policy Director Scott Goldstein and Third Way’s Transportation Policy Advisor Alexander Laska discussed how the Senate bill will just wind up increasing emissions, and what a better long-term transportation bill looks like (psssssh: it looks an awful lot like the bill passed by the House of Representatives this summer). 

Here are three of the most frequently-asked questions from the webinar. 

Why isn’t electrifying vehicles enough to reduce transportation emissions? 

The reason: Americans are driving more than ever, and electrification can’t keep up with the pace of growth. As federal transportation policy and funding encourages more and wider highways, destinations—like housing, businesses, schools and more—get placed physically farther apart from each other to accommodate highways. This results in people living further away from the things they need and the places they go, causing them to drive further and further just to reach everyday destinations, as our former colleague Emily Mangan wrote in this slam dunk of a blog post

This ever-increasing driving (known as “vehicle miles traveled”, or VMT) is why emissions have increased despite relatively large increases in fuel efficiency standards and the slow-but-steady adoption of electric vehicles thus far. Despite an admirable 35 percent increase in the overall fuel efficiency of our vehicle fleet from 1990-2016, emissions still rose by 21 percent. That’s because the total amount of miles traveled increased by 50 percent in that same period. 

If we only electrify the fleet but don’t find ways for more people to drive less each day, this trend will continue to go in the wrong direction. And make no mistake, this Senate bill gives states billions in new money for new roads that will just produce more driving.

What role does Congress play in local land use decisions? 

The common belief is that land-use decisions are made strictly at the local level, and that the federal government has no role or effect on them. That’s false. Federal policy plays an enormous role in local land use decisions, largely due to the incentives that federal programs create. 

In the federal transportation program, 80 percent of funding is set mostly for highways, where the overarching priority is to increase vehicle speed, not to improve safety, not to make it easier to bike or walk, and not to make transit more efficient. As a result, towns and cities make decisions in response to these federal priorities and investments: they’ll widen a highway instead of repairing the existing street network or building a protected bike lane, and decide to zone more land for low-density housing or retail. 

Changing federal incentives can have a ripple effect on local land-use decisions. Allowing cities and towns to use transportation dollars to invest in transit operations and maintenance might encourage local governments to make zoning decisions that support those investments: that means denser, walkable neighborhoods and downtowns. 

Congress can also unlock more federal funding for equitable transit-oriented development. As we wrote with Third Way in their Transportation and Climate: Federal Policy Agenda, Congress should require that the U.S. Housing and Urban Development Department (HUD) and U.S. Department of Transportation (USDOT) coordinate to leverage billions of dollars in existing loan authority that could support mixed-income, mixed-use development and provide new revenue streams for transit, affordable housing, and local governments. 

How can college-aged students and climate activists help amplify the importance of this issue?

There’s a lot that anyone can do to make sure that long-term transportation policy actually reduces carbon emissions. 

It’s vitally important that members of Congress understand the connection between transportation and climate change. Anyone can understand that cars pollute the air, but making the next step—that we need to reduce driving, not just electrify it—is something that needs to be explained to many people, particularly our elected officials. The failure to understand this point has been bipartisan.It’s not enough to somehow make every vehicle electric: we also need a transportation system that allows more people to bike, walk, and take transit, as well as take shorter trips in a vehicle. Making marginal changes to yesterday’s transportation policy won’t get us there. 

We have a couple of ways you can start educating your members of Congress about the real connection between climate and transportation: 

  1. Send a letter to your members of Congress explaining why the Senate EPW Committee’s long-term transportation bill is actually really bad for the climate. We have a draft letter you can use, which you can find here
  2. Tweet at your members of Congress (particularly your Senators) to urge them to pass a climate-friendly transportation bill. You can use our social media toolkit
  3. Submit a short letter to the editor to your local newspaper explaining what it takes to truly reduce transportation emissions: investment in a transportation system that makes shorter trips, biking, walking, and riding transit possible. 

How cities can reduce traffic instead of just ensuring more of it

A developer paying the cost to install a new bike share station could be a way to gain credits toward a building permit under the plan outlined in Modern Mitigation. (Image: Euan Fisk, Flickr)

A new approach to addressing the potential transportation impacts of new development in urban areas, outlined in a new report by the State Smart Transportation Initiative (SSTI), another program of Smart Growth America, could be a powerful recipe for reducing the demand for driving, while helping create more prosperous transit- and pedestrian-friendly cities.

For decades, most local, regional, and state governments have had a myopic approach to handling the transportation needs related to infill development: they require developers to add more street/road capacity. And this single-minded approach has produced exactly what one might expect: Lots of new, expensive roads that actually increase driving, and with it pollution, emissions, roadway deaths, and impediments for people trying to get around without cars.

A more productive approach seeks to minimize traffic from development before resorting to just building expensive, bigger and wider roads. This new report from SSTI outlines a modern method for cities and the private sector to partner together in reducing the demand for driving as cities build, grow, and thrive.

On October 29 at 2:00 p.m. ET, join Eric Sundquist, SSTI Director; Ramses Madou, Transportation Planner with San Jose Department of Transportation; and moderator Beth Osborne, Senior Policy Advisor at Smart Growth America for a lively discussion of the opportunities and challenges of moving from LOS to VMT and what steps are needed to make this shift work.

Register for the webinar

Cities conventionally manage the impacts of development by adding capacity for automobiles, often providing no support for anyone outside of a vehicle. But this strategy only encourages more driving, and the roads and city in general become much less pedestrian-, bicyclist-, and transit-friendly. It also creates more emissions at a time when many cities are trying to reach ambitious climate goals.

It’s a self-fulfilling prophecy: If we think of accommodating more driving as the only solution, it will inevitably get harder for people to walk or take transit, and more trips will be taken in cars.

Cities thrive with a concentrated mix of people and uses—the more jobs, people, and activities within reach of each other, the greater the economic benefit from being able to easily access all of this opportunity. Asking developers to provide services and amenities that allow people to move around with fewer car trips will reduce the traffic impacts of new development, benefit all, and will help cities avoid super-sizing our roads and intersections.

This report offers a way to do this within the city development process.

What would a better approach look like?

This new report—Modernizing Mitigation—suggests a system that rewards developers for a range of transportation improvements they can provide, making them partners in an effort to produce people-friendly neighborhoods. Actions developers can take include improving the infrastructure for walking, biking, or transit; providing complementary land uses that minimize the need for new trips; subsidizing other forms of mobility like bike sharing or car sharing; or providing first- and last-mile connections to high-capacity transit (like a regular shuttle).

Changes to the pedestrian network and the improvement of crosswalks to add connectivity (left) and accessibility improvements from these connections (right) can be quantified in order to provide mitigation credits.

The contributions would be scaled to the amount of parking provided. The more parking a developer provides, the more they’d have to do to reduce demand (or through in lieu fees for non-auto services and facilities.) Or a project with no parking could be exempt from the other measures.

This helps produce a city where development can be seen as a positive contributor to a more prosperous place, rich with opportunities for all, as opposed to just the culprit to blame for more traffic.

This new approach can help put cities and developers on the same team, rather than working against one another to produce all the wrong outcomes. The report includes an examination of different cities’ policies along these lines, as well as a detailed look at precisely how this system could work with a real scale of points and incentives.

Much of the report was the product of SSTI’s practical work with the City of Los Angeles to develop a system for LA, but the suggested point system and requirements could be easily adapted by any other city to their local environment, priorities, or goals.

Download the full report and join us for the webinar on October 29.

What can other states learn from California’s shift to better measure how streets move people

In 2013, the State of California passed legislation that makes a dramatic change in how the state measures the performance of their streets. Rather than use the traditional level of service (LOS) measure that focuses far too narrowly on moving as many cars as fast as possible — regardless of the context or needs of a street — California’s Office of Planning and Research (OPR) is shifting to an alternative of measuring vehicle-miles traveled (VMT).

In this first post of a six-post series only for T4America members, Transportation for America will walk through the change from LOS to VMT, highlight the opinions of a variety of leaders on this issue and discuss the implications for California’s transportation system and potential implications nationwide.

Reminder, moving away from level of service (LOS) was one of the key recommendations in our new state policy report, released in January 2016. Don't miss that helpful resource.

Note: moving away from level of service (LOS) was one of the key recommendations detailed in our new state policy report, released in January 2016. Don’t miss that helpful resource.

In 2013, Governor Jerry Brown signed into law SB 743, eliminating the use of LOS for projects within designated transit priority areas (TPAs). As Streetsblog LA reported in 2013, SB 743 was a compromise between interests who wanted the full elimination of LOS in California and advocates pushing for the full and immediate elimination of LOS as a requirement for any project. But, because most urban areas fall within the state-defined parameters of a TPA, the enactment of SB 743 means that LOS is largely eliminated for urban projects.

Additionally, SB 743 authorized Governor Brown to develop a new way of measuring traffic impacts of major projects statewide and based the new way on total VMT rather than intersection congestion. (1) This will change how development projects are analyzed and scored in traffic impact studies and thus the type of development projects that California supports.

What this means

In short, instead of measuring whether or not a proposed project will make it less convenient to drive, (CalTrans) will now measure whether or not a project contributes to other state goals, like reducing greenhouse gas emissions, developing multimodal transportation, preserving open spaces, and promoting diverse land uses and infill development. (2) It is expected that this change will make it easier to build transit projects, as well as bicycle and pedestrian-friendly infrastructure.

But perhaps a larger change will be the type of development the law now encourages. Instead of encouraging sprawl that goes against California’s own environmental goals, these new guidelines will encourage development that moves California to a more sustainable transportation system. (3)

Status of Draft Guidelines

In August 2014, OPR released draft guidelines proposing to substitute VMT for the LOS metric (as authorized by SB 743). Under the draft guidelines, California no longer considers bad LOS a problem that needs fixing under the California Environmental Quality Act (CEQA). (4)

On January 20th 2016, OPR released the final draft of the changes to CEQA. The January 20th release signals the 45-day initial public comment period before finalizing the proposal and submitting to the California Natural Resources Agency to begin the formal rulemaking process under the Administrative Procedure Act. The regulations are anticipated to be effective statewide in 2019. (5)

Final Guidelines

The final guidelines are very similar to the draft guidelines with only slight changes. In the final proposal, OPR continues to recommend replacing LOS with VMT as the primary metric for analyzing a project’s transportation impacts, including the presumption that projects near transit (1/2 mile or less) should be presumed to cause a less than significant transportation impact and that transportation projects which add lane miles may result in induced vehicle travel. (6) In a big win for smart growth advocates, the guidelines emphasize that effects on automobile delay do not constitute a significant environmental impact. (7)

The new guidelines would remain optional for a two-year period following adoption, but would apply statewide to all development projects by 2019. (8)

Draft Guideline Rules on Impact Analysis

The final guidelines contain significant changes on the types of triggers needed to spur an environmental impact statement. Divided into three categories; land use projects, residential projects and office projects, all triggers are established at below a commonly accepted baseline level. The new proposal attempts to streamline the implemention of SB 743, with recommendations regarding significance thresholds, for required traffic analyses of development projects. (9)

These new threshold guidelines mean that development projects that will significantly increase the amount of automobile traffic that will be required to undergo rigorous environmental impact statements to ensure that they are compliant with California’s statewide greenhouse gas law.

Citations:

  1. Newton, D. and Curry, M. (2014, August 7th). California Has Officially Ditched Car-Centric ‘Level of Service’. LA Streetsblog. Retrieved February 1st from /http://la.streetsblog.org/2014/08/07/california-has-officially-ditched-car-centric-level-of-service/
  2. Newton, D. (2016, January 22nd). State Releases Proposed Rules That Would Finally End LOS in Enviro. Law. Streetsblog California. Retrieved February 1st from http://cal.streetsblog.org/2016/01/22/state-releases-proposed-rules-that-would-finally-end-los-in-environmental-law/
  3. Ibid 2
  4. Ibid 2
  5. Ibid 3
  6. Lathom and Watkins LLP. (2016, January 26th). California Governor’s Office Releases Updated CEQA Guidelines Proposal on SB 743 Implementation. Retreived 2016/2/01 from http://www.lexology.com/library/detail.aspx?g=b070fa40-a4ff-4ce1-a6db-f2bd104cce31
  7. Ibid 5
  8. Ibid 5
  9. Ibid 5

Drop in driving growth is likely permanent, FHWA acknowledges, compounding the threat to transportation revenues

The slowing growth in the number of miles we drive each year looks like a permanent trend, according to the Federal Highway Administration, adding still more fuel to the fire in the debate over how to pay for a transportation program with dropping gas-tax revenues.

The most recent projections, released quietly last year but highlighted this week by USPIRG, are a significant departure for the federal agency charged with projecting the need for highway capacity and expected gas-tax receipts in the U.S. For the last several years, projections have substantially over-estimated the growth of “vehicle miles traveled”, which actually declined for several years before rebounding to a tepid pace more recently.

In this short document, FHWA projects that the amount of driving done by each American is unlikely to grow in the years to come. According to PIRG’s research, the agency had issued 61 straight forecasts that overestimated the actual increase in driving. FHWA is to be commended for taking a problem, rethinking it, and coming up with a better projection. The action clears up a discrepancy with the potential to hamper planning and decision-making, as we have noted in the past along with number crunchers at the State Smart Transportation Initiative, the Frontier Group and U.S. PIRG.

In this new FHWA projection, though the actual amount of vehicle miles traveled (VMT) is still projected to increase by 0.75 percent annually from 2012 to 2042 (the red line in the chart below), U.S. population is projected to grow by about 0.7 percent each year in that period, which means that driving per person is likely to remain flat. As FHWA’s report notes: “This represents a significant slowdown from the growth in total VMT experienced over the past 30 years, which averaged 2.08% annually.”

It’s worth noting that this change also has huge implications for toll roads. Building a new road, tolling an existing one, selling the rights to toll a road to a private company — those decisions are often being made using these outdated VMT projections.

USDOT vmt forecasts Frontier PIRG

This adjustment by the feds underscores the trouble ahead for transportation funding, absent congressional action.

The gas tax has already lost a third of its value due to inflation, improvements in fuel efficiency, and the overall reduction in driving over the last decade. All of this means that the gas tax doesn’t bring in as much money as it used to — leading to the perpetual annual shortfall in the Highway Trust Fund that has required numerous bail-outs from the general fund, using increasingly creative accounting gimmicks.

The excessive projections of expected driving have allowed some to point to an expected rebound that would help overcome some of the losses due to increased fuel efficiency. That will be tough to do in the face of the new estimates.

As Congress returns to face a May deadline for figuring out how to continue funding for transportation, members will have to come to terms with the likelihood that the gas tax will continue to lose value. The pensions have all been fully smoothed and the couch cushions have been emptied out. If Congress plans to make up the funding gap, they’ll have to be willing to raise the gas tax or index it to inflation, or increase some other revenue source.

We live in a different time today. We aren’t flush with gas tax revenues. We have a backlog of maintenance that can’t be ignored. The amount of driving Americans are willing to do has come close to reaching a peak. People are looking for different ways to get around each day. More Americans are moving into walkable neighborhoods where their commutes are shorter and options are greater.

We need a system of funding transportation and making investment decisions that recognizes these realities.

What happens when driving rates continue to drop?

Anyone who follows this blog, or transportation discussions in general, is well aware that the miles driven per American has been dropping in recent years and that the millennial generation (16-34) is leading the charge. Indeed, the typical American drives less today than at the end of Bill Clinton’s first term.

But how likely is that trend to hold in the future? And if it does, what does that say about what we should be building, and how we will pay for it, if not with the gas taxes raised from driving? A report out today from the U.S. PIRG Education Fund and Frontier Group seeks to answer the first question, and to fuel a conversation about the second.

None of the likely scenarios sees miles of driving returning to the heights of previous trends.

None of the likely scenarios sees miles of driving returning to the heights of previous trends. 

The short answer to Question 1: No plausible scenario sees per capita driving rates continuing their formerly inexorable climb, and all fall well below current government projections. And no, the authors do not assume that we are entering permanent economic recession, because the underlying are likely to trends persist whatever the strength of the economy:

Millennials. Americans under 35 drive nearly one-fourth less now than those who where the same age a decade ago. There are myriad likely reasons: The cost of car ownership, their tendency to live in more urban locales, reduced employment rates during the recession, etc. But the authors site many reasons why their driving rates may remain lower than previous generations, even during child-bearing years.

Baby boomers. The post-war generation drove workforce participation rates to unheard of levels, and now those workers are nearing the end of their commuting years. And while self-driving cars might allow granny to keep motoring, they will not replace those commute trips.

Technology. We already know the Internet allows work-from-anywhere and online shopping, replacing trips for those purposes. But now mobile tech makes riding transit far more accessible, and enables transit use to be complemented by a burgeoning array of options: Zipcar, Car2Go, bike share, Lyft, Scoot, etc. 

Vehicle operating costs. The era of dirt cheap motoring really does seem to have come to a close. It’s not just gas prices, which have helped fuel much of the recent shift; they’ll stay high for a while. But more and more tolls are coming into our lives, parking is astronomical, insurance is usurious. As long as options are available and cheap, a lot of households will own one car rather than two, and leave the one they have parked, until they decide they don’t need it.

[See how these trends are playing out in Charlotte in the NY Times’ excellent piece on 1A of today’s edition.]

Based on these and other factors, authors Phineas Baxandall and Tony Dutzik ran three scenarios for the future. None assumed a wholesale continuation of the depressed driving rates among millennials; all forecast younger folks to drive more in the child-rearing years. Still, none of the scenarios approached a return to the yearly mileage growth of the previous 60 years, and all fall below current government projections.

What does this mean for the future of our transportation programs? A lot less money, for one thing, unless we change our dependence on the gas tax:

Coupled with improvements in fuel efficiency, reduced driving means Americans will use about half as much gasoline and other fuels in 2040 than they use today, making the real value of gas taxes fall as much as 74 percent.

Indeed, we are already seeing the impact of that fall-off. The tightening revenue suggests, first, that we should make sure we are setting aside existing dollars to ensure the good repair of our existing system. Second, we should review projects in the pipeline that assume escalating rates of driving. Third, we should help the metropolitan regions and mid-sized cities – our economic production zones – that are trying to give their citizens more reliable and affordable options. All of this suggests that we need shift to a mix of revenue sources to build a unified transportation fund that can cover all our infrastructure needs. You’ll be seeing a lot more from us on those ideas in the weeks and months to come.

What the 2012 elections mean for the federal transportation picture

OK, now it’s official: Rep. Bill Shuster (R-PA) will replace Rep. John Mica (R-FL) as chair of the House Transportation and Infrastructure committee. That much has been resolved after a 2012 election that still leaves a number of key questions hanging in the balance.

It is too soon to say, obviously, what sort of chairman Rep. Shuster will be. His early remarks – seeking to strike a middle ground while avoiding dogmatic statements – appear to put him more in the mold of his father, Bud Shuster, who served 28 years in Congress and chaired T&I for six years in the 1990s. In remarks honoring him in 2002, former T&I Chairman Jim Oberstar praised Bill Shuster’s dad thusly: “His perseverance, patience and willingness to find common ground made him one of the greatest committee chairmen we have seen in recent years in the House.”

However, “Things are different (now),” Bill Shuster told The Hill last week. “To move legislation, I think certainly takes some of the skill set that he had. … But also, you’ve got to make sure that you’re listening to the … committee and the (GOP) conference to move these things forward. I’ve learned a lot from him, but there’s some things that happen around here today that he didn’t have to deal with.”

In other comments, Shuster has said that he does not support rolling back the federal role in transportation or giving the entire job to the states. Rather, he said he wants to find the additional revenue and financing strategies that can help make up the gap between necessary investment levels and a federal gas tax whose earning power is in decline. In a nod to reality, he also endorsed exploring the potential of transitioning to a per-mile fee, or vehicle miles traveled tax (VMT), rather than a per-gallon gas tax.

“Longer term, VMT seems to me to be the only way to stop the decline because we’re all going to be driving cars five, ten years from now that are going 40, 50 miles [per gallon] or more, or maybe not using any gas at all,” he told The Hill. Whatever the revenue source, he and his colleagues will need to move quickly: His committee needs to be ready to adopt the next transportation in just 22 months.


Rep. Bill Shuster, second from left, tours a Corps of Engineers lock facility in Chattanooga, Tennessee.

But what about raising the gas tax in the meantime?

Suddenly, almost everywhere you look in transportation land, people are talking about the possibility of a gas tax increase, and Shuster himself raised the possibility this week. Some argue that a lame duck session provides the perfect opportunity. They and others also see the potential to include a gas tax increase as part of the debt deal that is expected in the so-called “fiscal cliff” negotiations.

There is some justification for that argument. A shortfall in expected gas tax revenues already has led Congress to make increasingly large transfers from the over-burdened general fund to the highway trust fund, and was a key reason that last summer’s transportation bill lasts only two years, rather than the typical six. A gas tax increase large enough to cover all the highway and transit funding now coming from general revenues would hardly cure all the budget issues, but it certainly could help, the argument goes.

But will the Obama Administration end its opposition to talk of a gas tax increase? The President had declared it a non-starter as long as the economy is sputtering. Has the U.S. economy stabilized enough – even as fears of a Europe-led global recession lurk in the wings – to allow a gas tax increase to be put on the table?

Whither Ray LaHood?

And speaking of the Administration, if Ray LaHood has the old Clash song “Should I Stay or Should I Go?” on his iPod he’s probably listening to it a lot these days.

A year ago he announced – or rather blurted out – that he planned to step down if Obama got re-elected. The possibility has fueled much speculation as to replacements, but he has been silent since the election.  That didn’t stop The Atlantic Cities from running a recent piece on why a mayor should get the nod for the job. The article quotes yours truly praising LaHood as one of the best to hold that job, and given his support for innovations like the TIGER program, his emphasis on the safety of everyone who uses road and transit systems, his strong support for local communities trying to improve their livability … Well, we’ll stand by those remarks.

Young people leading the downward trend in driving, report finds

A fascinating new report from U.S. PIRG, “Transportation and the New Generation: Why Young People Are Driving Less and What It Means for Transportation Policy” examines a phenomenon many thought we’d never see: A drop in miles driven by those traditionally most eager to drive, young people recently eligible to drive. From the report:

From World War II until just a few years ago, the number of miles driven annually on America’s roads steadily increased. Then, at the turn of the century, something changed: Americans began driving less. By 2011, the average American was driving 6 percent fewer miles per year than in 2004.

The trend away from driving has been led by young people. From 2001 and 2009, the average annual number of vehicle-miles traveled by young people (16 to 34-year-olds) decreased from 10,300 miles to 7,900 miles per capita – a drop of 23 percent. … Young people are driving less for a host of reasons – higher gas prices, new licensing laws, improvements in technology that support alternative transportation, and changes in Generation Y’s values and preferences – all factors that are likely to have an impact for years to come.

The report closes with a discussion of some of the implications for transportation policy — and funding — if the trends toward less driving-intensive lifestyles stays with this young cohort and those that follow.

Such a shift in future transportation trends would shake the foundations of transportation policy-making. For example, to meet the demand for alternative transportation, federal, state and local governments would need to prioritize investment in public transportation, bike lanes, sidewalks and other transportation alternatives. To meet the demand for walkable neighborhoods in close proximity to transit, government officials would need to ensure that land-use and transportation policies were aligned to support the development of these communities. To compensate for the declines in gas-tax revenues, decision-makers would need to find alternative sources of funding for road and bridge maintenance or boost the gasoline tax to levels that may further discourage driving.

Driving down in 2008, congestion down much more

Interstate 24 Traffic Originally uploaded by Transportation for America

Due to the impact of high gas prices, the economic slowdown, and a growing preference for public transportation and other options for getting around, congestion was down in 2008 over 2007, marking the first two-year decrease in congestion since the Texas Transportation Institute began keeping track in 1982. Today, TTI released their bi-annual Urban Mobility Report today on the state of congestion and traffic in the U.S.

Some key findings:

Travelers spent one hour less stuck in traffic in 2007 than they did the year before and wasted one gallon less gasoline than the year before. The differences are small, but they represent a rare break in near-constant growth in traffic over 25 years.

  • The overall cost (based on wasted fuel and lost productivity) reached $87.2 billion in 2007 — more than $750 for every U.S. traveler.
  • The total amount of wasted fuel topped 2.8 billion gallons — three weeks’ worth of gas for every traveler.
  • The amount of wasted time totaled 4.2 billion hours — nearly one full work week (or vacation week) for every traveler.

One cause of the decrease in congestion is the same cause responsible for the lower numbers of highway fatalities — Americans have been driving less and less. Vehicle miles traveled (VMT) growth rates have been in decline since 2005 and in 2007, total VMT and per capita VMT actually decreased for the first time since World War II. High gas prices and the recent economic downturn have contributed to these declines, but VMT was actually in decline well before the shock of increased gas prices and the recession, and has continued to fall even as gas prices plummeted over the last year.

And while total vehicle miles traveled (VMT) went down just slightly, congestion is down much more significantly.

According to Feburary numbers from INRIX, a reputable traffic statistics service, just a 3.7% drop in vehicle miles traveled in 2008 resulted in a 30% drop in congestion in our 100 most congested metro areas. That means each commuter spent 13 less hours stuck in traffic in 2008 over the previous year. And in slight contrast to the TTI report, the report found that overall, “99 of the top 100 most populated cities in the U.S. experienced decreases in traffic congestion levels in 2008 as compared to the prior year.” Small reductions in how much we drive each year have a much larger impact on congestion.

The best way to reduce congestion and help Americans save money, time and fuel is to get smarter about managing traffic and offer increased options such as public transportation, telecommuting and incentives for carpooling, bicycling and walking. There is ample evidence that shows that reducing peak hour traffic by just a small percentage will dramatically reduce congestion and all of the costs associated with traffic.”
— James Corless, T4 America

There’s no doubt that the sagging economy had a hand in reducing how much we drive. But regardless of the current economy, most Americans seem to be looking for ways to drive less — not more. So what if we invested more in the positive ways to reduce the amount we have to drive by making other options for getting around accessible, convenient, and available to more people?

With public transportation ridership still going up — even as driving is going down — it’s clear that people who have choices for getting around use them. People are looking for other convenient ways to travel that can get them out of traffic and save them time and money.

And as the INRIX numbers show, if we can make it easier to get around and increase the options for doing so, everyone behind the wheel benefits as congestion decreases. (And despite the decrease overall, the current $87 billion in congestion costs isn’t good news, by any stretch of the imagination.)

It’s unquestionable that the recession has had an impact, giving us some momentary slack in congestion. But what will we do with the breather? When the economy begins to pick back up again and people start driving more, will we head straight back into gridlock? With driving down and public transportation up, will we make more investments in the kinds of transportation options people are clamoring for, the kinds of options that can reduce congestion and make travel more painless for everyone?

Or will congestion simply mount as the economy rebounds?

Transportation Secretary affirms smart principles for US transportation system

National Bike Summit – Day two-8 Originally uploaded by BikePortland.org
DOT Secretary Ray LaHood speaks at the National Bike Summit in Washington, DC

“Livable and Sustainable Communities.”

Those four words might not be at the top of the list of what one would expect to hear from the person in charge of how the federal government spends our tax dollars on all forms of transportation — ports, railroads, highways, interstates, sidewalks, bike lanes and more — but that’s exactly what U.S. Transportation Secretary Ray LaHood named as a primary goal for DOT while testifying before a Senate Committee yesterday (ahead of T4 America.)

In his remarks, he made it clear that DOT and the Obama administration see the deep connections between where and how we spend transportation dollars and the quality of life for everyday Americans.

One of the clear issues with our national transportation program since 1991 is that it’s been like a huge ship without a rudder — spending billions each year without any clear goals or vision for exactly what those billions should accomplish for us. Economic development? More travel options for everyone? Making transportation affordable and safe for all Americans?

After talking at length about the many challenges facing America, Secretary LaHood made it clear that DOT will be governed by some very clear principles in the future, including better quality of life as a goal for transportation spending:

With these great challenges it is essential that our transportation policies be framed so that we can meet these demands and at the same time be consistent with the major goals I have established for guiding the actions of the Department of Transportation: economic recovery; safety; and livable and sustainable communities will be the key organizing themes as we in the Department reformulate existing policies and develop new policy directions for the future.

You can download his full remarks from the committee web site here, (.pdf) but continue reading for a few select quotes: (more…)