
Pro-tip: Invest in the solution, not in the problem

comic illustration

Congress and states love to create small, discrete programs to solve big transportation problems. They don’t like to stop the types of investments that are causing the problems, even when far more money is perpetuating the issues those new programs are meant to solve. With historic amounts of infrastructure funding headed into states’ hands even as streets are growing more dangerous and we urgently need environmental solutions, it’s time to change that strategy.

comic illustration
Illustration produced for T4America by visual artist Jean Wei. IG/@weisanboo

Our transportation system has a problem. Every time Congress tries to solve a big transportation challenge, they’re only willing to invest in a small solution.

Take the new infrastructure law (the IIJA). To help fix today’s issues related to climate, safety, equity, and repair, Congress set aside small pots of cash. Then they dumped the rest of their cash into a whole lot more of the same.

Congress doesn’t seem to realize that they’re just feeding the beast, as seen in our latest illustration by visual artist Jean Wei. Flexible formula funds, their favorite one-size-fits-all solution to infrastructure woes, are making our climate, safety, equity, and repair needs worse.

An excavator digs a massive hole titled "Dangerous Roads $$$". On the other side of the hole, a man tries to fill the hole with a small pile of dirt (labeled "Safety Improvements $." The comic is labeled "U.S. Approach to Road Safety."
Illustration produced for T4America by Jean Wei

It’s true that states don’t have to use these flexible dollars this way. In fact, they can easily use these funds to address the problems that they claim are priorities. But that’s not what they’ve historically done. Instead, they’ve used formula funds to build more and more dangerous roads. And they’re willing to go to bat over their right to use these funds to make their problems worse. At a recent Senate committee hearing, Senator Capito made this cyclical argument:

This is a bipartisan bill that we passed. There is a climate title in there. There is an emphasis on funding resiliency, greenhouse gas mitigation, carbon emissions, healthy streets. This is an area that we are deeply committed to. But these are grant programs, these are not the formula dollars that go out. So I want to make the distinction and, would you agree, these are two separate programs, or pots of money so to speak? So the discussion that I’m having with you on this guide, doesn’t really apply to the climate title parts of the bill.

She’s saying that all of the new, little grant programs they created in the IIJA are designed to solve those (enormous!) problems. But the enormous piles of formula dollars are sacrosanct and they are for roads, bridges, or whatever each state decides is most important—not those other issues.

It’s clear that the small climate title alone isn’t going to be able to do the heavy lifting to reduce emissions and improve resiliency. The same is true for money set aside for safety, repair, and equity. To address these priorities, states can and should use their flexibility and dip into the historic levels of formula funds that are readily at their disposal. The longer they continue to pretend that these smaller programs are enough, all while going all-in on building more dangerous roads, the larger the beast will grow.

Share our cartoon on Facebook and Twitter!

Everyone agrees that repair is important. No one is willing to require it

comic illustration

Despite a fundamental lack of understanding by some members of Congress about the program they’re responsible for overseeing, the law sets states free to spend their federal transportation cash on eligible expenses, however they see fit. Our repair needs will never get addressed until we change this approach.

comic illustration
Illustration produced for T4America by visual artist Jean Wei. IG/@weisanboo

Please download and share our new illustration above on social media, via email, Reddit, etc. Right click to “save as” or find and share this on Twitter and Facebook with these links.

Every time that we’ve polled voters over the years, we hear that taking good care of our existing infrastructure—repair and maintenance—should be priority #1 for our transportation dollars. Ask any member of Congress and they’ll tell you it’s absolutely a top priority. 1 And every state DOT will tell you that keeping things in a state of good repair is either their top priority or second only to safety. 

Everyone seems to agree about the importance of repair, yet everyone in charge seems to recoil when anyone suggests creating hard and fast requirements that states prioritize their repair needs before building new infrastructure they will also have to maintain for decades to come.

After seeing Virginia leaders touting the infrastructure law’s $530+ million to address Virginia’s deficient bridges, Wyatt Gordon in the Virginia Mercury recently asked the obvious question: “Why did more than one in 25 bridges deteriorate into a ‘poor or worse condition’ in a state with a nearly $7 billion annual budget for its Department of Transportation?” T4America director Beth Osborne weighed in:

The more you fail in transportation—the more people die, the more expenses increase, the more bridges collapse, the louder the calls to put more money into the programs that produced that failure in the first place. There is no accountability. These senators who voted for [the IIJA] promise us results every time, but I just heard a bridge fell down in Pittsburgh. How many times do they promise the same results without changing the program that is producing these same failures?

Look, it’s worth noting that not every state performs equally when it comes to prioritizing repair with their flexibility, and some states have made sizable shifts from expansion to repair in the last few years. As the above piece notes, states like Pennsylvania and Massachusetts are already devoting the lion’s share of their budgets toward repair. They’re doing their best to ignore that second voice in the background of the comic pushing the sexy new expansion project.

But most states are not choosing to do this.

This reminds me of what Mississippi DOT commissioner Dick Hall said during a repair-focused event we held in DC in 2019, where he made a plea for Congress to step in and require repair first. “If you want us to prioritize maintenance, then you’re going to have to tell us ‘you gotta do it,” he said. Until Congress does, some states will do well and other states will just punt questions about paying for all the things they’ve built off to their grandkids to figure out.

How bad is this addiction? 

Consider the new $43 billion bridge repair formula program that Congress created in the infrastructure law. Even though this money is doled out proportionately to the states with the greatest bridge repair needs and Congress just supercharged the funding to the massive flexible programs that all states can use to build new highways, Congress still decided to allow states to use this dedicated “repair” money to build brand new bridges. USDOT’s guidance on the legislative language made it clear that the law allows “the construction of a new highway bridge on a new alignment” as an eligible project, though USDOT gently encouraged states to focus on bridges in poor or fair condition.

We’ll once again just have to hope that all states can deliver on all the repair promises. And in five years, after the IIJA’s $643 billion has been exhausted, we’ll be right back here lamenting the state of our infrastructure and wondering where all the money went, even as we renew the pleas for more funds to “repair our crumbling infrastructure.”

Show me the money: Financial breakdown of the infrastructure law

graphic showing comparison data between fast act and infrastrucure bill

A month has passed since the $1.2 trillion infrastructure deal was signed into law and set the direction for the federal transportation program for the next five years. With this mammoth infusion of unexpected cash (which is already flowing out the door), there is much to unpack as to exactly how much money there is for the surface transportation program and how it can be used.

To big fanfare, the Infrastructure Investment and Jobs Act was signed into law on November 15, 2021 by President Biden. The President and the press have touted how this law will invest $550 billions in supplemental appropriations  into transportation and other infrastructure needs of the United States.  But rather than just how much more the pie was supersized, most states, regions, and local governments want to know more details about the size of all the bill’s various pie pieces. T4America has you covered, dissecting the infrastructure law and following the money for the surface transportation program. 

FHWA also released their full apportionment tables on Dec. 15, which show the full official breakdown of where the money is going and what sources it’s coming from. Find those tables here.

promo graphic for a guide to the IIJA

This post is part of T4America’s suite of materials explaining the 2021 $1.2 trillion Infrastructure Investment and Jobs Act (IIJA), which governs all federal transportation policy and funding through 2026. What do you need to know about the new infrastructure law? We know that federal transportation policy can be intimidating and confusing. Our hub for the new law will walk you through it, from the basics all the way to more complex details.

1) Where this money is going—the big picture

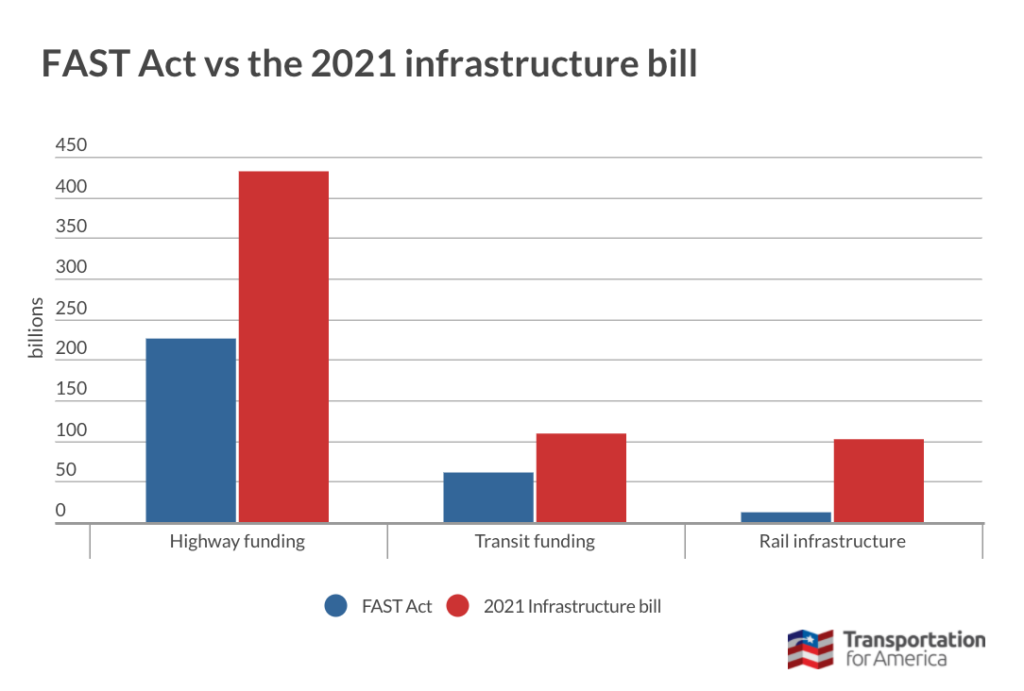
As the following chart shows, 54 percent ($643 billion) of the infrastructure law’s funding goes toward reauthorizing the surface transportation program through 2026. The rest of the bill’s $1.2 trillion price tag goes toward other various non surface-transportation infrastructure. This $643 billion part of the deal has been reported as reauthorization plus additional above-and-beyond funds for various programs (even by us!), but the easiest way to understand this is that this is a massive five-year authorization that’s nearly twice the size of the FAST Act that it replaces. (The next biggest question is how much of the $643 billion comes from the gas-tax-funded trust fund, and how much comes from general tax dollars, which we get into in #2 below.)

Of this $643 billion, two-thirds of the money ($432 billion) is flowing to conventional highway programs.

Just to put this scale of spending in perspective, if the FAST Act (the just-ended five-year transportation law) had just been extended instead, that would have only been about $299 billion for these three basic areas of funding over five years. So compared to the previous five-year law, the new infrastructure bill brings a:

  • 90 percent increase in highway program funding (from $226 up to $432 billion);
  • 79 percent increase in public transportation funding (from $61 billion up to $109 billion); and
  • 750 percent increase in railroad infrastructure funding (from $12 billion up to $102 billion)

While the bill has added some new programs (some of which we cover here), the primary way to understand the amount of money is that it will go down as roughly double what we spent over the previous five years.

2) Where is this money coming from? 

Taking a closer look at that nearly $432 billion for highways, $110+ billion in supplemental funding (for predominantly highway competitive grant programs) is sourced from general funds from the US Treasury, i.e, paid for with tax dollars from every American and not just gas taxes In a notable change from historic practice, these supplemental funds will be appropriated in advance of other priorities in the annual budget process. (Typically,  funding for programs that are not funded with gas tax dollars are fought over year after year in appropriations, though the starting point may be the “authorized” amount in the current five-year authorization.)  This is different from a couple of discretionary programs, such as the Healthy Streets program, which authorizes expenditures, but did not identify funding for the program. These types of programs will face potential cuts before competitive highway programs ever do, for example.

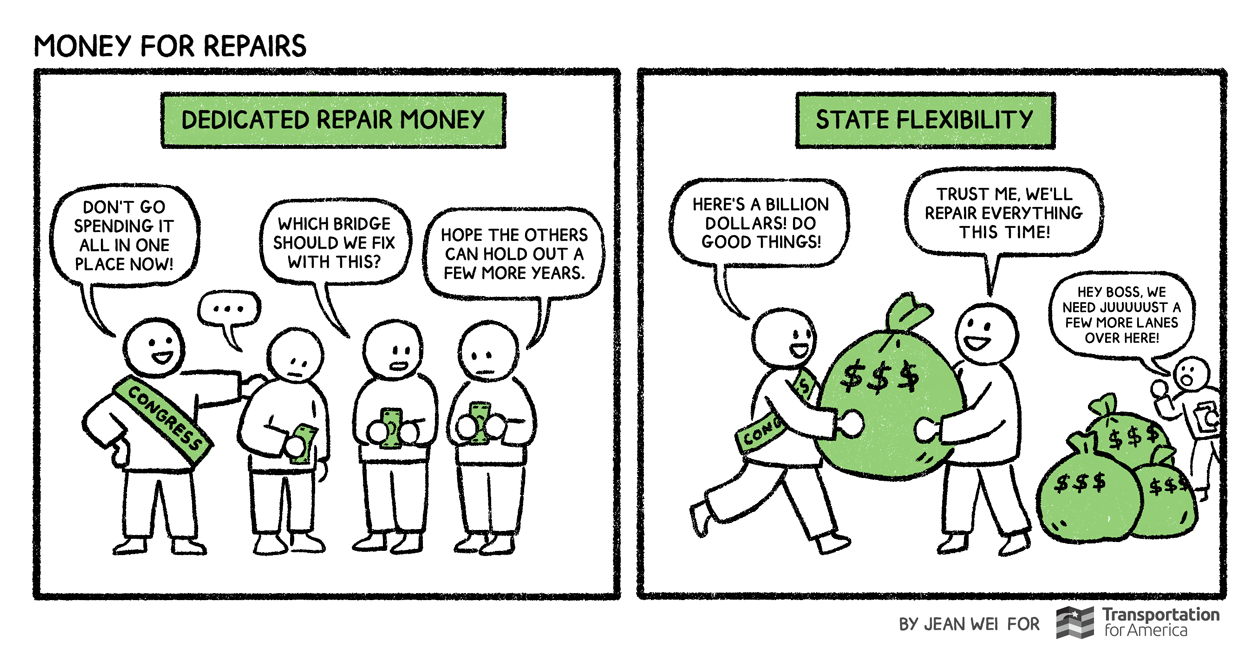
This supplemental funding from all taxpayers is layered on about $312 billion sourced from the gas-tax-funded Highway Trust Fund (HTF). 87 percent (about $271 billion) of those trust fund dollars is directed to formula programs and will be spent at the discretion of states and metro areas (within the contours of the policy Congress wrote.) The administration has almost no ability to shape how those dollars get spent with future administrative actions or rulemakings. In fact, this money is already flowing directly into the coffers of state departments of transportation. The rest of the $312B in trust fund dollars (~$39B) are being directed to discretionary programs, such as competitive grants and research administered by USDOT.

When it comes to the federal transit program, the infrastructure law sets aside $109 billion, of which nearly $70 billion is from the also gas-tax-funded Mass Transit Account within the HTF, and an additional $39 billion in general tax funds over the next five years (which will also be appropriated each year in advance of other budget needs.)

Lastly, the federal rail program sets aside $102 billion over five years to be annually appropriated in advance of other budget needs, from the general fund from the US Treasury. None of the rail funding comes from the Highway Trust Fund.

As far as how these “advance” appropriations are going to work out in practice, no one is really sure what to expect in reality over the next five years as Congress could change several times over during the 2021 infrastructure law’s lifespan. In theory, these programs provided with appropriations in advance (like transit and passenger rail) should be safer than other programs that are wholly discretionary and left up to future appropriators to decide funding each year, but it’s a real possibility that a new Congress could certainly find a way to undo some of the advance funding for programs that they deem unworthy. This will be an issue that we will be keeping a close eye on in the years ahead.

3) What makes the infrastructure law’s funding historic?

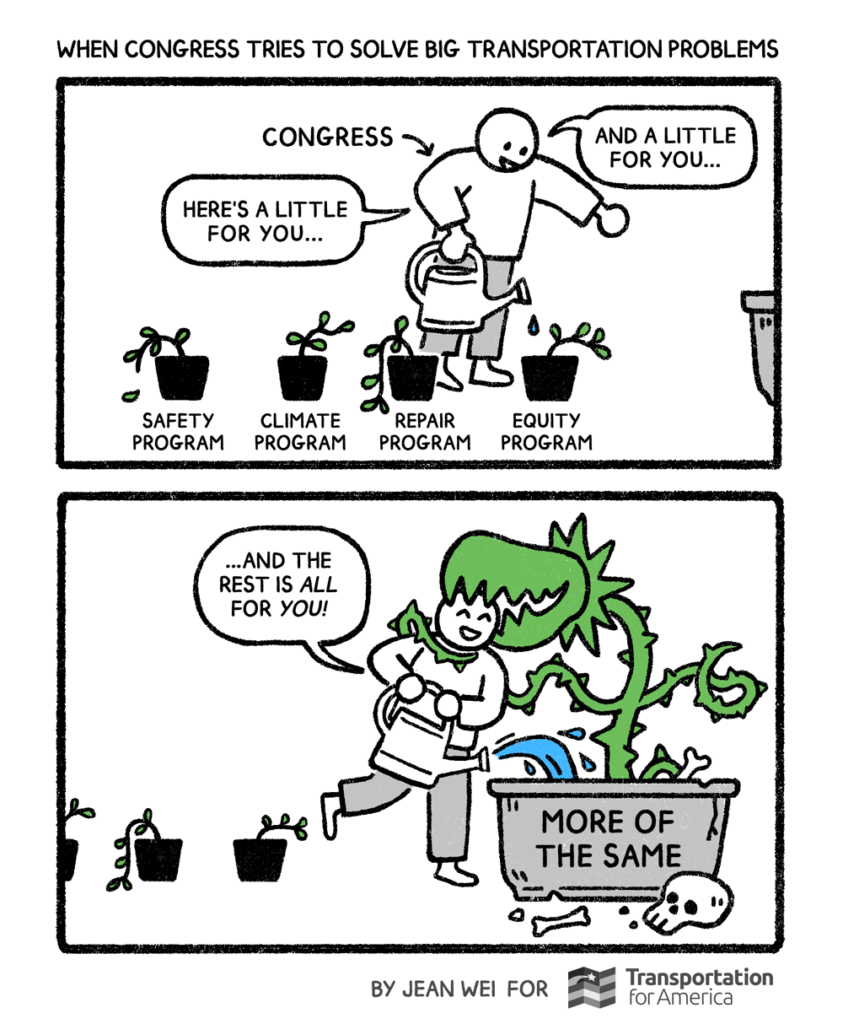
The infrastructure law comes with its flaws in policy, but there are still opportunities to maximize the potential of this unprecedented influx of transportation investment. As noted in the first graphic above, these are huge increases in funding over what states and metro areas and transit agencies would have expected to see in just another year of the FAST Act. 

 The vast majority of that highway money will be allocated to the states using complex formulas that ensure an equitable distribution of funding tied to average gas tax receipts and previous state allocations. Based on what T4America knows on the apportionment formula, the following chart highlights how the total highway funding for formula programs can be sliced and diced to the states. Of all the states, Texas, California, and Florida account for a quarter of the apportionment of the federal highway program. It will be incumbent on USDOT and advocates to hold all of the states accountable for how their federal dollars are used.

‘Speak up for transportation’: Analyses show the devastating impact of federal cuts

Congress has seen various proposals floated to scale back federal investment in transportation, from cutting out transit funding to ending the federal gasoline tax and shifting full responsibility to the states. We decided to take a look at what that latter move would mean for taxpayers, who would have to make up the difference in each state or accept multi-million dollar decreases in funding and deteriorating conditions on an annual basis.

Tease-State Gax Tax Increases Required Tease-State Gax Tax Revenue losses per capita

The bottom line: All states would have to raise their per-gallon gas taxes more than the federal rate of 18.4 cents to replace the lost revenue — and many states would have to raise theirs by much more. Click through to see the full analysis with graphics and data for all 50 states

There’s a reason you don’t hear state politicians calling for the end of the federal transportation program and the gas tax. That’s because every single state receives more in federal transportation funds than they pay into the federal system — in part because Congress has been transferring billions from the general fund to make up for slackening gas tax receipts and the fact that the gas tax hasn’t been raised in more than two decades.

At least 16 states have moved to raise their own transportation revenues since 2012, leading some in Congress to claim that those moves show states would be fine with accepting the full burden.

But ending federal support would be a nightmare for governors and legislators, who would have to choose between slashing repair and investment or trying to push through massive tax increases to replace federal revenues.

(The Transportation Construction Coalition released a similar analysis a few weeks ago, but, unlike the analysis here, it did not include the 20 percent of the transportation program that supports public transportation. -Ed.)

According to our full analysis: (See columns 2-3 in the table)

  • 19 states would have to raise their gas taxes by at least 25¢ per gallon, over 36 percent more than the current 18.4¢ federal rate.
  • Vermont would have to raise the state gas tax by 50¢ per gallon to break even – and that’s on top of a recent increase lawmakers passed to add the equivalent of 6.5¢ to each gallon of gas.
  • New York, which receives the highest amount of transit funding in the country, would have to raise the state gas tax by 40¢ to keep the same amount of transit money flowing into their highly-used systems.

Even if states only raised their gas taxes the equivalent of the 18.4¢ federal tax, our calculations also show that: (See column 4-5 in the table.)

  • States collectively would lose out on $8.47 billion (according to data from fiscal 2014);
  • Missouri, currently attempting to raise additional state funding to address an already large budget hole, would need to raise $144 million each year on top of their current needs;
  • New Jersey, facing the imminent bankruptcy of its state transportation trust fund, would also have to find an additional $373.6 million;
  • California would lose nearly $1 billion ($970.5 million, to be exact).
  • In Wyoming, where lawmakers just passed a 10-cent gas tax increase expected to generate $72 million per year, they’d be almost back to square one, losing $57 million.

States also would fare poorly under proposals to eliminate federal contributions for public transportation, as two proposals in Congress would do, according to an analysis out today from the American Public Transportation Association. From their release:

The analysis shows that proposals to cut federal funding for public transit would result in an average 43 percent reduction in a community’s capital improvement funding. Overall, the loss of federal capital and operating funding would put at risk more than $227 billion in economic activity over six years. … Small and rural communities would be aversely affected because a greater percentage of their total funding is from the federal government.

No matter how you slice it, dramatically reducing federal dollars, whether for roads or transit, would have devastating impacts on state’s population centers – the places where commerce happens and revenues are generated. Going in the other direction however, by increasing investment available to states and local communities, would help keep roads and transit in good repair while we build for the future economy.

Read our full analysis, including graphics and sortable data for all 50 states.

Share this


This post and analysis is part of “Stand Up for Transportation” day today. Find out more and get involved here: http://standup4transportation.org/

Voters overwhelmingly re-elect candidates who raise transportation revenue, analysis of general election results shows

Continuing a trend observed in the primaries, an updated T4America analysis of November’s election data shows that 90 percent of legislators supporting revenue increases in ten states won their re-election bids. Perhaps that knowledge will help legislators in 17 states (and counting) considering similar plans take similar action this year.

Share this graphic with others:

View our full page tracking and summarizing the data on these votes.

The conventional wisdom has been that supporting any sort of tax increase is a political death sentence, but recent data perhaps suggests the opposite conclusion — at least with regard to tax increases intended to invest in transportation.

Since 2012 at least ten states have done the “unthinkable” and either increased gas taxes or otherwise raised significant transportation funding through legislative action: Arkansas, Florida, Maryland, Massachusetts, New Hampshire, Pennsylvania, Rhode Island, Vermont, Virginia and Wyoming.

Transportation for America has kept a close eye on those votes at the state level to raise revenue and the subsequent response from voters in the elections that followed. We first examined this data after the primary elections in 2014, when supportive state legislators won their primaries at an amazing 98 percent clip. With a full election cycle behind us, how did supportive state legislators fare?

  • A total of 961 legislators in these ten states ran for re-election after voting yes on a measure to raise transportation revenues by some mechanism.
  • 23 candidates lost their primary election, resulting in a 98 percent success rate in the primaries for those that voted yes and ran for re-election.
  • 939 supportive legislators reached the general election*.
  • 71 supportive candidates lost in the general election for a total of 868 supportive legislators retaining their seats.
  • The total re-election rate for supportive legislators who ran is 868/961, or 90 percent.

*1 Independent candidate (Adam Greshin in Vermont) did not run in a primary due to lack of party registration.

View our full page tracking and summarizing the data on these votes.

This encouraging trend could serve as a powerful object lesson for the legislators in the 17 states and counting currently considering legislative plans to raise the gas tax or other tax/fee increases for additional transportation revenue.

Graphic: Comparing the 2014 bipartisan budget to 2013

Just months after budget sequestration and a government shutdown put transportation funding at risk, Congress passed the first full budget in three years last night after the Senate vote that will provide stable or increased funding for key programs we’ve been fighting for over the last few years. The $1.1 trillion budget is with the President for his signature. Take a look at this graphic which shows the good news for transportation in this 2014 budget compared to FY2013 figures post-sequestration.

For this graphic and more, don’t miss our regular featured graphics on our Maps and Tools page.

2014 Budget Deal


(Note the comment on the graphic about Amtrak and Amtrak operations — those cuts are a bit deceiving. Also, Amtrak received a total of $1.39 billion in capital and operations for 2014 — as much as they’ve received in almost any recent budget.)

Graphic: A closer look at the Senate MAP-21 vote by state

As this map and graphic below amply demonstrates, the Senate’s transportation bill not only was developed with bipartisan input and adopted with votes from both parties, but it garnered support from every region of the country and from the reddest of “red” states — Georgia, Alabama, Texas, Oklahoma — and the bluest of blue — California, New York — as well many others that trend purple. Click to enlarge.

This is a noteworthy accomplishment in this Congress, and one that House leaders should take note of before dismissing HR 14 out of hand. (HR 14 is identical to the Senate’s MAP-21, and is before the House right now.)

No one is saying the House shouldn’t debate its own amendments to the Senate bill. Indeed, there are several areas we would like to see strengthened. But with the clock ticking, construction machines idling and Americans looking to get to work, the Senate bill’s bipartisan provisions form a strong base for a House debate.

That was exactly the message contained in this bipartisan letter (pdf) sent to House leadership just this week by Rep. Dold (R-IL) and Rep. Blumenauer (D-OR) and signed by Reps. Biggert (R-IL), Quigley (D-IL), Charles Bass (R-NH) and Larsen (D-WA).

“With funding for transportation and infrastructure projects expiring at the end of the week, it is critical that we act as soon as possible to provide certainty in the transportation and infrastructure sector that employs so many Americans,” said Rep. Robert Dold (R-IL-10). “I firmly believe transportation is a bipartisan priority that extends beyond partisan politics- that is why I am urging the House to consider the bipartisan Senate bill if it cannot bring a viable longer-term bill to the House floor by the March 31 expiration.  We must reach a bipartisan consensus now to ensure that local transportation agencies can better plan for the future, and so that these important projects and jobs can continue.”

Would we, like the House members who signed this letter, prefer a longer bill, in an ideal world? Yes, if it had the right policies and an appropriate source of revenue.

However, with the time available, and in an election year where every vote is a litmus test, an attack ad waiting to happen or a political message of some kind, the Senate is offering a sound path forward that everyone should be able to live with now, and build from in the future.

Relatedly, we have completed a long and detailed summary of everything we know about the Senate’s MAP-21 bill, which you can download in its entirety here. (pdf)

Summary of the Senate MAP-21 transportation bill proposal

The Senate Environment and Public Works Committee released a draft of the transportation bill late last Friday. The EPW committee’s portion of the bill covers what’s known as the “highway” title. (The Banking Committee is responsible for writing the “transit” title and the Commerce Committee covers rail and safety. Those sections of the bill have not been released yet.)

We’ve prepared a short few pages on what MAP-21 means for the federal transportation program. This top-line analysis is a bit on the wonky side, but hopefully it’ll be helpful if you’ve been trying to summarize the 600 pages of bill text.

One of the most visible changes MAP-21 makes is to restructure seven core highway programs and 13+ formula programs into just five core highway programs. This graphic below illustrates those changes. Read on for the full summary, which you can also download here. (pdf)


Click to enlarge the graphic.

MAP-21 consolidates numerous FHWA programs into five core programs. The new program structure is as follows.

National Highway Performance Program (NHPP): ~$20.6 billion

This new program focuses on repairing and improving an expanded National Highway System (NHS). The NHS is expanded from ~160,000 miles to ~220,000 miles. States are required to develop asset management plans and as a part of these plans establish performance targets for the condition of roads and bridges and the performance of the system. In addition, the program includes provisions to hold states accountable for the repair of Interstate pavement and NHS bridges by requiring that they spend a certain amount of funding on the repair of those facilities if they fall below minimum standards established by USDOT.

Transportation Mobility Program (TMP): ~$10.4 billion

TMP replaces the existing Surface Transportation Program (STP) and allows states and regions to invest flexible dollars in a broad set of highways, transit projects, freight rail projects, and bicycle and pedestrian projects, as well as other activities like travel demand management. Fifty percent of these funds are suballocated to areas in the state based on their population. While this percentage is lower than the current 62.5 percent, the absolute amount of funding to be suballocated will remain the same due to an increase in program size.

Highway Safety Improvement Program (HSIP): – $2.5 billion

Funding is provided to states to improve safety for all road users on all public roads. A road user is defined as both motorists and non-motorized users. States are required to collect extensive data on crashes and create a database containing information on safety issues for all public roads including identification of hazard locations. (8% of all funds in this program are set-aside for data collection.) States must also develop a strategic highway safety plan using the data collected. If states do not develop a strategic highway safety plan within a year using a process approved by USDOT, they are required to spend additional funding on safety projects. States are also required to develop performance targets on fatalities and serious injuries.

Congestion Mitigation Air Quality Program (CMAQ): ~$3.3 billion

In the CMAQ program there are two pots of funding – one that funds typical CMAQ projects and another “reserved” fund.

CMAQ pot. Funds are provided to states and tier I Metropolitan Planning Organizations (MPOs) to address the impacts of the transportation system on national ambient air quality standards. In states with non-attainment or maintenance areas, 50 percent of the funds are suballocated to tier I MPOs based on the area’s status with national ambient air quality standards. Funds cannot be used to construct new travel lanes except for HOV or HOT lanes. USDOT is required to develop performance measures for air quality and congestion reduction. Tier I MPOs that receive funds under this program are required to develop a performance plan that outlines baseline conditions, targets for each of the performance measures developed by USDOT, and a description of projects to be funded, including how those projects will help meet the targets.

“Reserved” pot. This pot of funding is equal to the amount of funds provided for the Transportation Enhancements set-aside in FY09. Eligible activities under this pot include the following: transportation enhancements, safe routes to school, recreational trails, environmental mitigation, and certain types of road projects (including street redesigns and HOV lanes). States are allowed to use these funds for CMAQ projects (the first pot) if they build up an unspent balance of year and a half worth of funds.

National Freight Program: ~$2 billion

USDOT is directed to establish a primary freight network consisting of 27,000 miles of key freight corridors. States can use funds for highway projects that improve freight movement with a focus on the primary freight network and key rural freight corridors. A state may use up to 5 percent of funds for rail or maritime projects subject to certain conditions. USDOT must also develop a National Freight Strategic Plan, which will analyze performance and conditions on the primary freight network, identify bottlenecks, estimate future freight volumes and identify best practices for mitigating impacts of freight movement on communities. USDOT shall publish a Freight Condition and Performance Report on a biennial basis. States must establish performance targets and report on progress every two years.

Other key components

TIFIA program – $1 billion. MAP-21 expands the TIFIA program from $122 million to $1 billion and modifies the program from a competitive application process to a rolling application process. Provisions have been added that allow for applicants to enter into master credit agreements to provide funding for a suite of projects at once. In addition, there are modifications that make it easier for public transportation agencies with dedicated revenue sources to apply for TIFIA loans.

Planning and Performance. MAP-21 creates performance measures for conditions on the National Highway System (NHS), NHS performance, safety, freight, congestion mitigation and air quality. As part of the development of the plan, states and large MPOs shall analyze the baseline conditions for the performance measures and establish performance targets for each performance measure. The plan must include the future performance of their transportation system with regards to these performance measures including whether or not they will achieve their performance targets. Large MPOs may undertake scenario planning as a part of the development of their long-range plans. Smaller MPOs are required to develop long-range plans and USDOT will establish rules that provide for the standards they must meet regarding the performance measures required for the larger MPOs.

Statewide transportation improvement programs (STIPs) and metropolitan transportation improvement programs (TIPs) must include performance measures and targets used in assessing the existing and future performance of the transportation system. A system performance report must include progress toward achieving state performance targets.

Project Delivery. MAP-21 includes numerous provisions intended to accelerate project delivery. Most of these provisions relate to administrative actions to be taken by USDOT. There are also provisions that relate to expanding the types of projects that can be undertaken through a categorical exclusion (a more limited environmental review). In addition, it allows for the earlier acquisition of right-of-way.

Correcting some misinformation on bicycle and pedestrian spending

Bike and pedestrian projects get less than 1.5 percent of federal transportation funding — despite recent misinformation to the contrary.

There’s some misinformation percolating about the size of the transportation enhancements program — the small dedicated program that has funded projects to make biking and walking safer and more convenient for 20 years. Some misleading data has been shared and then propagated in news stories, so we wanted to put up this very simple explainer to help set the record straight — and equip you to help us set the record straight.

There have been news stories and press releases saying that states are required to set aside 10 percent of their transportation funds for things like “like transportation museums, educational programs for pedestrians and the operation of historic transportation facilities.” Two things are incorrect and misleading here.

  1. The purpose of the program:  Though there are 12 eligible uses in the transportation enhancements program — including the others mentioned above — more than half of TE funds are spent to make people on foot or bike safer. People who oppose this program like to cite some of the other eligible uses like highway beautification and transportation museums while neglecting to mention that the majority of the funding is used for just one purpose: making walking and biking safer.
  2. The size of the program:  Most deceptively, this program does NOT make up 10 percent of a state’s transportation dollars that they get from the federal government. Not even close. Each state gets their transportation money from several pots, and one of them — about a quarter of the total — is called the “surface transportation program” (STP). Ten percent of that pot is set aside for enhancements, and about half of that total is spent on biking and walking. Local governments apply for this money, and there are far more applications than there are funds. While TE only accounts for 1.5 percent of transportation funding, it is the largest source of funding for biking and walking facilities– which carry 12 percent of all trips in the United States.

This chart below from our Transportation 101 document should help.

The bars below show the core federal program funding levels for 2009. The bar in red is the surface transportation program. 10 percent of that single bar is where enhancements come from, or about 1.5 percent of all transportation spending. About half of that TE program is spent on biking and walking, and a small bit of funding from a few other programs (Recreational Trails and Safe Routes to School) adds up to the total of a little more than one percent of all transportation dollars spent to make walking and biking safer — though pedestrians make up about 14 percent of all traffic fatalities.

USA Today on infrastructure spending: what do Americans want?

USA Today had a timely graphic up yesterday, considering the continuing media coverage around President Obama’s recent proposal for infrastructure spending and a reformed long-term transportation bill.

First, the graphic:

Though we can’t see the rest of the questions or the context, it affirms a few things we already know about Americans’ attitudes about transportation — as evidenced in our own 2010 national poll — and how to fund what we need.

While Americans are actually voting in favor of taxing themselves to improve transportation in state and local ballot measures at a rate of about 70 percent, they often know exactly what they’re going to get in those cases: a new bridge, an expanded transit system, a system of repaired roads, or the like. But the federal program is much fuzzier in most people’s minds. The current system is broken and unaccountable, and putting more money into a broken system is like trying to bring more water up from a well using a bucket with a hole in it.

As James Corless wrote in an Infrastructurist guest post yesterday, “Some of the old guard transportation insiders in D.C. would be thrilled with doubling the overall size of our transportation program and pouring more money into the same broken system, but Americans know better. They want more accountability, safer streets, and more transportation options so seniors can maintain their independence and low wage workers can get to jobs.”

It’s also interesting that the sentence to the left of the poll summarizes it as “Americans would rather use tolls than taxes to build more roads,” when it could have just as easily been “Americans are OK with building no new roads if it means raising the gas tax or instituting tolls to pay for them.”

Maybe the poll asks the wrong question?

We’re not in favor of a moratorium on any new roads whatsoever, but this survey clearly reinforces the fact that Americans in urban and rural areas have moved beyond the idea that the solution to every transportation problem can and should be a new road.

We cooperated on a poll in 2009 with the National Association of Realtors, showing that Americans don’t think expanding roads and highways are the best use of scarce transportation dollars:

“As the federal government makes its plans for transportation funding in 2009, which ONE of the following should be the top priority?”

Maintaining and repairing roads, highways, freeways and bridges Expanding and improving bus, rail, and other public transportation Expanding and improving roads, highways, freeways and bridges Not sure
50% 31% 16% 3%

And as our 2010 poll showed, more than four-in-five voters (82 percent) say that “the United States would benefit from an expanded and improved transportation system, such as rail and buses” and a solid majority (56 percent) “strongly agree” with that statement. Fully 79 percent of rural voters agree as well, despite much lower use of public transportation compared to Americans in urban areas.

If you saw this graphic and your curiosity was piqued, perhaps it’s worth going back and poking through our national poll for a fuller picture.