Speeding up, cleaning up freight movement in the U.S.
 |
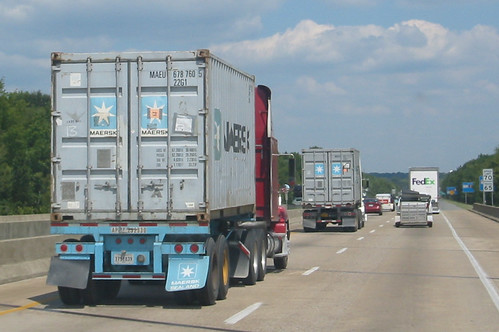
| Container trucks on an American highway Originally uploaded by futureatlas.com |
Since Chairman Oberstar introduced the Surface Transportation Authorization Act (STAA) last summer, we’ve increasingly heard that addressing freight congestion is going to be a major component of any national transportation policy.
Projections of the increase in freight movement in the next few years are huge — total freight movements are projected to increase by 92% in the next 30 years, according to a comprehensive congressional study. Congestion on the railroad network is also forecast to spread — by 2035, thirty percent of the rail network, or 16,000 miles, will experience unstable flows and service break-down conditions.[i] Considering the strong efficiency advantage of freight rail, that’s very bad news.
We face a choice in how the nation will step up to meet the coming demand for moving goods — and how clean those solutions will be. The upcoming reauthorization of the federal transportation bill is a great opportunity to help achieve a smarter, greener freight system. The innovative freight projects highlighted in this week’s “Good Haul” report by the Environmental Defense Fund demonstrates the practical solutions that are economically smart, protect us from harmful air pollution, and provide jobs for American workers. We have a golden opportunity to focus investments on projects that use the existing freight system more efficiently and grow the economy, while improving air quality and meeting big-picture national goals.
We need to recognize the connections between goods movement systems and public health and fast track the innovative solutions that tie transportation investments that improve efficiency with those that also improve air quality. The Good Haul report demonstrates that there have been innovative projects to address both these concerns and that some regions around the country are leading the way — but none of the practices in the case studies reflect current accepted standards or federal policy.
It’s time for the nation as a whole to refocus on options to invest in clean green freight.
Here’s a glance at a few of the 28 case studies highlighted in the report:
- In Chicago, the CREATE program aims to reduce congestion and improve air quality by streamlining four major rail lines. Chicago handles 30% of rail freight revenue and expects to see an 89% increase in rail traffic over the next 30 years. The program will result in $1.12 billion in health care savings from improved air quality and will generate economic activity valued at more than $525 million. The program expects to create 2,700 annual jobs.
- In Southern California, the Ports of Los Angeles and Long Beach launched the Clean Air Action Plan in 2006, which cleans up all areas of port activity: ships, trucks, cargo handling equipment, locomotives — even tug boats. The plan has already taken 2,000 dirty diesel trucks off the road and has created more than 3,000 jobs at the Port of LA, alone.
- In Seattle, BNSF Railway installed four electric wide-span, rail-mounted gantry cranes at the Seattle International Gateway (SIG) intermodal facility. The cranes’ wide footprints allow them to span three tracks, stack containers and load and unload both trucks and railcars. The cranes produce zero onsite emissions and have increased throughput by 30% at the facility.
- In the East, the Port of Virginia’s Green Goat hybrid yard switcher, a rail locomotive that moves short distances within a rail yard, provides fuel savings between 40-60% and is predicted to reduce nitrogen oxide and particulate matter emissions between 80-90% annually.
- Along the Gulf, SeaBridge freight, a coastal shipping service between Port Manatee, Florida and Brownsville, Texas avoids an average of 1,386 miles of congested highways. Compared to trucking, one SeaBridge barge has the capacity to remove 400,000 truck highway miles on a single one-way voyage.
[i] Association of American Railroads, National Rail Infrastructure Capacity and Investment Study prepared by Cambridge Systematics, Inc. (Washington, DC: September 2007), figure 4.4, page 4-10.


