
Transit fiscal cliff or transit fiscal doom?

When ridership plummeted at the onset of the Covid-19 pandemic, transit agencies across the country experienced substantial operating budget deficits. The federal government responded by rolling out multiple relief packages to help agencies make it through the worst of the pandemic. Now, in early 2023, funds are running out. We surveyed transit agencies nationwide to see where they stand as federal support dwindles.

Baltimore Charm City Circulator. Photo via Flickr/Elvert Barnes Photography

What is the transit fiscal cliff?

According to the American Public Transportation Association, in the five years leading up to the pandemic, ridership was slowly declining across a range of transit agencies. Even with relatively stable ridership, transit agencies were already struggling to make ends meet. 

When the Covid-19 pandemic caused national lockdowns, ridership plummeted, causing revenues from fare collection to drop to almost zero. Without fare revenues, transit agencies no longer had the funding to cover their operating costs. And the federal government stepped in, rolling out three separate emergency relief packages, and incorporating increased support for transit agencies in the Infrastructure Investment and Jobs Act (IIJA). (Learn more about what the IIJA could accomplish for transit here.)

However, this funding alone was not enough. Ridership still hasn’t returned to pre-pandemic levels, and workforce shortages have only applied additional stress. Some local and state leaders also misinterpreted the new influx of federal cash as an opportunity to cut back on their own spending on transit, further delaying the recovery.

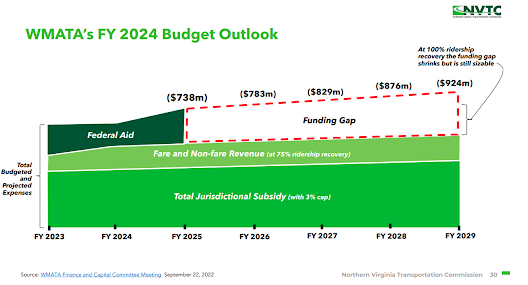
These combined stressors have created the transit fiscal cliff: the operating budget deficit expected at transit agencies across the country once their federal relief runs out. And for many transit agencies, the cliff is coming very soon—in some cases, as early as next year.

Above is a depiction of the Washington Metropolitan Area Transit Authority (WMATA) operating budget outlook for Fiscal Year 2024. The area outlined in the red dashed line represents the budget deficit. This graph is just one example of the drop-off, or fiscal cliff, many transit agencies expect to experience when federal funds run out.

How bad is it?

The National Campaign for Transit Justice (NCTJ) and T4America conducted a sample survey to paint a picture of the fiscal health of transit agencies around the United States as they approach the two-year anniversary of the last emergency relief package. In an effort to hear from a representative sample, we contacted about 40 transit agencies across the country, operationally diverse in size,  around the country. 

Out of the agencies we contacted, we received 27 responses. Here’s what we found:

1. Urban ridership recovery lags behind rural ridership.

We started our analysis by separating agencies into groups based on geographic area. 5 survey participants serve rural populations, 19 participants serve urban populations, and 4 participants serve both rural and urban populations. 

While there is a broad range, the majority of urban transit agencies report recovery levels lower than 75 percent of pre-pandemic levels. Rural agencies  reported a range of ridership recovery as low as 60 percent and as high as 90 percent. Meanwhile, jurisdictions that serve both rural and urban populations hovered near the top, reporting ridership around 80 percent of pre-pandemic levels. 

Increased workplace choice might explain the slow ridership recovery in urban areas. Workers who have greater workplace choice could have the option to work remotely and no longer rely on public transit to commute. We also found that urban riders are experiencing less reliable service due to workforce shortages. Service reliability is imperative to workers dependent on public transportation, and a lack of reliability could push riders to other travel options.

2. Most agencies are experiencing workforce shortages.

Since the onset of the Covid-19 pandemic, workforce shortages have been a major issue across sectors, including public transportation. We knew that the agencies participating in our study might be experiencing shortages, but we were unprepared for the prevalence of workforce issues.

Of our 27 participants, 24 continue to experience workforce shortages, starting when the pandemic began. Some agencies are short over 800 operators and maintenance workers who are vital for the day-to-day operation of transit agencies. As a result of the limited personnel, some agencies have had no choice but to cut service. 

To address these shortages, agencies are working to incentivize workers to join their team. See this blog post for more information on their efforts.

3. Two-thirds of transit agencies predict budget deficits by 2025.

We separated participants into three groups based on their timelines for expected operating budgets. An overwhelming majority of transit agencies expect budget deficits with start dates rapidly approaching. Transit agencies began running out of funds as early as Fiscal Year 2022, and only 5 of our 27 participants didn’t project an operating budget deficit.

10 out of 27 projected deficits starting in Fiscal Year 2024, and an additional 10 projected deficits starting in Fiscal Year 2025. Only 3 transit agencies projected operating budget deficits starting in the Fiscal Year 2026 or later and expected funds to last long term without intervention.

4. Transit agencies are implementing unique tactics to address budget shortfalls.

Participants varied in how they plan to address their deficits. Seven participants plan to increase fare prices, five plan to cut services, three are discussing ballot measures to increase funding, and the remaining are looking at solutions unique to their situations. One agency is looking to change service hours to reflect new traffic patterns. Another is looking to create a coalition of local businesses and institutions to philanthropically support the transit system, which would help replace missing fares.

It’s clear that transit agencies know the fiscal cliff is coming, and they’re not turning a blind eye. To continue delivering the service communities need, these agencies are offering creative solutions, showing a steadfast commitment to the operation of public transportation.

Help transit succeed

The Stronger Communities Through Better Transit Act (H.R. 3744), sponsored by Congressman Hank Johnson of Georgia, would allocate $20 billion annually to transit agencies’ operating budgets for four years, starting in FY23. The additional federal funding would empower agencies to make significant improvements to transit service. This could mean providing additional service or developing services for underserved communities. You can show your support for this legislation by calling your congressional representatives.

In addition to calling for federal funding, you can contact your state legislators and tell them to support similar legislation at the state level. In some states, that may mean advocating for constitutional and statutory changes that would allow the state to provide funding support for transit and alternative modes of transportation.

Another way to advocate for transit is by getting involved with your local government meetings. Providing feedback for members of local government is an integral step in improving transit service.

For too long, transit agencies have struggled to provide necessary service to our communities. So that all Americans are able to take advantage of this valuable resource, transit agencies must be given the support they need to deliver quality, reliable service.

Safety over speed week: Prioritizing safety is intrinsically connected with improving transit service

Nearly every bus transit rider starts and ends their trip with a walk, and decisions made to prioritize vehicle speed over safety often have significant impacts on transit. This excerpt from the new book Better Buses, Better Cities helps explain how better bus transit and prioritizing safety over speed are intrinsically related.

It’s “safety over speed” week here at T4America, where we are spending the week unpacking our second of three principles for transportation investment. Read more about those principles and if you’re new to T4America, you can sign up for email here.

The content that follows is an excerpt from “Better Buses, Better Cities: How to Plan, Run, and Win the Fight for Effective Transit” by Steven Higashide, published by Island Press. Steven is a former colleague of ours at T4America as an outreach associate based in New York a few years ago before moving on to the Tri-State Transportation Campaign and then to TransitCenter, where he today serves as the research director. We are proud to see his book in print and are thankful to him and Island Press for letting us share this long excerpt from Chapter 4 entitled MAKE THE BUS WALKABLE AND DIGNIFIED, sourced from pages 59–61 and 74-75. – Stephen Lee Davis, T4America.

On a Saturday afternoon in April 2010, Raquel Nelson, her 4-year-old son A.J., and her two other children (aged 2 and 9 years) stepped off the bus across the street from their apartment in Marietta, Georgia. It had been a good but long day. Raquel and her children had celebrated a birthday with family and pizza. To get home, they took their first bus from the pizza restaurant to a transit center, where they missed their connecting bus and had to wait more than an hour for the next one.

Home was across a five-lane, divided road. And so, together with several other people who had been on the bus, the Nelson family crossed halfway across the street to wait in the median. As Raquel stopped to gauge traffic, one of the other adults in the group decided to start walking. Raquel’s son A.J. broke free from her grip to follow, and Raquel hurried to catch up.

A.J. was killed moments later, by Jerry Guy, who was behind the wheel of a van despite having “three or four beers” in his system.

Raquel and her 2-year-old daughter were also struck and injured. And yet that was only the beginning of her ordeal.1

County prosecutors charged Raquel with vehicular homicide, which carried a potential sentence of 3 years in prison. A jury convicted her, and she was sentenced to 12 months’ probation with the option of a retrial, which she chose. Her case wound through the courts for 2 more years before Raquel agreed to plead guilty to a single charge of jaywalking.

Raquel Nelson’s case made national news. But the loss she and her family experienced is replicated in nearly every city on wide “arterial” roads that encourage high speeds. In the City of Los Angeles, for example, 6 percent of streets are responsible for 65 percent of traffic deaths and injuries. When mapped, pedestrian deaths line up on these roads like dominoes.

Because they tend to have important destinations on them, arterial roads also tend to carry the most bus riders. But the tie between transit and walkability goes beyond pedestrian safety. Nearly all transit riders are pedestrians at some point during their trip. In Los Angeles, for example, 84 percent of bus riders get to their bus stop on foot.

The pedestrian experience is the transit experience, then. A bus rider may appreciate frequent and fast service but still be dissatisfied with her trip if she has to trudge through mud on the way to the bus stop, cross the street with her head on a swivel, and wait in the rain with no shelter. Someone who uses a wheelchair may be unable to use the bus at all if there are no sidewalks leading to the stop.

Poor walkability is corrosive to bus ridership and makes it harder to improve transit service. In Staten Island, New York City, transit planners had to make major adjustments to a redesign of the borough’s express buses after riders complained that the changes forced them to walk in the street or on lawns.

Although Austin’s bus network redesign has generally been considered a success, it ran into the same problems. More than a month after the launch of the redesign, Capital Metro was still moving stop locations in response to complaints that people had to transfer in places without good walking infrastructure. “If you’re going to go to more of a grid-based system and you’re going to have more on-street connections, then you really need to look at the pedestrian experience of those intersections,” Capital Metro’s Todd Hemingson said. (As of April 2019, only about 60 percent of streets in Austin have sidewalks.)

Improving the walk to transit, on the other hand, can have measurable impacts on transit ridership. Ja Young Kim, Keith Bartholomew, and Reid Ewing of the University of Utah found that after the Utah Transit Authority built sidewalk connections to bus stops that lacked them, ridership at those stops grew almost twice as fast as at stops in similar neighborhoods that had not been improved. Demand for paratransit was also stemmed near the stops with sidewalk improvements, saving the agency on its budget.

Although walkability and transit can’t be separated, government usually makes its best effort to do so. Just as transit agencies must convince cities to give transit priority on the street, they must rely on local and state government to create a good walking environment. That’s no given.

The state of walking in America represents an enormous collective failure. Even in urban neighborhoods where many people walk, engineering practices that favor drivers tend to degrade the experience. Intersections can be designed with slip lanes that allow cars to gun through turns. Zoning may allow curb cuts that turn the sidewalk into a gauntlet of traffic. The default rule at most intersections is “right turn on red,” intrinsically hostile to people walking because there’s never a time when they can be sure cars won’t turn into their path.

These decisions are rooted in a philosophy that prioritizes vehicle speeds and is often baked into engineering measures and practices. Engineers often assess streets using a metric called “automobile level of service,” where an A grade is free-flowing traffic. A major traffic engineering manual recommends against striping crosswalks unless at least ninety-three pedestrians already cross the intersection per hour—or if five people were hit by cars at the intersection in the past year. Peter Furth, an engineering professor at Northeastern University, has pointed out that “Synchro, the standard software [traffic engineers] use, is based on minimizing auto delay, and it doesn’t even calculate pedestrian delay.”

Although most streets are municipally maintained, most cities require local property owners to maintain sidewalks abutting their property. This means that wealthier neighborhoods tend to have better maintained and safer sidewalks. The further you get from downtown, the more likely it is that sidewalks themselves will shrink, decay, or vanish. Property owners may not be required to build sidewalks at all, which means many cities simply lack sidewalks in a huge portion of their territory.

Fighting for People on Foot

Pedestrian infrastructure doesn’t cost much relative to other transportation infrastructure. Houston’s $83 million in backlogged sidewalk requests could mostly be wiped out by nixing a $70 million project to add an interchange on an area toll road. Even the $1.4 billion price tag to build functional sidewalk on every Denver street doesn’t look so daunting when the Colorado Department of Transportation is spending $1.2 billion in just 4 years to widen Interstate 70, which runs northeast of downtown Denver.

Shelters aren’t particularly expensive either, costing roughly between $5,500 and $12,000 each. In 2017, medium and large transit agencies spent $297 million on infrastructure at bus stops and stations, compared with $2.2 billion on rail stations—or about 6 cents per bus trip and 47 cents per rail trip.

Creating walkable places requires changing municipal processes so that compact planning (creating neighborhoods where there are many destinations worth walking to) and pedestrian-friendly street design become routine.

This often starts with outside advocacy and political action.

The do-it-yourself movements I mentioned earlier in this chapter ultimately seek not to supplant government but to prod it to action. A year after MARTA Army launched its “adopt-a-stop” campaign, the state of Georgia awarded the Atlanta Regional Commission $3.8 million for bus stop signs, shelters, and sidewalks. Cincinnati’s Better Bus Coalition doesn’t just build benches; it has also published an analysis showing that shelters are disproportionately in wealthy neighborhoods. Streetsblog USA runs an annual “Sorriest Bus Stop in America” contest that has gotten governments in Kansas City, Maryland, and Boston to address bus stop walkability.

In Nashville, a long-time neighborhood activist, Angie Henderson, was elected to the city’s Metropolitan Council on a platform of walkable neighborhoods in 2015. Henderson later sponsored and passed a law requiring most developments in inner-city neighborhoods and near commercial centers to include sidewalks or pay into a citywide sidewalk fund. Denver’s City Council created a $4 million fund to help lower-income homeowners fix the sidewalks in front of their houses and budgeted for three new Public Works employees to manage the program and step up enforcement of sidewalk regulations throughout the city. And Seattle’s Department of Transportation has broken with the engineering guideline that says crosswalks should be striped only where many people already cross or where there are frequent pedestrian crashes.

Within transit agencies themselves, it’s important to raise the profile of the walk and the wait. Metro Transit’s Better Bus Stops Program is a great example. The decision to elevate a routine process into a branded program gave bus stops new stature throughout the agency.

“[The process of siting bus shelters] could be thought of as very dull and unimportant,” Farrington said. “But to package it, to get a great little logo and have it be a substantial program with its own name and people, it’s been a positive spiral of more resources and more support of the work.” She said that staff who had previously worked on park-and-ride stations were now spending more time on bus stops. True, in some ways the program was an outlier, funded by an Obama-era discretionary program, Ladders of Opportunity, that no longer exists. But transit agencies could replicate it using funding from many other sources.

Metro Transit’s program also offers a clear example of how well-resourced, well-planned public engagement can strengthen and educate both the transit agency and the communities it operates in.


Thanks again to Steven Higashide and Island Press for allowing us to run this excerpt. You can buy his book direct from Island Press or find links to purchase at other various outlets there. -Ed

Walkscore innovators turn to improving public transportation

CItyGoRound LogoFront Seat, the civic software company responsible for the massively popular Walkscore service, launched a new project today aimed at encouraging public transportation ridership. The project makes transit agency schedule data available, accessible, and open to developers so they can create applications to make it easier to ride. CityGoRound.org is a new portal where you can find the many applications developers have created to ease and increase the convenience of riding transit. Their mission, outlined on a newly launched site today, is very simple:

Our mission is to help make public transit more convenient. For example, an app that lets you know when your bus will arrive is way better than standing outside waiting for 20 minutes. If we can make public transit more convenient, more people will ride public transit. More people riding public transit equals less driving. Less driving equals a healthier planet.

To accomplish that, they’re doing three things: cataloging the hundreds of smartphone/web applications people have created to make riding public transit easier, putting pressure on agencies across the country that have not released their public data, and raising awareness of the need for government agencies to open up their data.

By typing in your zip code at CityGoRound.org, you may find, for example, apps that have taken publicly available transit agency schedule data and turned it into a slick iPhone or web app you can check on the go to find out when that next bus is coming, or when the next train will be headed your direction. One major barrier to riding transit is the learning curve that comes with unfamiliar schedules or service. If you’ve never ridden the bus home from work, are you going to wait in the snow at 8 p.m. for your first try, hoping you understood the posted timetable correctly?

The openness of government data might sound like something that only techies need to worry about, but more openness in government both increases accountability to the people and makes services more available and convenient for the public. Just this week, President Obama announced a new comprehensive open government plan, establishing parameters for all federal agencies to open up their operations — and their taxpayer-funded data — to the public.

“We are calling on transit agencies nationwide to open their data and follow the lead of the Open Government Directive issued this week by the White House,” said Mike Mathieu, Founder and Chairman of Front Seat. “City-Go-Round’s transit apps are a concrete example of how open data can improve citizens’ lives on a daily basis.”

Go check out the site today. If your city’s agency doesn’t provide open data for public transportation, they have a petition there you can sign to find out how to get involved in making that happen.

Front Seat created the service with the Transit Developers Group, generously supported with a grant from the Rockefeller Foundation.