
Rising fatalities a sign to modernize federal design framework

A young woman holds onto her bicycle, waiting for the ped signal to cross a crosswalk showing signs of wear.

Despite a binding requirement to release an updated version more than a month ago, the Federal Highway Administration missed the deadline to release a new edition of a federal handbook with national influence on street design. There were many positive changes proposed for this edition, but unless this delay comes because further improvements are underway, this new edition might ultimately be another green light for increasing traffic fatalities.

Edit 6/30: Language in an earlier version of this post overstated the power of the MUTCD in shaping street design. While this manual is influential, other important resources inform street design, including the Green Book. This language has been changed.

A young woman holds onto her bicycle, waiting for the ped signal to cross a crosswalk showing signs of wear.
A cyclist waits to cross as cars zip past. Source: Flickr

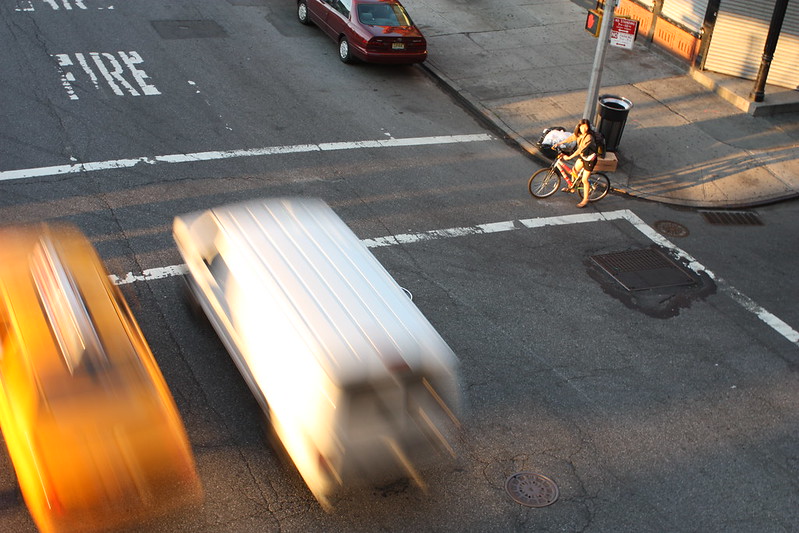
As Smart Growth America wrote in their 2022 report Dangerous by Design, the number of people struck and killed while walking reached yet another new high in 2020. More than 6,500 people were struck and killed while walking in 2020, an average of nearly 18 per day, and a 4.5 percent increase over 2019. This epidemic continues growing worse because our nation’s streets are designed primarily to move cars quickly at the expense of keeping everyone safe, but change can be made on every level to reorient toward protecting the most vulnerable rather than prioritizing the speed of a few.

There’s one Dangerous by Design recommendation that the federal government can take action on right away: an update to the little-known but highly influential Manual on Uniform Traffic Control Devices (MUTCD), defines standards for traffic control devices, which includes pedestrian crossings and lane markings like green bike lanes and red bus-only lanes. Though the current MUTCD prioritizes vehicle speed over pedestrian safety, the 11th edition MUTCD is an opportunity for the FHWA to make changes that benefit all road users—if they incorporate advocate feedback. Some proposed changes with potential include an update to the notorious 85th percentile speed standard, a decision on colorful crosswalks, and improvements for pedestrian crossing times. However, although these proposed changes might look good on paper, the revised MUTCD will likely leave most existing road networks as dangerous as ever.

85th percentile standard

While there’s no shortage of examples of the MUTCD placing the high-speed movement of cars at the top of the transportation hierarchy, there’s perhaps no greater example than that of the 85th-percentile speed standard. This standard sets what the National Transportation Safety Board calls a dangerous precedent for determining speeds: out of 100 drivers, the 15th fastest driver sets the speed limit. 

The intent behind this is to lower the difference in speed between the fastest drivers and the slowest, with the idea being that the cause of crashes is the difference in speed, not speed itself. But this flawed logic ignores that as speed increases, the probability of fatalities for vulnerable road users increases exponentially.  Blanket application of the 85th-percentile speed to arterials across the country has helped create the current crisis of pedestrian injuries and deaths—the majority of which now occur on state DOT-owned roads.

In the proposed edits for the new MUTCD, the 85th-percentile standard would be redesignated to a “guidance.” While that sounds better, this does not address the fact that unsafe roads in compliance with the new guidance would still be dangerous by design. Without providing engineers with safe design standards (like standards for road diets, raised crosswalks, chicanes, and narrower lanes), it would be impossible for this minor change to undo the speed status quo. The existence of the 85th-percentile rule is proof we know people will drive as fast as they feel comfortable. By softening the standard to a guidance, the MUTCD still fails to address design. State DOTs would still be responsible for choosing where to implement the rule on their roads, and without a change in standard practice or culture, it’s unclear what effect this change could actually have.

Pedestrian crossings

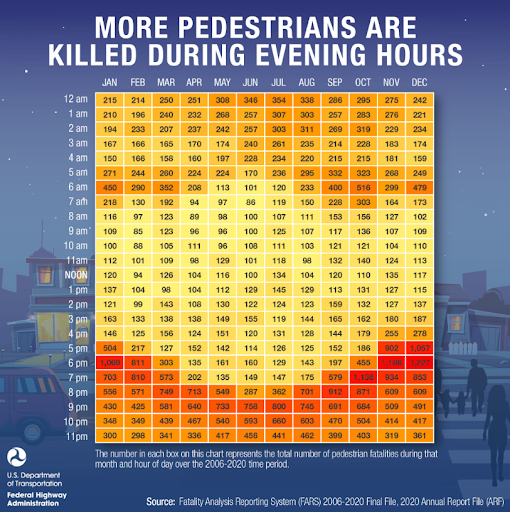
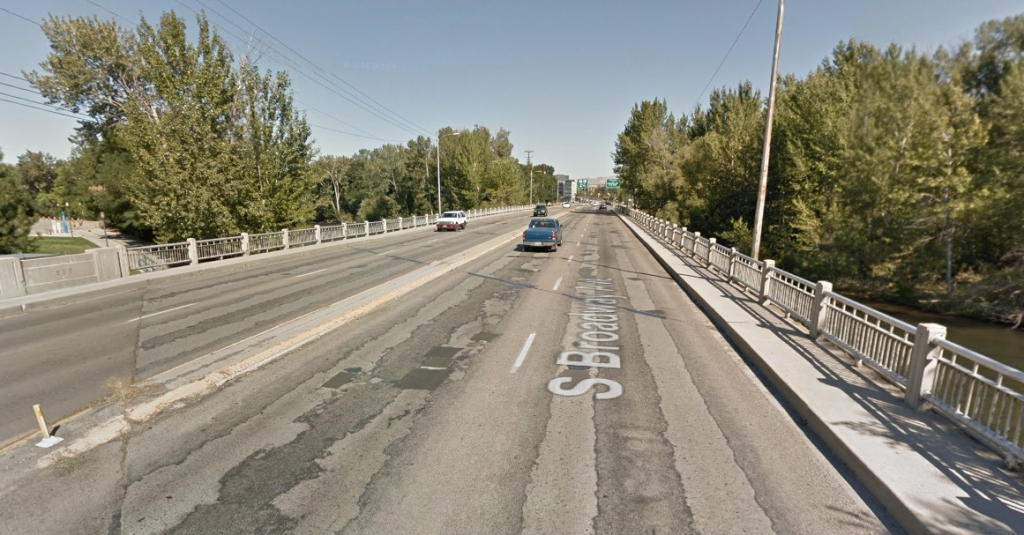
There are plenty of other standards in the MUTCD that foster dangerous design. Pedestrian volume per hour during “peak hours” is a main determining metric of what warrants a pedestrian signal at an intersection or midblock crossing. But peak hours focus on peak times for vehicular traffic, and what might be peak hours for a driver can be the worst, most uncomfortable time for a person to attempt to cross a busy roadway. Worse still, the National Highway Traffic Safety Administration’s FARS data has consistently shown that the deadliest hours for pedestrians are often well outside of what’s considered “peak.”

FHWA graph shows higher rates of pedestrian deaths after 6 p.m.
A graph from the FHWA describing pedestrian fatalities by hour from 2006-2020. Credit: FHWA

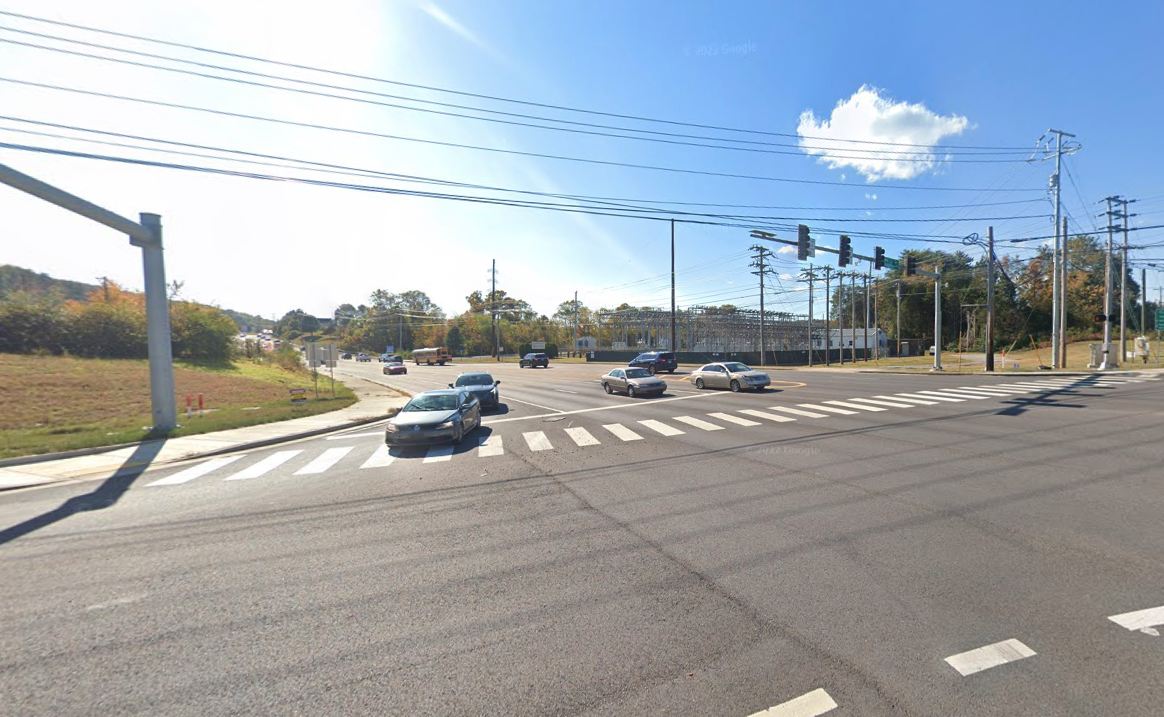
This leads to a deadly feedback loop that works against the most vulnerable—if the road feels unsafe or inconvenient to cross, no one will attempt to use it except for those with the fewest options. Hostile design makes it nearly impossible to safely walk the span of a roadway to reach services when you have to contend with multiple lanes of high-speed traffic. 

Just as people are more likely to drive on a wide, comfortable roadway, they’re more likely to walk on a sidewalk that feels safe. However, some MUTCD-compliant designs are so dangerous that cities feel the need to give their pedestrians bright red flags just for them to cross the road—an ineffective solution to a design problem.

Like with the 85th percentile standard, the 11th edition shifts pedestrian volume per hour warrants from a standard to a guidance, and tinkers with  other technicalities. Some changes are good, and could even result in longer, safer crossing times or more flashing pedestrian crossing beacons. But even if the proposed changes are adopted, they lack teeth. DOTs would be left to their own devices to enact the changes, and they could still point to the guidance as reason to not install a crossing.

MUTCD compliant crossing in Knoxville, Tennessee. Would you feel safe crossing here? Source: Google Maps

Colored crosswalks

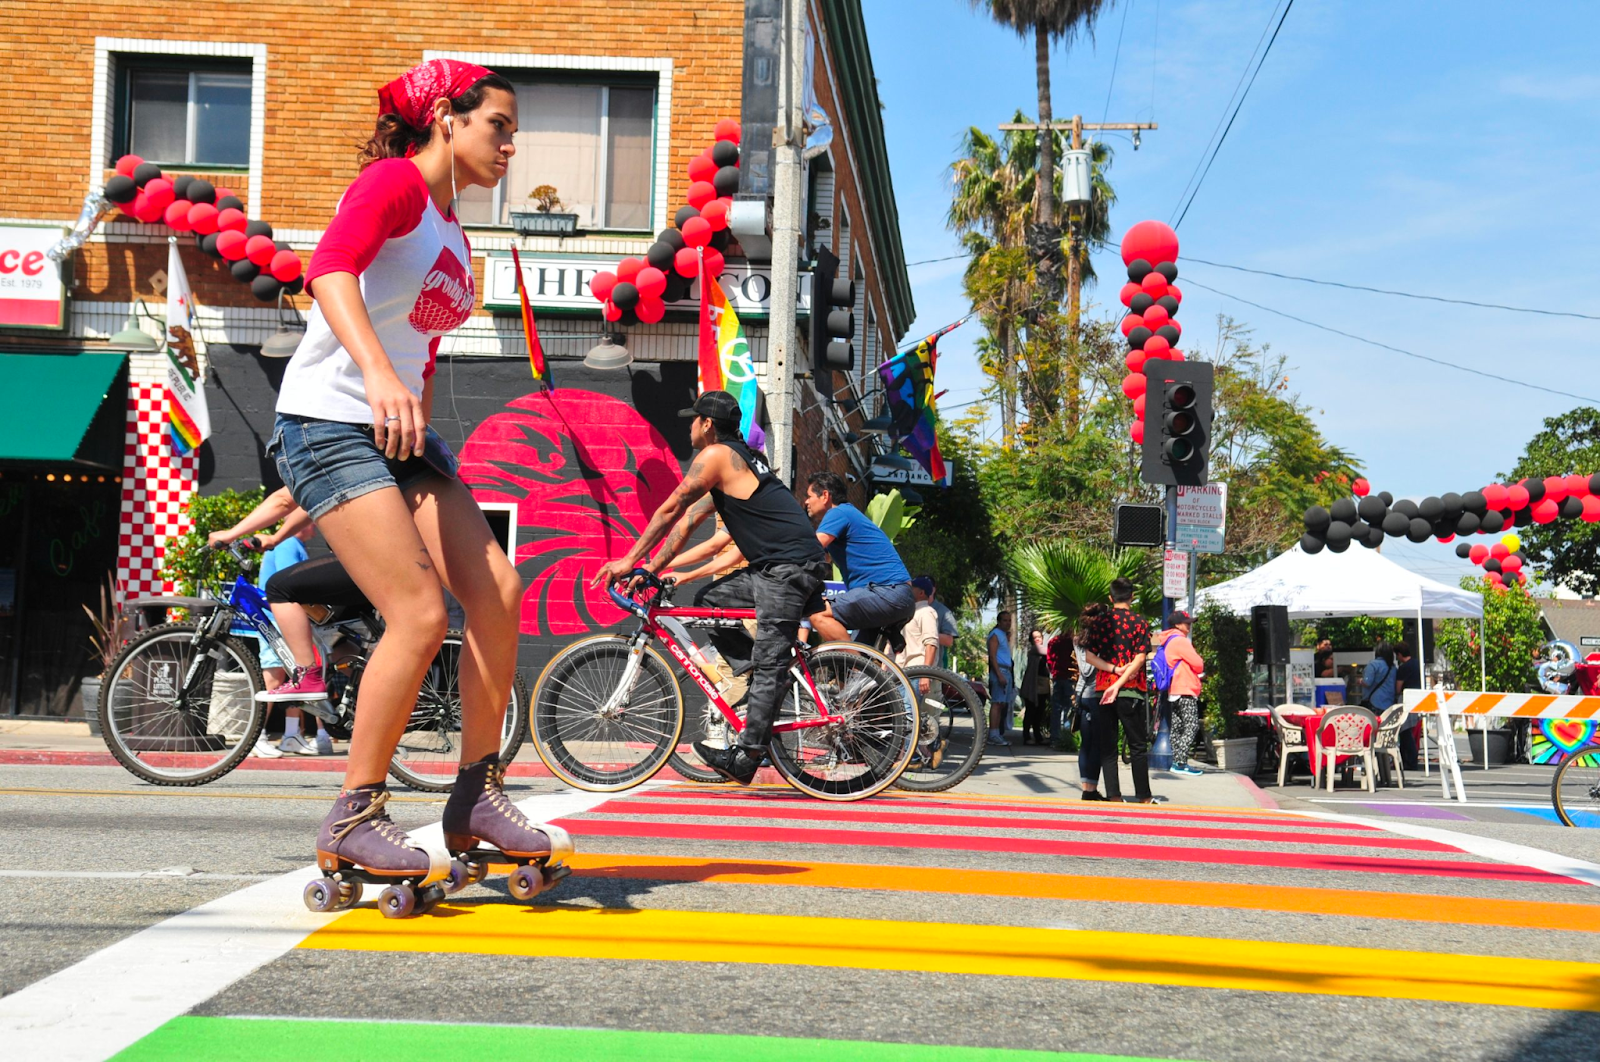
Research has shown that bright, colorful crosswalks and intersections make streets safer by drawing drivers’ eyes to the pedestrian crossing with the added benefit of creating more vibrant streets. However, since 2001, the FHWA has officially discouraged communities from using art at crosswalks and has consistently sent letters to cities ordering them to remove their art, or lose federal funding. FHWA justified their requests by claiming colorful crosswalks do not enhance safety, despite the fact that the agency has yet to conclude research on the topic. There is no apparent plan for public access to the research underlying the next edition’s ruling.

A roller skater and bicyclist cross a rainbow-colored crosswalk
Colored crosswalks, like the rainbow crosswalk above, can be an attractive way to signal for drivers to stop and look for pedestrians. The right design can also signify community and belonging. Photo source: Long Beach Public Works

If text in other sections of the proposed changes is any indication, the FHWA has an interest in maintaining total uniformity in crosswalks for the benefit of automated vehicles. Automated vehicles (AVs) see the world through artificial intelligence-based machine vision and have difficulty adapting to the dynamic scenarios common to urban environments, even if these are the same scenarios that are more likely to draw the attention of human drivers. 

AVs benefit from road environments with minimal variety and maximum contrast, and the 11th edition will likely propose prescriptive changes that would require road markings to be wider, brighter, and more frequent, explicitly for AVs. It is unclear why the FHWA seems willing to offer new concessions for vehicles that have so far failed to provide a proven safety benefit, but remain unwilling to allow changes that are proving to make vulnerable road users safer.

The bottom line

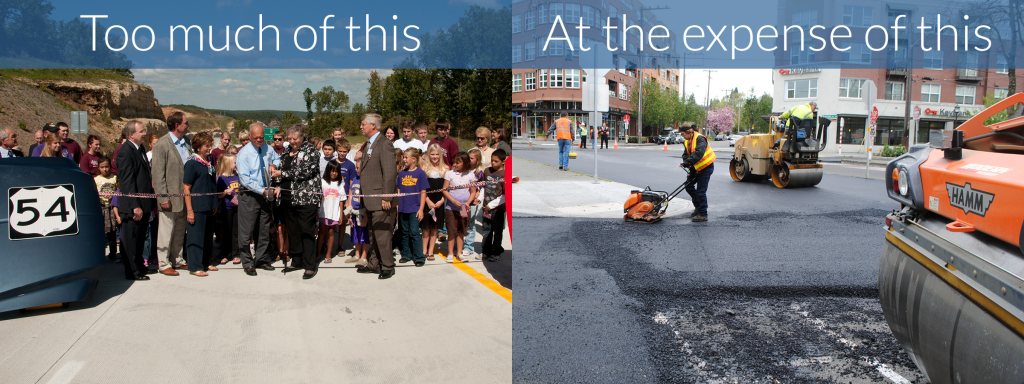
With speed and throughput of cars as the leading success metric, the so-called best practices outlined in previous editions of the MUTCD have increased the viability of cars at the expense of all other road users, including public transit, pedestrians, and cyclists. We are glad to see changes that allow for safer street design, but in the face of rising pedestrian fatalities, the 11th edition of the MUTCD doesn’t go far enough.

FHWA has made some progress on prioritizing safety over speed in other recent guidance. However, when it comes to the definitive guide to traffic control, making minor revisions in the midst of a crisis of fatalities that seem to increase year after year is a failure to meet the moment. We hope the extra time spent on the new edition has gone toward creating a safer MUTCD.

National transportation policy is a rudderless ship sailing off into oblivion

For well over two decades, we’ve had no big-picture guiding purpose for the federal transportation program. Like a ship with a jammed rudder heading off aimlessly into forever, federal transportation policy has been limping along without an overarching purpose or destination in mind. How does this inertia lead us toward all the wrong things?

Adrift

Is the purpose for the ~$60 billion in federal funds we spend each year merely to increase driving? To add more lane-miles? To ensure that pavement totals increase? To simply build some new stuff and try to keep up with the old stuff? To better connect people with opportunity in a measurable way? Here are six policies embedded in current transportation policy that are not a product of an intentional conversation about what we should accomplish, but rather the result of having zero direction and purpose since we completed the interstate system in 1992.1

1) States are rewarded financially for encouraging more driving and longer trips

It’s no mystery why states spend too much of their money building new lane-miles, new roads, and new bridges at the expense of repair and everything else: The financial payout for states is based on increasing driving as much as possible.

The bulk of all federal transportation money is doled out to states based on a series of formulas tied largely to population, number of lane-miles, and how much everyone drives (vehicle miles traveled, or VMT). If a state encourages more driving or if everyone takes longer trips, that state receives more money the following year. Conversely, if your state finds ways to reduce driving by investing in transit, more logically planning jobs and housing in better proximity to one another, or finding creative ways to manage travel demand, your state loses money.

Put another way, perhaps the most core, embedded philosophy of the federal transportation program is to increase driving—as if more driving itself is an unmitigated economic and societal good.

2) Federal programs originally designed to support and encourage long distance driving are poorly suited to fulfill more complicated modern needs

“Most state departments of transportation were created largely for one reason: to implement a highway-building program,” wrote T4America director Beth Osborne in this series on the Smart Growth America blog, and even the most forward-looking of state DOTs today still have that highway-building DNA embedded deep in their culture. Today’s aimless federal program needs to accomplish far more than the original intended purposes of moving people long distances across states or between metro areas. Yet we still try unsuccessfully to make this old, outdated system serve today’s needs. As Beth wrote in the opener for that series, “the same department that delivered this highway below on the left a few decades ago is the same one tasked with delivering the street on the right, perhaps right in front of your house.”

Our transportation needs have changed, but the federal program has failed to keep up.

3) Transportation emissions are growing because the program is designed that way

Transportation is the #1 sector for emissions and driving represents 83 percent of those emissions. These emissions are rising because people are forced to make more and longer trips. The U.S. has added metro interstate lane miles faster than our metro population has grown, increasing greenhouse gas emissions and obliterating the modest gains made in more efficient vehicles and cleaner fuel. With new roads subsidized by the federal government (covering around 80 percent of the cost), localities struggle to stay ahead of development that spreads further from the center of metro areas, forcing people to travel further to access jobs and services. This leads to a demand for more roads, which induces even more driving and pollution.

We simply can’t continue expanding our roadway network and lower emissions at the same time. The two goals are incompatible, and unfortunately, increasing driving is a purpose embedded deeply in the program. If the main policymakers in Congress can stop talking about money long enough to do so, it’s past time for a conversation about making shorter trips and shared trips a core goal and purpose of the program.

4) We subsidize driving at the expense of providing any other options

Given a transportation challenge to solve, the federal program puts its thumb on the scale in favor of a road “solution” by covering about 80 percent of the cost, while only providing about half of the cost for a transit solution to the same problem. On top of that, not only do we make transit projects jump through more hoops in an arduous development process that no highway projects are subject to, but we actually hold them to a more realistic standard of long-term affordability. As we wrote for Strong Towns last week, “with new federally funded transit projects, agencies have to prove they have sufficient funding to operate and maintain the new line or service, and can do so without shortchanging the rest of their system.”

The federal program encourages costly over-expansion because it doesn’t require states to prove they can afford to maintain what they’ve been encouraged to build in order to get more federal money. Congress is perfectly fine with states building a new road they can’t afford to preserve long-term, even as they are failing to maintain the rest of their system in a good state of repair. And then, as we wrote in Repair Priorities, “those states return to the federal government every few years requesting more funds to address their unmet ‘needs,’ when those needs could have been prevented or delayed with more responsible spending practices.”

That’s why we’re in this goofy situation where every state and every lawmaker seems to thinks the problem is just a lack of money.

5) The program asks the wrong questions and measures the wrong things

The program is obsessed with vehicle speed and you can see it in the few, limited ways that we try to measure whether or not our system succeeds. If you have a 15-minute commute to work in congested urban street traffic, are you better off than if you have a 45-minute commute in traffic that moves quickly? All of the incentives embedded in the program related to how we measure and assess congestion would prefer the second commute. And because free-flowing traffic is considered the gold standard, roads are built to ensure that traffic flows quickly, and this is what leads us to more and wider roads, and more and longer trips. (And streets that are then uninhabitable for anyone walking or biking.) Perhaps, a better measure would be assessing whether or not people can reach jobs and services by any mode of travel, rather than the simplistic measure of whether some of them travel at high speed when driving.

6) We undercut all our other priorities with a strategy to reduce congestion that fails every single time

The federal program is obsessed with reducing congestion, yet everything we do to reduce congestion just makes it worse.

A new study from Cal State Northridge showed that increasing lane-miles increases driving proportionally: a one percent increase in lane-miles results in a one-percent increase in driving. The best part? Expanding roads also fails to improve traffic: the speed increases from highway widenings disappear in five years because of more traffic. We expanded the country’s road system by about three percent from 2009-2017, guaranteeing at least a three percent increase in driving right there. On top of that, it’s impossible to square the priority of speed with the other things we want to accomplish, like improving safety, increasing reliability, or lowering emissions. From the SGA series:

This assumption of “the cars need to always move fast and never slow down” is at the root of most of the big problems that [state DOTs] face. Engineers have a prerequisite—sometimes explicitly stated but always implicit in the agency’s culture of practice—that makes every other priority a nearly impossible task. In practice, what this turns into is a list of secondary goals states would like to accomplish, that usually get sacrificed for the real top priority of speed. Until we come to grips with the fact that moving cars fast at all times of day without delay is a goal that can’t always be squared with all of the other priorities, until we can admit that perhaps everyone is not going to be able to go fast all the time, we’ll continue building unnecessarily large and expensive roads where speed is the number one priority and most other priorities fall by the wayside.

Make sure the vehicles can always go fast

AND
  • Prioritize repair first
  • Keep everyone safe, including people walking & biking
  • Create vibrant places worth visiting
  • Keep your costs low
  • Don’t negatively impact nearby communities
  • Help connect everyone to jobs and opportunity, whether they drive or not
  • Promote sustainable and lasting economic development
  • Reduce transportation-related emissions

Wrapping up: It’s past time to make some new goals for what this program is supposed to accomplish

Back in the 1950s we dramatically reshaped our federal transportation policy around accommodating high speed vehicle travel, and our federal program functioned with this unifying purpose for decades. Brand new highways made cross-country and inter-state travel easier than ever before, boosting the national and local economies by connecting places that weren’t well-connected before. But they also started to transform the way we we built homes and destinations by enabling easier travel from cities to their fringes. 2 Today, the challenge is making sure people have access to jobs, services and amenities within easy distance of their homes. To accomplish this, we will need to remove barriers, build bridges (real and metaphorical) and provide safe, affordable convenient alternatives to get around.

Rather than limp along, plowing billions into adding a lane here or a new road there with no equivalent economic return, let’s state a set of clear, explicit goals for the federal program, guaranteeing less driving, more options, healthier communities, and less pollution—all things we should be encouraging as we near the quarter pole of the new century.

Pew: “Self-sustaining” highways are increasingly subsidized

-- LA highwayCritics of public transportation often cling to the canard that government should not subsidize a transportation option that cannot pay for itself. These naysayers reference “self-sustaining” roads and highways, which receive funding from user-fees – in this case, the federal gas tax.

A new study conducted by SubsidyScope, an initiative of the Pew Charitable Trusts, reveals that not only are roads and highways not self-sustaining, but the amount covered by gas taxes has been declining — leaving an increasing amount of their massive cost to be subsidized. Pew projections – using Federal Highway Administration numbers – show user fees contributing a slim majority of the revenue to the Highway Trust Fund, with the difference made up through bonds and General Fund dollars. Public transportation does, as the critics assert, operate “at a loss,” but so do roadways (see chart below, courtesy of Subsidyscope).

The researchers wrote: “In 2007, 51 percent of the nation’s $193 billion set aside for highway construction and maintenance was generated through user fees — down from 10 years earlier when user fees made up 61 percent of total spending on roads. The rest came from other sources, including revenue generated by income, sales and property taxes, as well as bond issues.” Forty-years ago, they noted, user-fees generated 71 percent of highway revenues.

Of the 18.4 cent federal gasoline tax, 2.86 cents – about 15 percent – is directed toward mass transit projects, and an additional 0.1 cent toward environmental clean-up, according to the report. That leaves more than 80 percent strictly for highways. Even if we spent 100 percent of gas tax revenues on highways, only 65 percent of their total cost would be covered. There would still be a need for significant outside revenue – in other words, subsidies. Does that mean highways are “government waste?” Or are transportation dollars an investment to provide access to jobs and movement of goods?

One reason for the decline of the user-fee’s contribution is that the gas tax has not kept pace with inflation. Today, there is limited political appetite for a gas tax increase. Americans are also driving cleaner cars than they used to, due in large part of federal action on fuel economy. Less gas purchased means lower gas tax revenues.

So, to the critics who seem to be against all subsidies — unless they’re going to cover highway projects: let’s drop the claim that highways “pay for themselves” and have a debate rooted in fact rather than myth.

highway_funds_chart