Stories You May Have Missed – Week of August 18th

Stories You May Have Missed

As a valued member, Transportation for America is dedicated to providing you pertinent information. This includes news articles to inform your work. Check out a list of stories you may have missed last week.

  • Driving Community Change, The National Urban League and Lyft Inc. are joining forces to advance ride-hailing services for every community, especially those that are underserved. (Morning Consult)
  • Traffic deaths down slightly, but still historically high. Traffic deaths have declined slightly this year but are still higher than two years ago, according to preliminary estimates.(The Hill)
  • Public forum will explore TOD in Chicago. (Curbed Chicago)

Illinois legislature passes new policy that will aid the financing of transit projects

A just-passed bill in Illinois will make it easier to finance the construction and expansion of transit service across the state, making it easier for several crucial transit projects to go forward in the Chicago region.

This post was written by Peter Skosey, the Executive Vice President of the Metropolitan Planning Council in Chicago, Illinois, and reprinted here with his permission. MPC is a T4America member. Curious about membership with T4America? Find out more here.

Transit in Chicago just got a whole lot better, thanks to the General Assembly in Springfield — not the actor normally credited with such matters.

On July 1, 2016, the House and Senate approved the Transit Facility Improvement Area (TFIA), an innovative approach to finance specific transit projects in the City of Chicago. MPC has long supported this solution that many other cities across the country use, including Denver, San Francisco, Atlanta, New York and Milwaukee.

For decades, the entire country has neglected maintenance of existing trains, roads and bridges in favor of building new infrastructure. However, the latest federal transportation bill created a new “core capacity” provision, championed by Illinois’ own Sen. Dick Durbin, which allows critically needed maintenance projects [that will improve capacity], such as rebuilding the Chicago Transit Authority’s Red and Purple lines from Belmont north to the end of line in Evanston, to receive significant funding from Washington. These federal transit grants have one “catch:” locals must match those dollars, in this case about one-for-one.

chicago amtrak expansionBy authorizing TFIA, the Illinois General Assembly created a way for Chicago to provide the necessary match for Red/Purple Line modernization and critical improvements to Union Station  — for which Amtrak is currently doing phase 1 engineering and seeking a master developer.

Here’s how TFIA works: The added value that enhanced transit service brings to the surrounding property is captured in the form of property taxes and used to finance the improvements to the transit facility [that catalyzed the increases in the first place].

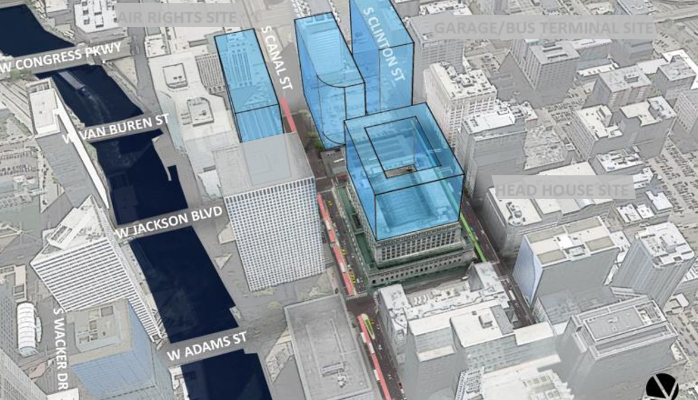
In the case of Union Station, Amtrak is seeking a developer to build on three parcels it controls. (Indicated in blue in the image above.) The additional property tax generated from those three new developments would be captured for up to 35 years to finance critical improvements to Union Station allowing for wider platforms, a roomier concourse and more trains in and out of the station. This is imperative, as Union Station is at capacity now and future growth of Chicago’s downtown depends on people being able to access their jobs via transit.

Many deserve kudos and thanks for supporting the TFIA measure: the original Senate and House sponsors of SB277, Heather Steans (D-Chicago) and Ron Sandack (R-Downers Grove); House leader Barbara Flynn Currie (D-Chicago) and Sen. Toi Hutchinson (D-Chicago Heights), who sponsored the ultimate bill, SB2562; members of the House who voted 78 to 27 in favor; and the Senate, which unanimously approved the measure.

Passage of TFIA was a great step forward in the battle to maintain our region’s transportation infrastructure and remain competitive in the global economy. Next up: Illinois must identify $43 billion in new revenues over the next 10 years to take care of the rest of the system.


These kinds of important changes to state policy are exactly what we’ll be discussing at Capital Ideas II this November 16-17 in Sacramento. Join us there and learn lessons to take back to your state. Register today!

Capital Ideas banner sacramento promo

Better together: All aboard for collaboration in the Midwest

Chicago is the busiest rail hub in the United States. Every day, nearly 500 freight and 760 passenger trains pass through the region. Many of those nearby cities connected via rail have benefited from developing the areas around their stations (read about a few in our 2013 report, The Little Cities That Could), and Chicago itself will soon see a large-scale renovation of its own Union Station. But these assets and local economies are seldom talked about or considered as a whole. That’s a mistake according to a recent OECD report that found that in order to grow, leaders in the Greater Chicagoland region — Northeast Illinois, Northwest Indiana, and Southeast Wisconsin — must better coordinate.

“Regional economic development is the way of the future” says Kelly O’Brien, director of the Alliance for Regional Development, which hosts a regular series of “quarterly conversations” to support improved collaboration among the region’s economic development interests. The group mirrors efforts of regional partnerships like those in Maryland and Virginia, where leaders have worked together on economic development initiatives, or Pennsylvania and Ohio, which collaborate on workforce development issues.

On June 10th, we had the chance to join leaders from the greater Chicagoland region — including Illinois, Northwest Indiana, Southeast Wisconsin, and even Michigan — at the Chicago Metropolitan Agency for Planning for one of these conversations, this one focused on intercity rail & freight movement. Transportation for America Chair John Robert Smith joined the day to facilitate a panel about the economic value of passenger rail. Among the highlights, we heard that:

  • Beyond the commercial development opportunities promised by passenger rail investment, there are also huge potential benefits to be realized by other sectors of the economy; in total, the passenger rail manufacturing supply chain provides over 90,000 jobs in the Unites States, 60% of which are in the Midwest. (See the full report from the Environmental Law and Policy Center)
  • Leaders from across freight industries are counting on the unprecedented $1 billion dollar CREATE program to address one of the country’s biggest, most problematic freight rail bottlenecks that affects the movement of passengers and goods across the country.
  • Northwest Indiana is readying land to replace pockets of postindustrial decline with thriving transit-oriented development. The region is also planning for a new, commuter rail line extension of the state’s existing South Shore Line into Chicago. (See the Northwest Indiana Regional Development Authority website for more information)
  • New research from T4America member UIC Urban Transportation Center proves what many passenger rail advocates already know: leaders from across the industry agree that more investment is needed.

While O’Brien states that supporting collaboration “can feel like pushing a boulder up a hill” at times, the connections are being made; the day’s first panel featured leaders from the Indiana, Michigan, Illinois, and Wisconsin Departments of Transportation who are working in lockstep to more efficiently own, maintain, and operate their equipment, and collaborating through the Midwest Regional Rail Initiative.

Though a wide range of groups was represented in the meeting, leaders invoked the need for even more voices supporting these investments: such as developers, tourism leaders, the manufacturing community, and state legislatures.

“We are cooperating more than ever before, but we are still missing key players” said Tim Hoeffner, an MDOT leader who also chairs the Midwest Interstate Passenger Rail Commission. “we need to better harness the voices of local leaders,” he said.

At Transportation for America, amplifying the voices of local leaders is central to our mission. And we can’t do it without your help. For more information about getting involved in the Midwest or to recommend a local leader, contact Erin Evenhouse, Midwest Outreach Manager, at erin.evenhouse@t4america.org.

We can do more, together.

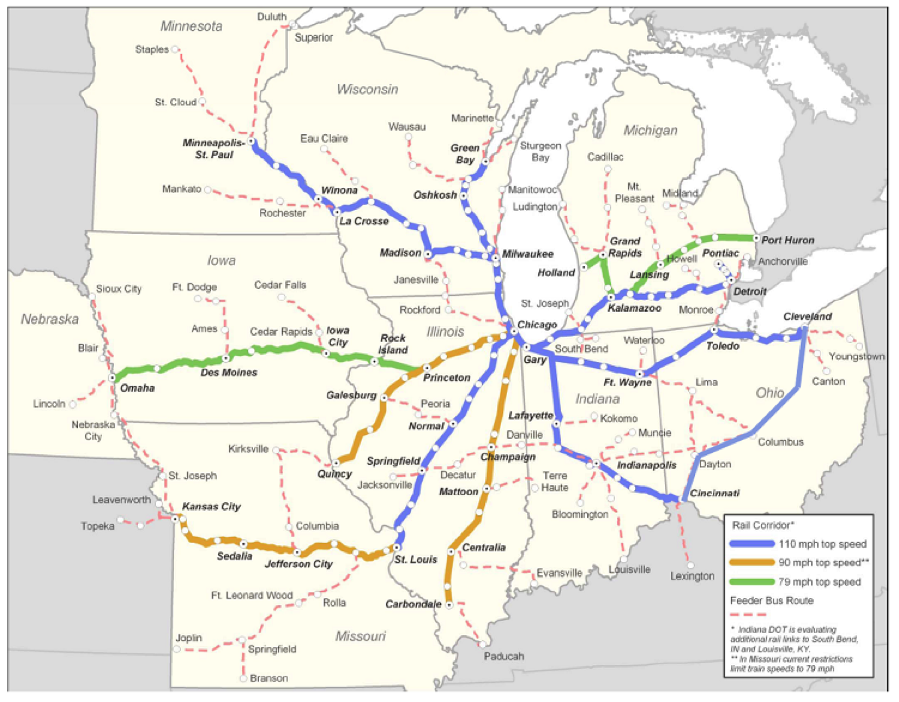
The current plan for the Midwest Regional Rail System. Photo Courtesy of the Indiana Passenger Rail Alliance

The current plan for the Midwest Regional Rail System. Photo Courtesy of the Indiana Passenger Rail Alliance

Congestion rankings make news, but what do they really mean? Very little for most residents

The Texas Transportation Institute always garners a flurry of headlines with the release of the annual Urban Mobility Report and its Travel Time Index (TTI), which purports to rank metro areas by congestion. Oft-cited and interesting though they may be, however, the rankings don’t really say much about the lives of the people who live in those places.

That’s because the TTI is a theoretical construct that doesn’t fully reflect what we experience on a day-to-day basis. Its fixation on peak-hour speeds ignores the actual time and distance of most residents’ commutes.

As an example, consider the findings for Chicago and Atlanta, two metros that ranked close together in the report released this week, as they have in years in past. According to the 2012 Travel Time Index (pdf), they’re near the top with scores of 1.24 and 1.25 respectively, and tied for seventh in yearly delay per commuter.

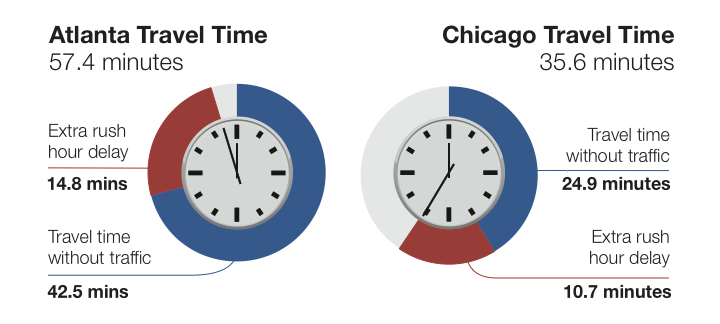
The graphic below was created based on an earlier Urban Mobility Report, from 2009, but its key points are valid today. At the time Chicago was actually 23 percent worse than Atlanta according to the TTI. That must mean the commute for most Chicagoans was worse than for most Altantans, right? Well, actually … no.

Chicago Atlanta travel time

In truth, Chicago commuters had an average travel time of almost twenty minutes less than their counterparts in Atlanta. In Chicago, the average peak period travel time is 35.6 minutes – 38 percent less than the 57.4 minutes in Atlanta. A major reason for the better highway performance in Chicago is that drivers do not have to travel as far as drivers in Atlanta – 13.5 miles compared with 21.6 miles.

Study that for a minute. Most Chicagoans live closer to work and spend less time getting there. Metro Atlanta residents spend much more time in the car. Yet the two are ranked similarly because the difference in traffic speed during peak hour versus off-peak (say, 3 a.m.) is similar in both places. Ultimately, the TTI doesn’t really care about overall quality of life for the majority of residents. It’s all about how fast you can drive at peak hour.

The Washington, D.C. and Denver metro areas are two that have seen their congestion rankings remain stubbornly high. In truth, though, both places have seen pay-off from actions that are expanding the share of homes in walkable neighborhoods with access to good public transportation and other options. As a result, commute distances are dropping. More people are living closer to work, more are walking, biking or taking transit to work. They are avoiding peak-hour traffic altogether – or spending less time driving because jobs and shopping is closer together. That’s making life better for them – they report enjoying their commutes more than freeway travelers – and it’s taking the pressure off the overcrowded freeways.

We’re not big fans of congestion. We think a lot of it could have been avoided with better planning and smarter development. But doing more of the same is not going to solve the problem. That’s why it’s so critically important that the performance measures being adopted by states and the feds under the new MAP-21 look beyond the blinkered TTI and delay measures for indicators of transportation success. How far do most people have to travel for work? How long does it take them? What is most effective at reducing the amount of time it takes to get places? Those are the kinds of metrics we need to use in order to find real solutions to help people spend less time in or stay out of those rush-hour traffic jams.

Telling only half the story of congestion, travel time and the quality of our metro areas

A popular study on traffic and congestion in our metropolitan areas is widely cited by the national, state and local media with every annual release, but it doesn’t tell the entire story. Far from it. That’s because measuring congestion while ignoring the actual time and distance spent commuting is a poor measure of what residents’ actually experience on a day-to-day basis.

The popular and oft-cited Texas Transportation Institute’s annual Urban Mobility Report isn’t an incorrect metric, it just tells half of the story. For starters, let’s consider two metros that appear to be ranked pretty close together in the latest report out today. Atlanta and Chicago appear to both be pretty miserable in regards to congestion, right? According to the 2012 Travel Time Index (pdf), they’re near the top with TTI scores of 1.24 and 1.25 respectively, and tied for seventh in yearly delay per commuter. (In 2009, Chicago’s TTI was 1.43 – 23% worse than Atlanta’s 1.35.)

That must mean that the commute is just as bad in both of these areas, right? Well, no.
Chicago Atlanta travel time

These statistics are from 2007, due to a limitation with how we can break down the TTI data.

Take an informal poll of your friends and co-workers: Who wouldn’t agree that a 35-minute commute is better than a 57-minute commute? Then why do we rely on measuring performance in a way that says the exact opposite? The TTI is almost the exact same for these two metros now, yet Chicago commuters had an average travel time of almost twenty minutes less than their counterparts in Atlanta a few years ago. That’s because TTI focuses only on how fast we can drive at peak while ignoring how far apart the destinations are in these two places.

In Chicago, the average trip to work is 35.6 minutes – 38% less time than the 57.4 minutes it takes Atlantans to drive to work. A major reason for the better highway performance in Chicago is that drivers do not have to travel as far as drivers in Atlanta – 13.5 miles compared with 21.6 miles. The amount of time it takes to go somewhere isn?t just about speed, that’s only half of it — it?s influenced both by how fast you travel and the distance you have to travel. Chicago and Atlanta are different places, so what about comparing an apple to an apple?

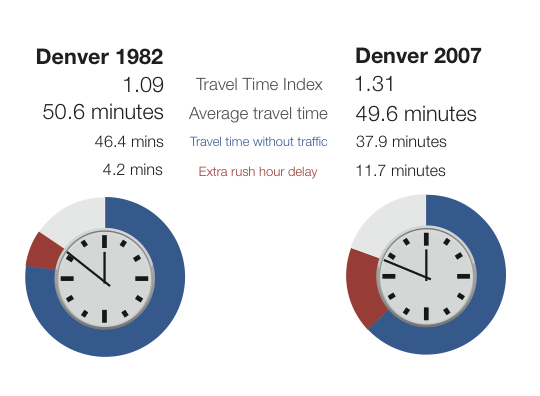
Denver, Colorado (8th worst TTI in 2012) has experienced a rebirth in its city core in the last decade or two, with residents flocking to new apartments and homes in the city center and close-in neighborhoods, attracted in part by the huge investment in regional transit. More people live near transit today in Denver than years ago, and with accompanying investments in new housing and jobs near transit and in more walkable neighborhoods, that means more people have shorter trips to get to work each day. Yet TTI shows that commuting in Denver is far worse in 2007 than it was 25 years ago. (TTI in 2012 is 1.27)
Denver 1982-2007 travel time 2

Look at the average travel time in 2007 in Denver compared to 25 years ago — it’s about the same. Rush hour delays have almost tripled, but the travel time without traffic (a good proxy for the average length of trips) actually decreased by almost ten minutes. Destinations are closer. Residents have more options. Commuters take shorter trips.
HPIM6863

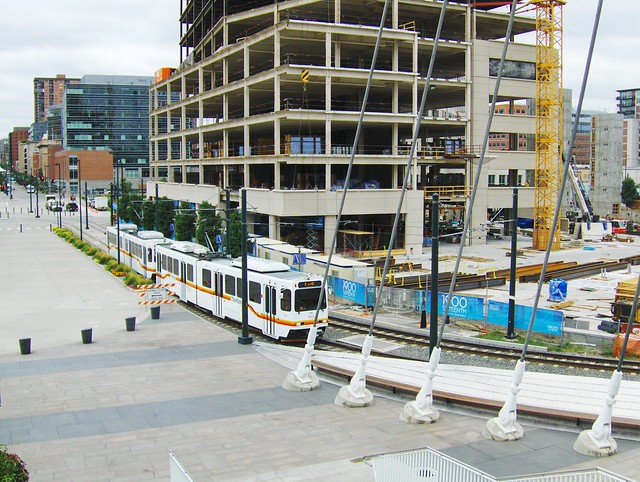
Denver downtown construction near light rail. Creative Commons Flickr photo by vxla ***

Relying solely on TTI to try and measure congestion and travel time in your city is like measuring only measuring two dimensions of a three-dimensional object. Like measuring the length and height of a new couch for your living room while ignoring the depth. The couch is 48 inches tall, but without measuring the depth, do you have any idea if it’ll fit through your front door?

This gets at the core problem with TTI — when cities and regions (or the USDOT) rely solely on TTI as the single measure of congestion and make all their decisions about future transportation investments based on only part of the whole picture, regions prioritize projects to reduce TTI or shave a few seconds off of rush hour delay.

Legislators, the Federal Highway Administration, state DOTs, and newspapers all use the Travel Time Index to measure highway performance. Then we spend millions or billions to build projects that lower this number, but we rarely get to work in less time.

As the nation shifts to a performance-based transportation system — beginning under MAP-21 — it is key that the first national performance measures get this right. Any national performance measure needs to allow communities to consider both factors — speed and distance.

There’s probably a handful of federal, state or local legislators looking at the headlines in their local newspaper today about congestion in their metro region. Maybe they’re saying “we’ve got to do something about this!” We need to do “something” — they’re right! But accurately measuring the problem is the only way to find an appropriate solution.

Let’s start there.