


Congestion rankings make news, but what do they really mean? Very little for most residents
The Texas Transportation Institute always garners a flurry of headlines with the release of the annual Urban Mobility Report and its Travel Time Index (TTI), which purports to rank metro areas by congestion. Oft-cited and interesting though they may be, however, the rankings don’t really say much about the lives of the people who live in those places.
That’s because the TTI is a theoretical construct that doesn’t fully reflect what we experience on a day-to-day basis. Its fixation on peak-hour speeds ignores the actual time and distance of most residents’ commutes.
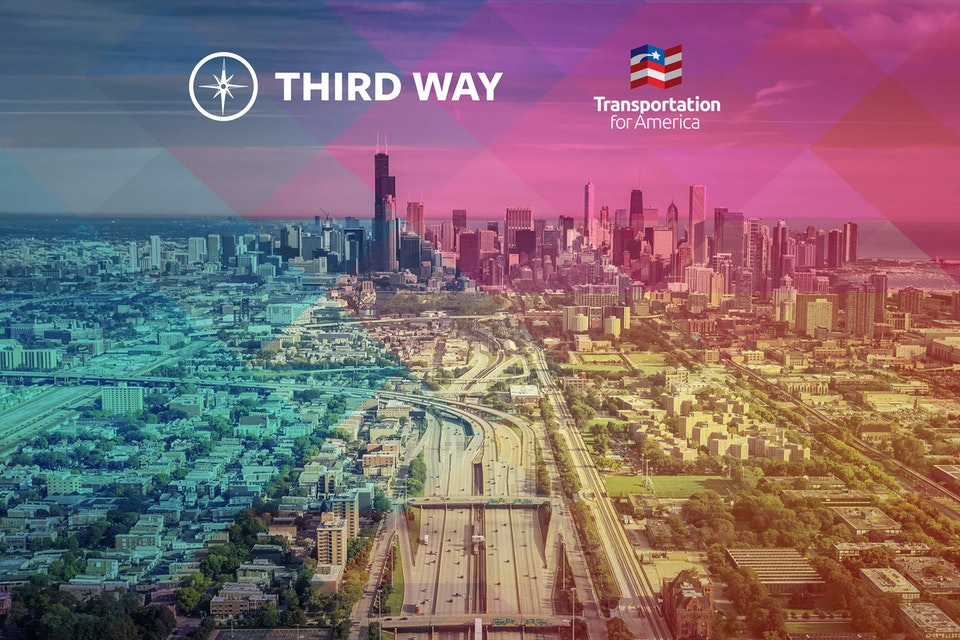
As an example, consider the findings for Chicago and Atlanta, two metros that ranked close together in the report released this week, as they have in years in past. According to the 2012 Travel Time Index (pdf), they’re near the top with scores of 1.24 and 1.25 respectively, and tied for seventh in yearly delay per commuter.
The graphic below was created based on an earlier Urban Mobility Report, from 2009, but its key points are valid today. At the time Chicago was actually 23 percent worse than Atlanta according to the TTI. That must mean the commute for most Chicagoans was worse than for most Altantans, right? Well, actually … no.
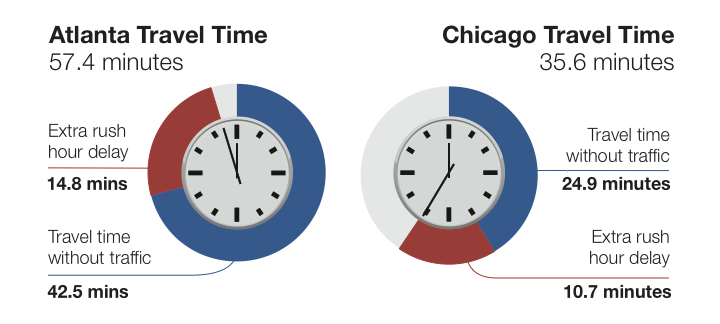
In truth, Chicago commuters had an average travel time of almost twenty minutes less than their counterparts in Atlanta. In Chicago, the average peak period travel time is 35.6 minutes – 38 percent less than the 57.4 minutes in Atlanta. A major reason for the better highway performance in Chicago is that drivers do not have to travel as far as drivers in Atlanta – 13.5 miles compared with 21.6 miles.
Study that for a minute. Most Chicagoans live closer to work and spend less time getting there. Metro Atlanta residents spend much more time in the car. Yet the two are ranked similarly because the difference in traffic speed during peak hour versus off-peak (say, 3 a.m.) is similar in both places. Ultimately, the TTI doesn’t really care about overall quality of life for the majority of residents. It’s all about how fast you can drive at peak hour.
The Washington, D.C. and Denver metro areas are two that have seen their congestion rankings remain stubbornly high. In truth, though, both places have seen pay-off from actions that are expanding the share of homes in walkable neighborhoods with access to good public transportation and other options. As a result, commute distances are dropping. More people are living closer to work, more are walking, biking or taking transit to work. They are avoiding peak-hour traffic altogether – or spending less time driving because jobs and shopping is closer together. That’s making life better for them – they report enjoying their commutes more than freeway travelers – and it’s taking the pressure off the overcrowded freeways.
We’re not big fans of congestion. We think a lot of it could have been avoided with better planning and smarter development. But doing more of the same is not going to solve the problem. That’s why it’s so critically important that the performance measures being adopted by states and the feds under the new MAP-21 look beyond the blinkered TTI and delay measures for indicators of transportation success. How far do most people have to travel for work? How long does it take them? What is most effective at reducing the amount of time it takes to get places? Those are the kinds of metrics we need to use in order to find real solutions to help people spend less time in or stay out of those rush-hour traffic jams.
Our three principles
It’s past time to elevate the national conversation about infrastructure beyond just the price tag.
Learn more about our platformLatest From The Blog


Progress for passenger rail in the South and…
Apr 10th, 2024


Building back better: Reflections on the state of…
Apr 9th, 2024
FTA helps deliver more buses for less
Apr 2nd, 2024

I cannot find the zoom link, I registered…
Jan 6th, 2024

A rare look behind the curtain of Transportation…
Jul 28th, 2023

In what Harrison Ford said was his most…
Jul 25th, 2023

Good example, walking to the local taco place…
Jul 24th, 2023

Pingback: Biggest cities with biggest transit systems still face biggest congestion | GreenEnergy4.us
Pingback: Complete Streets news: February 2013 | Smart Growth America