
 |
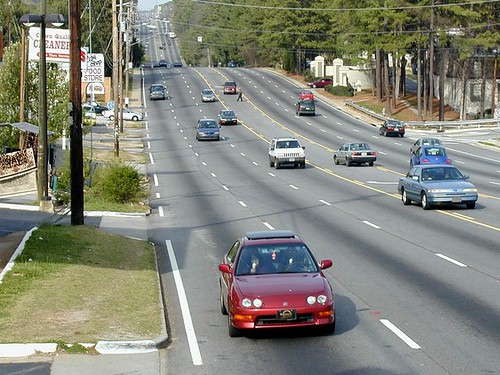
| YikesPedestrian Originally uploaded by Transportation for America |
| Look carefully in the turning lane above the center of the photograph. There’s a pedestrian trying to cross this 7-lane urban arterial road. See any crosswalks anywhere on the road? Photo courtesy of Dan Burden. |
Over the last several decades, many of our cities and communities have seen the same shift of daily business from walkable, downtown Main Streets to wide, fast-moving state highways. These “arterial” roads are the new main streets in most communities, drawing shopping centers, drive-throughs, apartment complexes and office parks. Unlike the old walkable main streets, however, the pressure to move as many cars through these areas as quickly as possible has led transportation departments to squeeze in as many lanes as they can, while disregarding sidewalks, crosswalks and crossing signals, on-street parking, and even street trees in order to remove impediments to speeding traffic.
As a result, more than half of fatal vehicle crashes occurred on these wide, high capacity and high-speed thoroughfares. Though dangerous, these arterials are all but unavoidable because they are the trunk lines carrying most local traffic and supporting nearly all the commercial activity essential to daily life.
Before the top 10 most dangerous city rankings, here are just a few facts you might like to know:
Inadequate facilities. Of the 9,168 pedestrian fatalities in 2007-08 for which the location of the collision is known, more than 40 percent were killed where no crosswalk was available.
Spending disparity. Though pedestrian fatalities make up 11.8 percent of all traffic-related fatalities, states have allocated less than 1.5 percent of total authorized transportation funds to projects aimed at improving safety for pedestrians (for funds spent under current transportation bill.) No state spends more than 5 percent of federal transportation funds on safety features or programs for pedestrians or cyclists, despite a 30 percent increase in total federal transportation dollars beginning in 2005.
Complete streets save lives. Providing sidewalks, crosswalks and designing for lower traffic speeds saves lives. Only one in 10 pedestrians deaths occurred within crosswalks, while six in 10 occurred on arterial-type roads where speeds were 40 mph or higher.
The danger is not shared equally. Older adults, disabled and low-income Americans are being killed at disproportionate rates. African-Americans, who walk for 50 percent more trips than whites, and Hispanic residents, who walk 40 percent more, are subjected to the least safe conditions and die disproportionately.
Aging in place, yet unable to leave the house on foot. An AARP poll of adults 50 years and older found that 40 percent reported inadequate sidewalks in their neighborhoods and nearly half of respondents reported that they could not safely cross the main roads close to their home.
| Rank | Metropolitan Area | 2007-08 Pedestrian
Danger Index |
|
| 1 | Orlando-Kissimmee, Fla. | 221.5 | |
| 2 | Tampa-St. Petersburg-Clearwater, Fla. | 205.5 | |
| 3 | Miami-Fort Lauderdale-Pompano Beach, Fla. | 181.2 | |
| 4 | Jacksonville, Fla. | 157.4 | |
| 5 | Memphis, Tenn.-Miss.-Ark. | 137.7 | |
| 6 | Raleigh-Cary, N.C. | 128.6 | |
| 7 | Louisville/Jefferson County, Ky.-Ind. | 114.8 | |
| 8 | Houston-Sugar Land-Baytown, Texas | 112.4 | |
| 8 | Birmingham-Hoover, Ala. | 110.0 | |
| 10 | Atlanta-Sandy Springs-Marietta, Ga. | 108.3 | |
| See the full rankings and download the report | |||
Driving down in 2008, congestion down much more
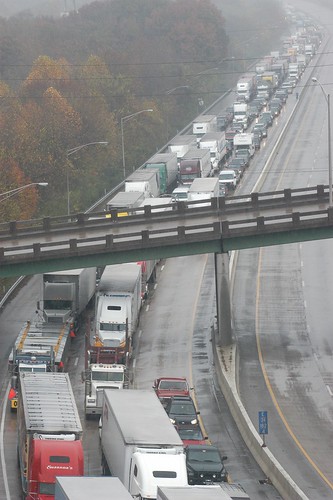 |
| Interstate 24 Traffic Originally uploaded by Transportation for America |
Due to the impact of high gas prices, the economic slowdown, and a growing preference for public transportation and other options for getting around, congestion was down in 2008 over 2007, marking the first two-year decrease in congestion since the Texas Transportation Institute began keeping track in 1982. Today, TTI released their bi-annual Urban Mobility Report today on the state of congestion and traffic in the U.S.
Some key findings:
Travelers spent one hour less stuck in traffic in 2007 than they did the year before and wasted one gallon less gasoline than the year before. The differences are small, but they represent a rare break in near-constant growth in traffic over 25 years.
- The overall cost (based on wasted fuel and lost productivity) reached $87.2 billion in 2007 — more than $750 for every U.S. traveler.
- The total amount of wasted fuel topped 2.8 billion gallons — three weeks’ worth of gas for every traveler.
- The amount of wasted time totaled 4.2 billion hours — nearly one full work week (or vacation week) for every traveler.
One cause of the decrease in congestion is the same cause responsible for the lower numbers of highway fatalities — Americans have been driving less and less. Vehicle miles traveled (VMT) growth rates have been in decline since 2005 and in 2007, total VMT and per capita VMT actually decreased for the first time since World War II. High gas prices and the recent economic downturn have contributed to these declines, but VMT was actually in decline well before the shock of increased gas prices and the recession, and has continued to fall even as gas prices plummeted over the last year.
And while total vehicle miles traveled (VMT) went down just slightly, congestion is down much more significantly.
According to Feburary numbers from INRIX, a reputable traffic statistics service, just a 3.7% drop in vehicle miles traveled in 2008 resulted in a 30% drop in congestion in our 100 most congested metro areas. That means each commuter spent 13 less hours stuck in traffic in 2008 over the previous year. And in slight contrast to the TTI report, the report found that overall, “99 of the top 100 most populated cities in the U.S. experienced decreases in traffic congestion levels in 2008 as compared to the prior year.” Small reductions in how much we drive each year have a much larger impact on congestion.
| The best way to reduce congestion and help Americans save money, time and fuel is to get smarter about managing traffic and offer increased options such as public transportation, telecommuting and incentives for carpooling, bicycling and walking. There is ample evidence that shows that reducing peak hour traffic by just a small percentage will dramatically reduce congestion and all of the costs associated with traffic.” |
| — James Corless, T4 America |
There’s no doubt that the sagging economy had a hand in reducing how much we drive. But regardless of the current economy, most Americans seem to be looking for ways to drive less — not more. So what if we invested more in the positive ways to reduce the amount we have to drive by making other options for getting around accessible, convenient, and available to more people?
With public transportation ridership still going up — even as driving is going down — it’s clear that people who have choices for getting around use them. People are looking for other convenient ways to travel that can get them out of traffic and save them time and money.
And as the INRIX numbers show, if we can make it easier to get around and increase the options for doing so, everyone behind the wheel benefits as congestion decreases. (And despite the decrease overall, the current $87 billion in congestion costs isn’t good news, by any stretch of the imagination.)
It’s unquestionable that the recession has had an impact, giving us some momentary slack in congestion. But what will we do with the breather? When the economy begins to pick back up again and people start driving more, will we head straight back into gridlock? With driving down and public transportation up, will we make more investments in the kinds of transportation options people are clamoring for, the kinds of options that can reduce congestion and make travel more painless for everyone?
Or will congestion simply mount as the economy rebounds?
How have states fared with the billions in transportation stimulus funds?
 You may recall that the $787 billion economic stimulus bill that passed in February had nearly $30 billion allocated for transportation investments. That money was given out to states and Metropolitan Planning Organizations (MPOs) — largely free of any criteria or requirements for what projects it should be spent on.
Smart Growth America released a report today examining how well states have been spending these billions. As they say on the Smart Growth America blog today, not only did the money arrive in a time of economic recession, but “at a time of embarrassingly large backlogs of road and bridge repairs, inadequate and underfunded public transportation systems, and too-few convenient, affordable transportation options.”
So after 120 days, how have states done in addressing these pressing needs and investing in progress for their communities?
After analyzing project descriptions provided by states and MPOs, Smart Growth America found forward looking states and communities that used the stimulus money as flexibly as possible, repairing roads and bridges and making the kinds of smart, 21st century transportation investments that their communities need to support strong economic growth.
Other states and communities missed this golden opportunity to create jobs while making progress on their most pressing transportation needs. These states spent their precious funds on building new roads rather than repairing existing roads, and ignored the chance to spend the money flexibly on the kinds of options that their residents really want — like public transportation or streets safe for walking and biking — leaving their communities stuck in traffic and stuck in the past.
…Despite the golden opportunity of extra funding, most states did not use the opportunity to make as much progress as possible on long-term goals. Even though repair backlogs can stretch years or decades into the future, nearly one-third of the money, $6.6 billion, went towards roadway new capacity projects. At a time when public transportation ridership is hitting all-time highs and the budget crunch is causing transit agencies to cut routes, service and jobs, an abysmal 2.8% was spent on public transportation. Only 0.9% percent was spent on non-motorized projects (i.e., bike and pedestrian projects).
Read more about the report and download the full version from Smart Growth America.
New policy paper: Transportation in small towns and rural regions
 |
| Check out the sixth in our ongoing series of policy briefs. These policy briefs are short, four-page, concise summaries of an issue with interesting facts and some clear recommendations for improvement through the federal transportation bill. Download this Brief (pdf) |
Smaller towns and rural communities face a different set of issues than urban or suburban America, and we need a transportation program that recognizes those differences, provides access for all people, and helps them succeed economically.
In our webinar two weeks ago, we talked about transportation challenges and solutions in smaller towns and rural areas, and we encourage you to download the accompanying policy brief on Transportation, Small Towns and Rural Communities.
As the policy brief makes clear, our current transportation program leaves rural communities stranded.
Providing access to jobs and the economy is critical for these rural areas and smaller towns. Unfortunately, since many of the decisions about how to invest in transportation are made at the state and federal level, local residents often have little say over how their transportation dollars are spent.
The 56 million residents of rural areas and small towns – about 20 percent of the population of the United States – often fall through the cracks of federal transportation policy.
These towns have higher concentrations of elderly and low-income citizens, who face unique challenges in accessing their jobs, school or civic life. In addition, children in rural areas are 25 percent more likely to be overweight or obese than those in urban areas and face unique barriers to being active and maintaining a healthy weight.
Consider five short facts from this brief:
|
Rural transportation connects people to jobs, health care, and family and contributes to regional economic growth by linking businesses to customers, goods to markets, and tourists to destinations. Research has shown that rural and small metropolitan transit services offer measurable economic benefits. In one study, rural counties with transit service were found to have 11 percent greater average net earnings growth over counties without transit, and the estimated annual impact of rural public transportation on the national economy was over $1.2 billion.
Bottom line? Our nation’s transportation infrastructure should provide access for all Americans, regardless of their geographic location, age, income, or disability status. We need to care for our existing transportation network, while ensuring that we build a 21st century system that will allow residents of rural communities, small cities, and small towns to thrive.
Check out the webinars page to listen to or watch a recording of our recent session on this topic.
Rep. Oberstar stuck in traffic, misses release of report on public transportation
 The Environmental Defense Fund held a news conference Thursday morning to release a new report profiling 10 innovative public transportation systems that are pushing beyond traditional ideas of transit, providing fast, clean and flexible service to help people get from A to B. Some special guests were invited, including transit supporter Rep. James Oberstar of Minnesota, who heads up the House committee responsible for writing the transportation bill this year.
So where was Rep. Oberstar when the press conference kicked off Thursday morning on Capitol Hill?
Stuck in gridlocked DC traffic, according to the Minneapolis Star-Tribune.
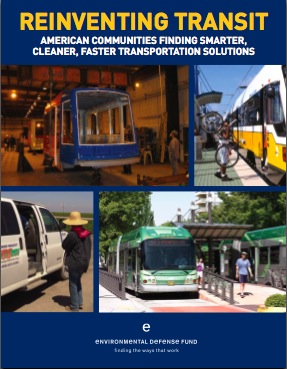
Once the strong sense of irony subsided, EDF carried on with the release of the report that profiles 11 systems from coast to coast that are “Reinventing Transit” by thinking outside the box to implement innovative service that can keep Americans moving.
Rep. Oberstar offered his strong support for the report in absentia.
Reinventing Transit makes the case that reinventing the transportation bill to fund transit innovations in Minnesota and nationwide will deliver new jobs, new connections to jobs and economic development for communities of all sizes. Given our economic and environmental challenges, ‘business as usual’ transportation investments are not good enough. Reinventing Transit sets the standard for transit investments in the upcoming transportation bill to fuel America’s economic recovery.
Read more quotes from the guests and EDF in their press release.
Five of the systems profiled in detailed case studies have accompanying videos. The systems profiled span from coast to coast, and cities from small to large.
One system not profiled is Washington’s own Metro, which keeps thousands of cars off the road each day, keeping that infamous DC traffic from being even worse. And Metro does have several stops near the Capitol. 🙂