
Laser focused on repairing our bridges

Despite advances in technology, the standard practice for evaluating a bridge’s maintenance needs is a visual inspection, just as it was a half-century ago. To address our nation’s huge backlog in structurally deficient bridges in a more accurate and fiscally responsible way, the federal government should evaluate and speed the adoption of available technologies.

For the past 50 years, trained technicians have inspected highway bridges every two years (or more frequently) to assess the need for repairs or replacement. But in the early 2000s, a review of this practice by the Federal Highway Administration found the process “subjective,” “widely variable,” and incapable of optimizing spending.

Like so many things in transportation—the lopsided funding for roads compared to transit, our use of vehicle speed as a proxy for access, or our focus on building new infrastructure instead of repairing what we have—the way we inspect bridges is stuck in the past, decades behind the needs of the country. Transportation for America believes that we need to make repair one of our national priorities, but to do that, we also need to rethink how we evaluate what most needs to be repaired, and when. Better information can help inform a fix-it-first policy. 

Fortunately, there are proven structural monitoring technologies commercially available today that can objectively assess which bridges must be replaced, which replacements can be safely deferred, and which might be able to continue functioning effectively with only minor repairs. This would allow state DOTs or local agencies to better target their repair dollars. But nationally, the norm is still subjective visual inspections.

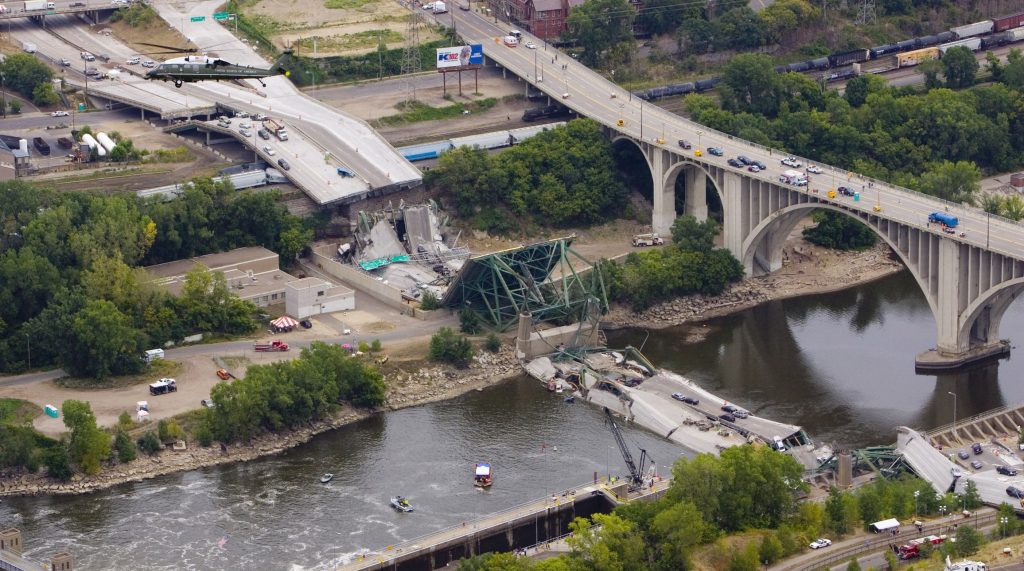
This is no small issue. There are over 50,000 bridges across the country that are considered structurally deficient today, according to the American Society of Civil Engineers. The rehabilitation & replacement cost for this problem is an estimated $123 billion. But using technologies that are available today could potentially shave billions off that price tag. A number of projects conducted by some transportation agencies have shown that using structural monitoring technology in lieu of relying solely on visual inspections to more precisely assess bridge conditions is highly effective and has saved hundreds of millions of dollars by avoiding unnecessary replacement projects. 

We believe that with the right policies and practices in place we can cut the national maintenance backlog in half. Part of the solution will be changing how we allocate resources, and part of the solution could be using the best available technology and data to evaluate the scale of the problem. But the federal government must lead this change for there to be widespread adoption of this technology.

The U.S. Department of Transportation should embark on an effort to evaluate the effectiveness of structural monitoring technologies to more objectively and accurately inspect bridges for safety. And Congress can be part of the solution by providing incentives and funding to spur their adoption.

Change is never easy, especially when it comes to transportation. There are decades of inertia within state departments of transportation which are already tasked with far more than their original mission of yesteryear (building the interstate highway system). But the interstate highway system is complete, the country has changed, and it’s time for U.S. DOT and state agencies to catch up. Facing deficits and uncertainty brought on by the pandemic, there has never been a better time to adopt new technologies that could yield large savings.

New report ranks worst counties in Oregon for aging bridges, finds state’s 439 structurally deficient bridges carry 1,000 vehicles every minute

Report comes as Oregon’s legislature considers new transportation funding in part to address precisely these types of ongoing repair and maintenance needs

OREGON – A new Transportation for America report analyzes the condition of Oregon’s bridges and finds that 439 are structurally deficient — requiring urgent repair, rehabilitation or replacement. These 439 bridges represent 5.5 percent of all Oregon bridges.

These bridges are located in areas urban and rural and serve as critical links in moving people to work and goods to market each day. In 2014, Oregon drivers took 1,000 trips per minute over these deficient bridges. Compared to other states, Oregon has done a better job keeping their bridges repaired, but 439 structurally deficient bridges is still far too many, and without continuing to prioritize and fund their repair, progress could slow or even reverse course.

Most bridges are designed with a 50-year lifespan, but these structurally deficient bridges are an average of 55 years old, 14 years older than the average age of all Oregon bridges. One in twelve bridges were built before 1948, which means that 680 bridges have been carrying traffic since before the Korean War and the creation of Medicare.

“Federal and state transportation funding simply hasn’t kept up due to declining gas tax revenues, inflation and improved vehicle fuel efficiency,” said T4America director James Corless. “With action by the legislature, Oregon could join a growing list of 
states — 20 and counting — that have raised their own transportation
 revenues since 2012. While increasing state funding is a good step, Congress needs 
to reward those efforts by fulfilling the 
historic federal role as a trusted partner in
transportation investment and passing a long-term transportation bill with stable, increased funding. Doing so would allow the State of Oregon and local officials to better address these sorts of ongoing maintenance needs.”

Oregon’s 2003 OTIA bond package prioritized the repair of the state’s busiest structurally deficient bridges, but now the bill is coming due for those bonds and is eating into yearly transportation budgets. Without new funding — and in light of Congress’ inability to pass a long-term transportation funding bill to support states like Oregon — the state will face more competition for fewer financial resources to address the state’s transportation needs.

“Even though the state of repair of our bridges is in relatively good shape in Washington County, we will see declines if we don’t increase revenue to address our backlog of maintenance needs,” said Andrew Singelakis, Washington County’s Director of Land Use and Transportation.

4,032 of the state’s 8,052 bridges are locally-maintained, and 7.2 percent of those locally-maintained bridges are structurally deficient — significantly higher than the state’s average rate of 5.5 percent for all bridges. And a staggering 66.5 percent (292 total) of Oregon’s 439 deficient bridges are maintained by local entities.

Though Oregon does direct a portion of state gas tax revenues to local governments — 30 percent to counties and 20 percent to cities — that money is flexible and with a range of pressing local needs, these local jurisdictions have to make difficult decisions with those funds, and they’re already feeling the squeeze.

“The average value of Wasco County’s yearly agricultural production is over $80 million dollars,” said Arthur Smith, Wasco County Public Works Director. “Most of the cherries, wheat and other products grown here are hauled on county roads, so any closures or load limits placed on county bridges can have a very significant impact. We laid-off 30 percent of our workforce in 2007 because of loss of forest receipts, and are now, more than ever, totally dependent on state and federal funding to fix our bridges. It’s vital that those structures remain in good shape.”

This report can be found online at https://t4america.org/maps-tools/bridges. That site includes an interactive map that allows one to map all bridges within a ten-mile radius of any U.S. address and see their condition and other vital statistics.

Contact:

Oregon: Chris Rall, 971-230-4745
NW Field Organizer
chris.rall@t4america.org

DC: Steve Davis, 202-971-3902
Deputy Communications Director steve.davis@t4america.org

New T4America report chronicles the prevalence of Minnesota’s structurally deficient bridges

As the Minnesota legislature debates legislation to increase transportation funding, T4America released a new report looking at the prevalence of structurally deficient bridges in the state. This report is a state-level version of “The Fix We’re In For,” a report we’ve issued several times since 2011, with updated 2015 statistics for Minnesota.

Minnesota today has 830 structurally deficient bridges — bridges in urgent need of repair or replacement — representing 6.4 percent of the state’s 12,961 bridges. The average age of these sub-par bridges is 66 years — well over the typical design life of 50 years and nearly double the average age of all Minnesota bridges (35 years old). More than one in ten Minnesota bridges were built before 1948 — which means more than 1,300 bridges are older than the Korean War and creation of Medicare. Minnesota drivers collectively took close to 628 million trips over deficient bridges in 2014. That’s more than 1.7 million trips per day or almost 1,200 trips every minute taken over deficient Minnesota bridges in 2014.

With the Minnesota legislature currently debating bills right now to increase state transportation funding, something that 19 states have successfully undertaken since 2012, it’s a good time to look at the problem and what can be done to address it — especially in light of the uncertainty surrounding federal transportation funding as Congress has repeatedly failed to find stable, long-term funding for the nearly insolvent Highway Trust Fund.

Download the report to see the full summary statistics, data broken up by county, and T4America’s recommendations for Minnesota and states around the country hoping to address their backlog of structurally deficient bridges.