Fueling the crisis: Overview
On November 15, 2021, President Joe Biden signed the bipartisan Infrastructure Investment and Jobs Act (IIJA) into law. The IIJA included a five-year transportation authorization for U.S. Department of Transportation (USDOT) programs, plus a standalone infrastructure law representing the largest-ever infusion ($643 billion over five years) of federal funding for surface transportation, including highways, roads, and bridges. The White House hailed the IIJA as “a once-in-a-generation investment in our nation’s infrastructure and competitiveness,” along with making lofty promises that it would “repair and rebuild our roads and bridges with a focus on climate change mitigation, resilience, equity, and safety for all users.”
Three years into this investment of infrastructure dollars, has that turned out to be the case? This is the question this report attempts to answer.
Approximately $200 billion of the IIJA’s $643 billion went into existing and brand new competitive grant programs, in which USDOT has the discretion to steer grants toward projects that lower emissions, improve access to opportunity, and advance other goals of the Biden administration. But the lion’s share of IIJA funding flows into what’s known as “formula” programs that are controlled by states and their departments of transportation, and they decide what to build, where, and how.1
“Unless these patterns change, we extrapolate that states’ federal formula-funded investments made over the course of the IIJA could cumulatively increase emissions by nearly 190 million metric tonnes of emissions over baseline levels through 2040 from added driving. This is the emission equivalent of 500 natural gas-fired power plants or nearly 50 coal-fired power plants running for a year.“
State DOT choices drive up emissions
Part of the good news three years ago was that the IIJA provided states with more flexibility and tools to fight emissions from transportation than ever before, which is one of the few sectors where emissions continue to grow despite other sectors of the economy decarbonizing.
Analysis from the Georgetown Climate Center (GCC) and the Rocky Mountain Institute (RMI) found that, depending on their spending choices, states could significantly influence transportation emissions. In a scenario analysis, they found that IIJA-funded projects could either reduce or increase millions of metric tonnes of CO2 equivalent (CO2e) greenhouse gas emissions through 2040 relative to baseline emissions projections, depending on the investment decisions made by the transportation agencies that control the funds.
The IIJA could “increase” emissions by millions of tonnes of CO2e because the aforementioned increased flexibility for states is a two-way street: Congress also preserved the states’ continued freedom and flexibility to use federal dollars to fund harmful, emission-intensive projects that enable more driving, like highway expansions, road widening, that require the demolition of homes and businesses to expand roads. And many of them have prioritized all of these things.
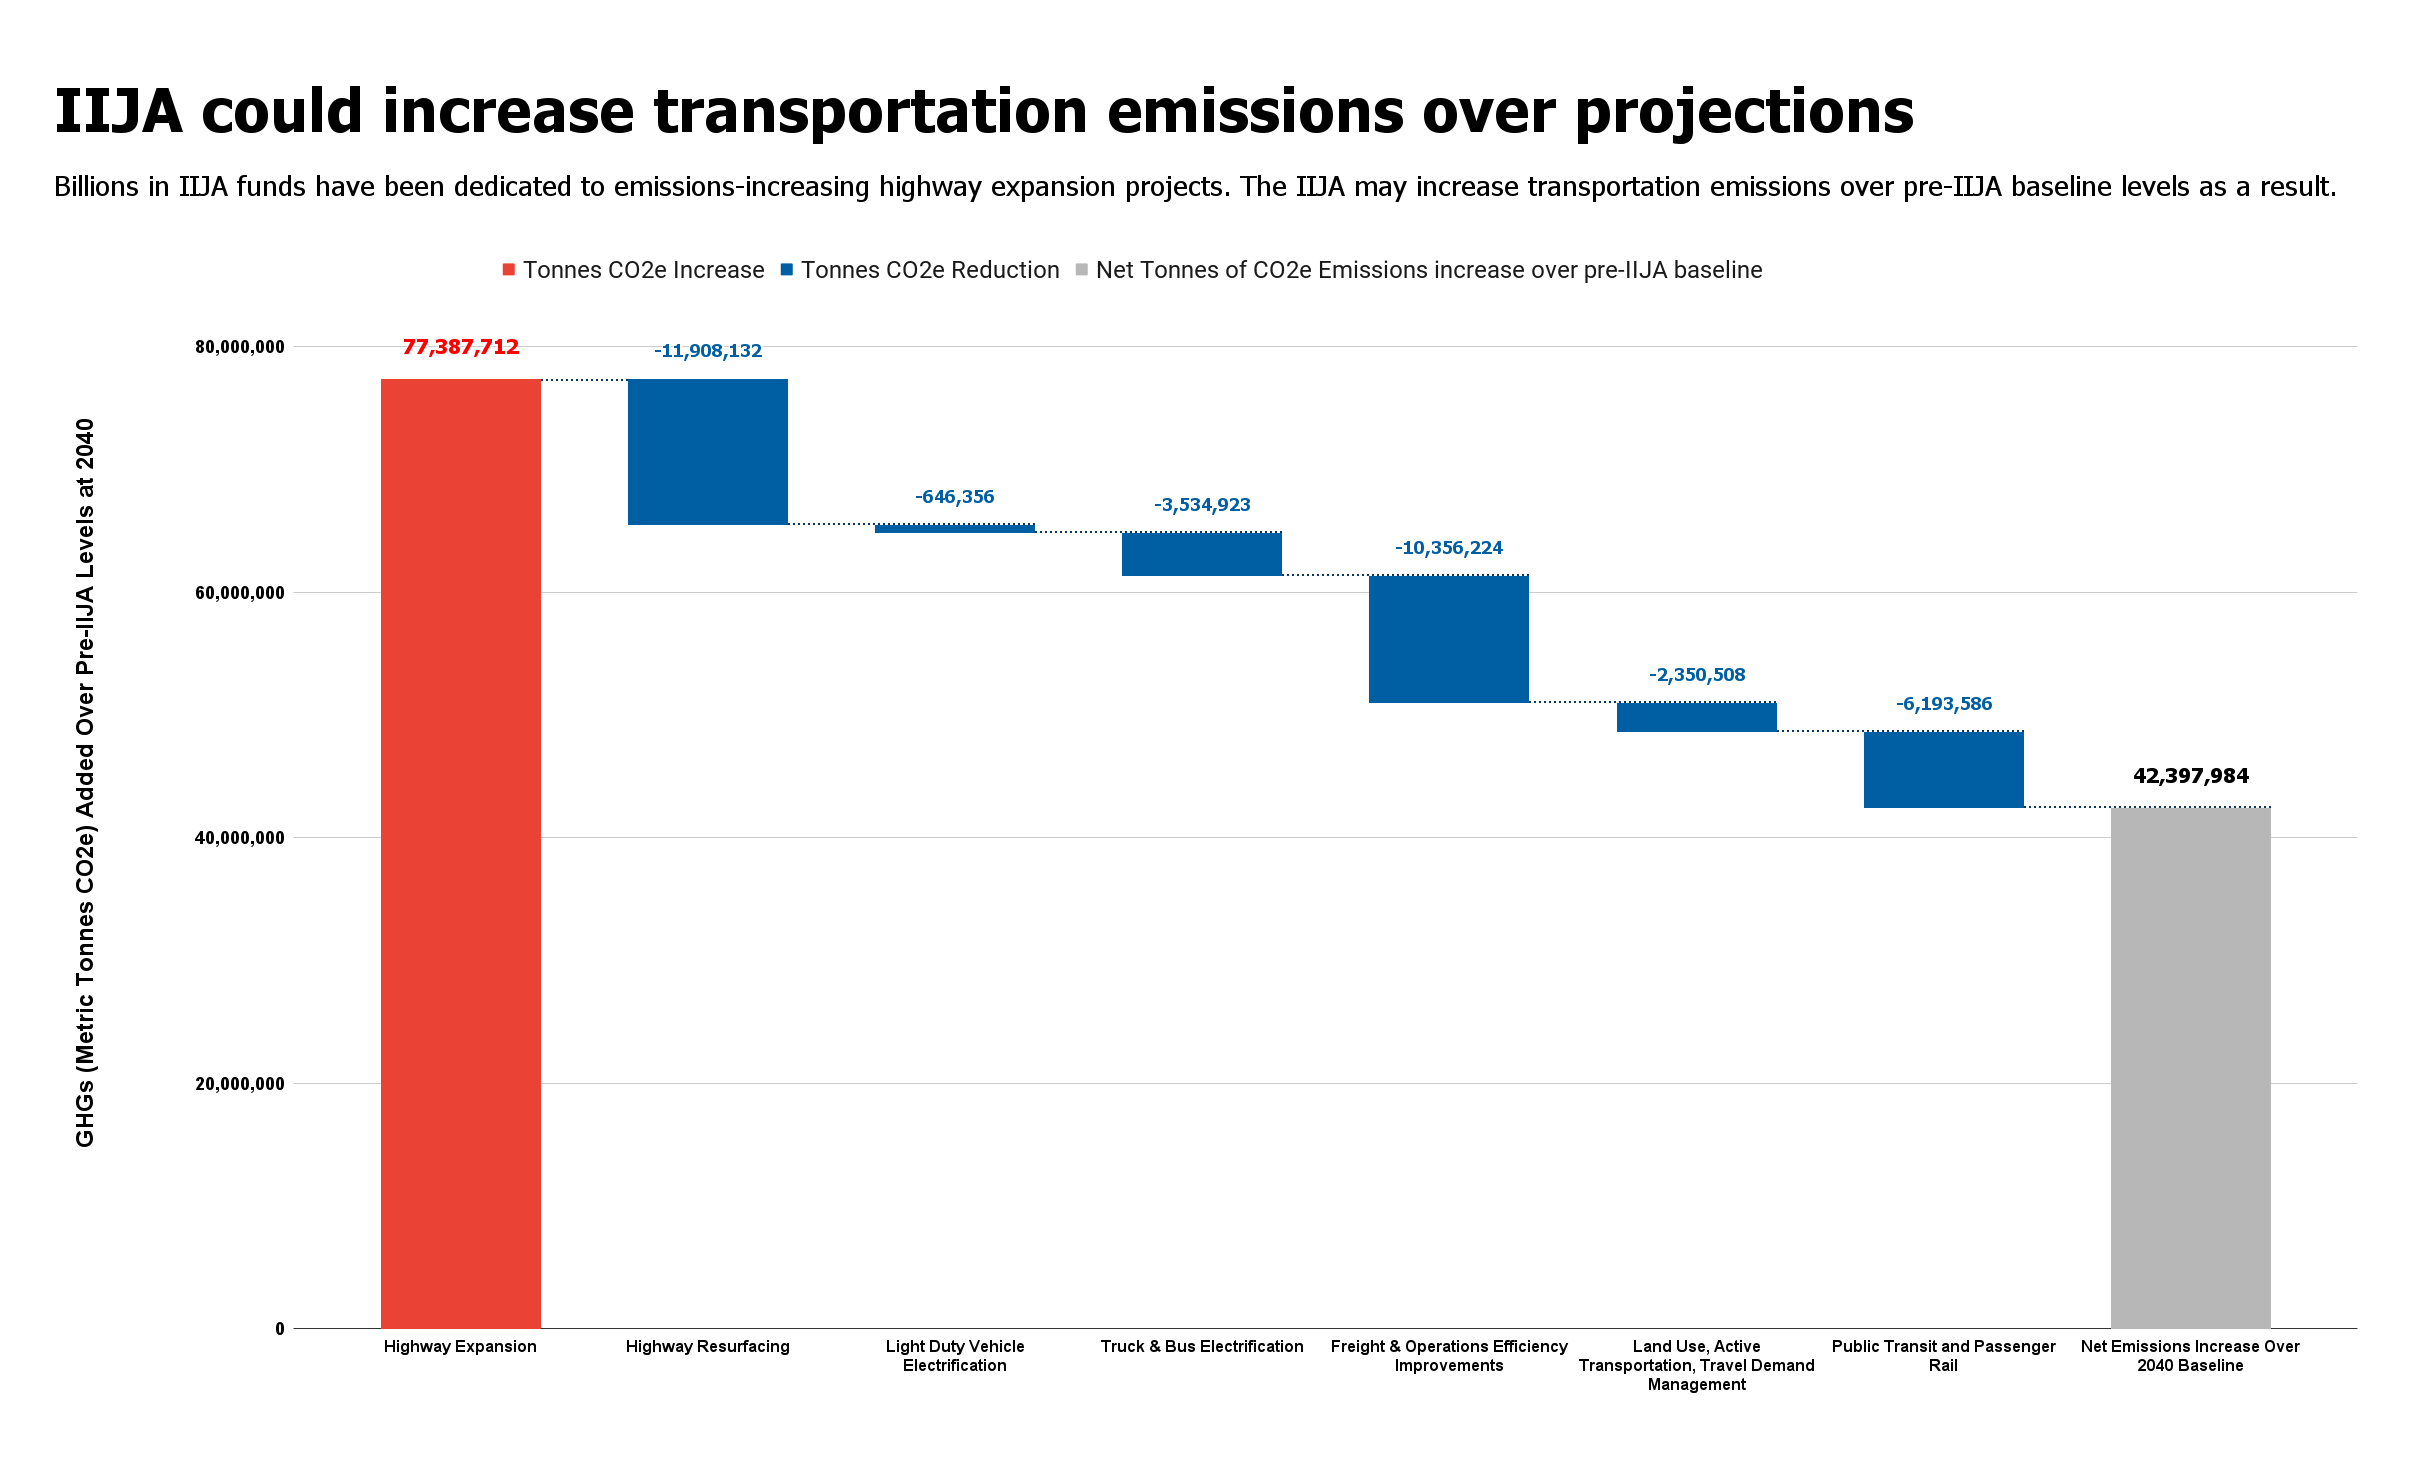
Overall, in the first portion of all IIJA spending available for analysis, policymakers, particularly state DOTs, spent over $37 billion on roadway expansion and highway widening projects that could generate the equivalent of more than 77 million additional metric tons of new CO2e emissions.
Three years in, is the IIJA helping or hurting the climate?
We are now past the halfway point of the IIJA, which will expire in the fall of 2026. For the purposes of this report, Transportation for America, assisted by new artificial intelligence tools, analyzed and individually categorized over 64,000 awards across dozens of grant programs logged to USASpending.gov as of June 4, 2024, comprising over $150 billion from the Federal Highway Administration, Federal Transit Administration, Federal Railroad Administration, and the Office of the Secretary of Transportation.2 Building off of research from the GCC’s Transportation Investment Strategy Tool, T4America was able to model the climate impacts of states’ investment of IIJA dollars so far. This allowed an in-depth look into how states have spent federal highway formula dollars, one of the largest chunks of transportation spending.
Of the $54.2 billion in National Highway Performance Program funds analyzed in this report, 42 percent of funding has been obligated to projects that expand road capacity and only 36 percent has gone to highway resurfacing projects. In the $35.6 billion analyzed from the Surface Transportation Block Grant—the most flexible formula program that allows states to fund almost any type of transportation project that advances their priorities—23 percent of funds have been spent on expanding roadways, but only 7 percent on projects to make walking and biking safer or more viable options. At the current rate, state DOTs’ usage of federal funds means we will end up falling short of meeting the $435 billion road maintenance deficit that was used to justify the IIJA’s pricetag at passage.
It’s useful to think of every new highway or new lane like a new fossil fuel power plant, guaranteeing emissions for years to come from the additional miles of driving each will induce. Over $37 billion in IIJA funding has gone toward new highways and wider roads. Using emissions increase and reduction output modeling figures from the GCC’s Transportation Investment Strategy Tool, these projects could induce the equivalent of more than 77 million cumulative metric tonnes of CO2e emissions above pre-IIJA baseline levels from 2022 and 2040. This is equivalent to the CO2e emissions produced from running 20 coal-fired power plants for a year.
These projects would undo the annual carbon reduction benefit of over 20,000 wind turbines in pursuit of a strategy (road widening) that has only produced more traffic and congestion in every single metro area in the nation. These spending choices, even by states that tend to say the right things about the climate, are directly undoing the emissions reduction impact of other climate focused investments and initiatives.
Investments in emissions reducing strategies, like transit, active transportation, system efficiency, and electrification are not nearly large enough to offset increased emissions from induced driving. Based on analyzed obligations in this dataset, only 35.3 millon cumulative tonnes of CO2e emissions will be decreased compared to baseline levels through 2040. Taking the emissions producing and emissions reducing impact of IIJA project investments altogether, the IIJA will cumulatively increase emissions by a net 42.2 million metric tonnes of CO2e greenhouse gases over baseline levels through 2040.
With about half of the IIJA’s funding remaining, if states continue spending these infrastructure dollars in ways that prioritize expansion over maintenance, safety, improving access to opportunity, or providing other options for travel, there will be dire consequences for the climate.
Unless these patterns change, we extrapolate that states’ federal formula-funded investments made over the course of the IIJA could cumulatively increase emissions by nearly 190 million metric tonnes of emissions over baseline levels through 2040 from added driving. This is the emission equivalent of 500 natural gas-fired power plants or nearly 50 coal-fired power plants running for a year.
Credits and Acknowledgements
Lead author: Corrigan Salerno, Policy Manager at Transportation for America
And for Transportation for America/Smart Growth America:
Abigail Araya
Eric Cova
Steve Davis
Chris McCahill
Beth Osborne
Benito Pérez
Chris Rall
With support from:
Miguel Moravec & Drew Veysey
Giancarlo Valdetaro
Robyn Marquis
Kevin Shen
Jeanie Ward-Waller
Zak Accuardi


