Data Hub
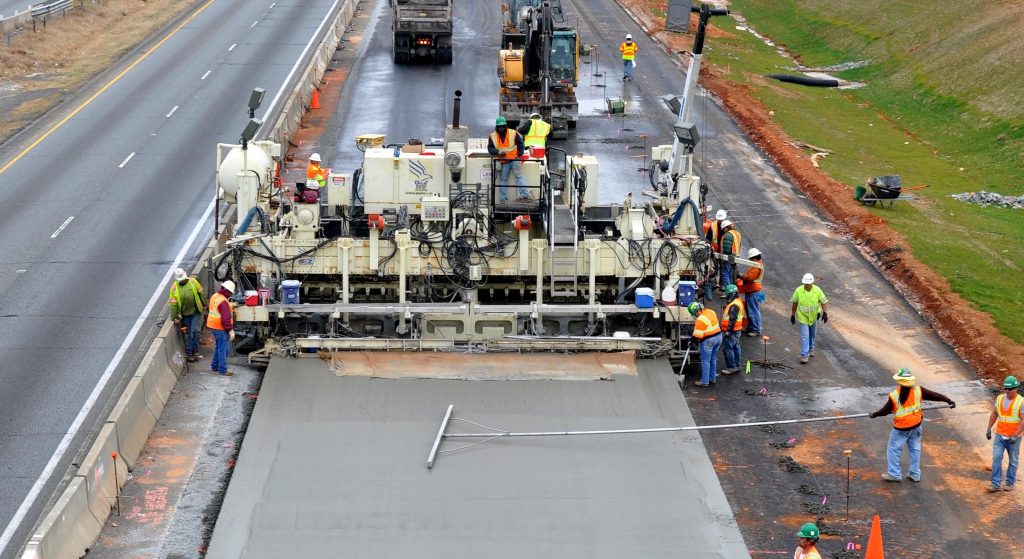
Repair and maintenanceThe never-ending pleas for ever larger amounts of federal transportation spending always lean on the same rhetoric of “fixing our crumbling roads and bridges," yet massive infusions of spending to date have failed to result in better roads and bridges. Why? One reason is because states are not required to maintain what they’ve built before building expensive new infrastructure.
Pavement condition index by state
Hover over any state for some brief facts on repair. Click on any state to see that state’s full data page, or use the dropdown selector.
If we’re not going to maintain what we have, why bother building anything new?
The Federal Highway Administration tracks the nation’s transportation system’s conditions and performance with data submitted by state DOTs. Unfortunately, much of that data is often hard to decipher, incomplete, or presented in opaque forms. This hub pulls together key pieces of national data on repair, spending, and priorities.
States are also required by Congress to track and set targets for the state of repair on their respective portions of the National Highway System (a relatively small portion of the roads in any state.) The roughly 47,000-mile Interstate System is included in the NHS’s 230,000 miles, but the NHS also includes tens of thousands of other state-owned roads, from two-lane rural highways up to most multi-lane urban and suburban arterials.
When it comes to these targets, states frequently set performance targets that are far worse than existing conditions, allowing them to claim victory even while conditions worsen. Or they simply set targets in line with however they seem to be performing. View the repair data below.
National spending on road expansion vs. repair
How much do states collectively spend on road maintenance vs. expansion each year? This table summarizes total capital spending for each year on road repair vs. road expansion, as reported to FHWA by category in the Highway Statistics Series. (Table SF-12A)
| State | Year | Total State Capital Outlay (SF-12A) | Total Safety/Other (SF-12A) | Total Road Expansion (SF-12A) | Total Road Maintenance (SF-12A) | Federal formula funding (FA-4) | NHS Pavement in good condition (%) | TGT_PavementInterstateGood | NHS Pavement in poor condition (%) | TGT_PavementInterstatePoor | PavementNonInterstateGood | TGT_PavementNonInterstateGood | Percent poor pavement condition (non-interstate NHS) | TGT_PavementNonInterstatePoor | Bridges in good condition (%) | TGT_BridgeGoodMeasure | Bridges in poor condition (%) | TGT_BridgePoorMeasure |
|---|---|---|---|---|---|---|---|---|---|---|---|---|---|---|---|---|---|---|
| National | 2017 | 73.50 | 3.60 | 46.8 | 7.70 | |||||||||||||
| National | 2018 | 86.74 | 30.5 | 20.96 | 30.34 | 74.30 | 3.50 | 46 | 7.60 | |||||||||
| National | 2019 | 84.85 | 32.2 | 20.07 | 32.61 | 62.60 | 10.30 | 45.3 | 7.50 | |||||||||
| National | 2020 | 91.56 | 34.7 | 22.76 | 34.10 | 63.00 | 10.40 | 45 | 7.30 | |||||||||
| National | 2021 | 90.10 | 35.7 | 20.74 | 33.63 | 44.9 | 7.00 | |||||||||||
| National | 2022 | 89.36 | 36.2 | 20.94 | 32.24 | 64.10 | 3.20 | 44.5 | 6.90 | |||||||||
| National | 2023 | 44.3 | 6.80 | |||||||||||||||
| National | 2024 | 44.1 | 6.80 | |||||||||||||||
| National | 2025 | |||||||||||||||||
Click on any item in the legend to show or hide that column or line. To zoom in on an area, click and drag your cursor over that area. To download the chart, view the underlying data, or see it in full-screen mode, click the menu icon in the top right.
Click on any item in the legend to show or hide that column or line. To zoom in on an area, click and drag your cursor over that area. To download the chart, view the underlying data, or see it in full-screen mode, click the menu icon in the top right.
Click on any item in the legend to show or hide that column or line. To zoom in on an area, click and drag your cursor over that area. To download the chart, view the underlying data, or see it in full-screen mode, click the menu icon in the top right.
| State | Year | All NHS roads in good condition | All NHS roads in poor condition | All bridges in good condition | All bridges in poor condition | PavementInterstateGood | TGT_PavementInterstateGood | Percent poor pavement condition (interstate) | TGT_PavementInterstatePoor | PavementNonInterstateGood | TGT_PavementNonInterstateGood | Percent poor pavement condition (non-interstate NHS) | TGT_PavementNonInterstatePoor | BridgeGoodMeasure | TGT_BridgeGoodMeasure | Percent poor condition bridges | TGT_BridgePoorMeasure | post_id |
|---|---|---|---|---|---|---|---|---|---|---|---|---|---|---|---|---|---|---|
| Alabama | 2017 | 86.08 | 1.45 | 27.20 | 2.00 | 35992 | ||||||||||||
| Alabama | 2018 | 88.62 | 1.48 | 42.39 | 4.27 | 73.8 | 1.2 | 26.90 | 2.00 | 35992 | ||||||||
| Alabama | 2019 | 83.34 | 3.98 | 41.70 | 4.05 | 72.2 | 0.8 | 41.50 | 40 | 2.60 | 5 | 27.80 | 27 | 0.70 | 3 | 35992 | ||
| Alabama | 2020 | 83.45 | 2.88 | 41.41 | 3.84 | 73.4 | 1.1 | 37.40 | 2.60 | 27.00 | 0.70 | 35992 | ||||||
| Alabama | 2021 | 40.52 | 3.63 | 71.8 | 50.0 | 1.2 | 5.0 | 36.90 | 2.60 | 5 | 27.30 | 27 | 0.50 | 3 | 35992 | |||
| Alabama | 2022 | 83.07 | 1.26 | 39.70 | 3.56 | 72.0 | 1.1 | 37.30 | 2.80 | 26.80 | 0.50 | 35992 | ||||||
| Alabama | 2023 | 38.17 | 3.46 | 50.0 | 5.0 | 25 | 5 | 25 | 3 | 35992 | ||||||||
| Alabama | 2024 | 36.98 | 3.35 | 35992 | ||||||||||||||
| Alabama | 2025 | 50.0 | 5.0 | 25 | 5 | 25 | 3 | 35992 | ||||||||||
| Alaska | 2017 | 46.02 | 20.49 | 39.40 | 6.40 | 35994 | ||||||||||||
| Alaska | 2018 | 45.92 | 20.83 | 44.66 | 9.74 | 32.8 | 1.4 | 39.00 | 6.50 | 35994 | ||||||||
| Alaska | 2019 | 52.73 | 14.42 | 44.26 | 9.09 | 32.4 | 0.7 | 23.00 | 15 | 7.00 | 15 | 33.50 | 40 | 5.80 | 10 | 35994 | ||
| Alaska | 2020 | 52.36 | 14.89 | 43.40 | 8.57 | 34.3 | 0.9 | 25.80 | 6.50 | 34.10 | 5.70 | 35994 | ||||||
| Alaska | 2021 | 43.87 | 8.21 | 30.1 | 20.0 | 0.9 | 10.0 | 25.40 | 7.60 | 15 | 36.10 | 40 | 5.80 | 10 | 35994 | |||
| Alaska | 2022 | 55.27 | 9.96 | 45.45 | 7.75 | 31.3 | 0.9 | 29.10 | 6.20 | 37.70 | 6.90 | 35994 | ||||||
| Alaska | 2023 | 44.78 | 8.12 | 20.0 | 5.0 | 15 | 10 | 40 | 10 | 35994 | ||||||||
| Alaska | 2024 | 45.58 | 7.89 | 35994 | ||||||||||||||
| Alaska | 2025 | 20.0 | 5.0 | 15 | 10 | 40 | 10 | 35994 | ||||||||||
| Arizona | 2017 | 76.25 | 3.05 | 56.50 | 1.10 | 35996 | ||||||||||||
| Arizona | 2018 | 74.07 | 3.64 | 61.10 | 1.81 | 53.1 | 0.9 | 57.00 | 1.00 | 35996 | ||||||||
| Arizona | 2019 | 66.85 | 6.55 | 61.27 | 1.65 | 47.0 | 1.1 | 32.30 | 31 | 2.80 | 6 | 57.80 | 52 | 1.20 | 4 | 35996 | ||
| Arizona | 2020 | 64.59 | 7.08 | 61.84 | 1.57 | 50.8 | 0.9 | 32.30 | 2.00 | 57.00 | 1.00 | 35996 | ||||||
| Arizona | 2021 | 62.30 | 1.38 | 50.3 | 44.0 | 0.9 | 2.0 | 32.90 | 2.50 | 6 | 57.90 | 52 | 0.90 | 4 | 35996 | |||
| Arizona | 2022 | 64.50 | 2.21 | 62.78 | 1.26 | 51.2 | 1.5 | 30.80 | 4.60 | 58.40 | 0.90 | 35996 | ||||||
| Arizona | 2023 | 63.55 | 1.11 | 44.0 | 2.0 | 28 | 6 | 52 | 4 | 35996 | ||||||||
| Arizona | 2024 | 63.46 | 1.15 | 35996 | ||||||||||||||
| Arizona | 2025 | 44.0 | 2.0 | 28 | 6 | 52 | 4 | 35996 | ||||||||||
| Arkansas | 2017 | 60.01 | 5.94 | 50.30 | 3.90 | 35998 | ||||||||||||
| Arkansas | 2018 | 66.47 | 4.33 | 52.87 | 4.56 | 75.5 | 0.8 | 45.50 | 3.20 | 35998 | ||||||||
| Arkansas | 2019 | 61.69 | 6.98 | 51.14 | 4.85 | 67.2 | 0.3 | 48 | 10 | 44.50 | 50 | 3.60 | 4 | 35998 | ||||
| Arkansas | 2020 | 60.45 | 8.44 | 49.37 | 5.12 | 64.4 | 0.8 | 58.60 | 42.90 | 42.90 | 3.30 | 35998 | ||||||
| Arkansas | 2021 | 48.17 | 5.25 | 65.2 | 72.0 | 1.3 | 5.0 | 7 | 43.60 | 42 | 3.50 | 6 | 35998 | |||||
| Arkansas | 2022 | 66.03 | 1.90 | 47.36 | 5.20 | 69.1 | 1.2 | 35.10 | 5.20 | 44.80 | 3.10 | 35998 | ||||||
| Arkansas | 2023 | 46.61 | 5.38 | 54.0 | 5.0 | 41 | 4 | 39 | 6 | 35998 | ||||||||
| Arkansas | 2024 | 45.78 | 5.43 | 35998 | ||||||||||||||
| Arkansas | 2025 | 48.0 | 5.0 | 45 | 4 | 40 | 8 | 35998 | ||||||||||
| California | 2017 | 67.29 | 5.43 | 61.70 | 6.10 | 36000 | ||||||||||||
| California | 2018 | 71.05 | 4.07 | 57.42 | 7.04 | 49.0 | 2.1 | 57.40 | 6.90 | 36000 | ||||||||
| California | 2019 | 41.50 | 26.58 | 53.19 | 6.97 | 47.9 | 1.9 | 23.80 | 28 | 9.90 | 7 | 52.00 | 69 | 6.20 | 4 | 36000 | ||
| California | 2020 | 38.40 | 29.72 | 50.06 | 5.96 | 44.8 | 2.3 | 24.40 | 7.50 | 48.00 | 5.70 | 36000 | ||||||
| California | 2021 | 47.50 | 5.80 | 47.2 | 44.5 | 2.2 | 3.8 | 23.80 | 6.80 | 7 | 46.90 | 70 | 6.20 | 4 | 36000 | |||
| California | 2022 | 38.72 | 2.51 | 46.85 | 5.99 | 47.5 | 2.0 | 24.10 | 7.00 | 45.20 | 6.80 | 36000 | ||||||
| California | 2023 | 46.12 | 6.16 | 47.2 | 1.9 | 21 | 10 | 49 | 5 | 36000 | ||||||||
| California | 2024 | 45.64 | 5.91 | 36000 | ||||||||||||||
| California | 2025 | 49.2 | 1.7 | 28 | 9 | 47 | 4 | 36000 | ||||||||||
| Colorado | 2017 | 62.84 | 4.47 | 47.20 | 3.80 | 36002 | ||||||||||||
| Colorado | 2018 | 67.00 | 4.22 | 42.04 | 5.38 | 44.2 | 2.5 | 46.40 | 6.10 | 36002 | ||||||||
| Colorado | 2019 | 57.25 | 9.31 | 40.41 | 5.30 | 46.5 | 2.7 | 41.50 | 50 | 3.10 | 1 | 42.50 | 44 | 5.90 | 4 | 36002 | ||
| Colorado | 2020 | 56.28 | 9.78 | 37.12 | 5.45 | 46.3 | 3.9 | 41.70 | 3.30 | 37.40 | 5.50 | 36002 | ||||||
| Colorado | 2021 | 34.54 | 5.29 | 43.5 | 40.0 | 3.9 | 5.0 | 39.30 | 3.10 | 5 | 38.20 | 44 | 3.40 | 4 | 36002 | |||
| Colorado | 2022 | 55.20 | 2.85 | 34.27 | 5.07 | 42.9 | 3.2 | 41.60 | 3.20 | 36.60 | 3.70 | 36002 | ||||||
| Colorado | 2023 | 35.15 | 4.88 | 45.0 | 4.0 | 42 | 3 | 36 | 4 | 36002 | ||||||||
| Colorado | 2024 | 35.66 | 4.82 | 36002 | ||||||||||||||
| Colorado | 2025 | 47.0 | 3.5 | 43 | 3 | 36 | 4 | 36002 | ||||||||||
| Connecticut | 2017 | 58.29 | 4.81 | 15.20 | 14.00 | 36004 | ||||||||||||
| Connecticut | 2018 | 60.43 | 5.35 | 28.99 | 7.21 | 75.4 | 0.5 | 14.70 | 11.60 | 36004 | ||||||||
| Connecticut | 2019 | 50.31 | 13.89 | 28.97 | 6.34 | 74.2 | 0.1 | 37.20 | 36 | 3.60 | 6 | 14.40 | 22 | 8.20 | 7 | 36004 | ||
| Connecticut | 2020 | 52.45 | 12.37 | 28.64 | 5.69 | 76.6 | 0.2 | 39.60 | 2.10 | 14.20 | 8.10 | 36004 | ||||||
| Connecticut | 2021 | 28.64 | 5.30 | 68.6 | 70.0 | 0.2 | 2.5 | 37.90 | 1.80 | 5 | 14.10 | 14 | 7.70 | 8 | 36004 | |||
| Connecticut | 2022 | 52.87 | 0.97 | 28.78 | 5.17 | 73.3 | 0.1 | 39.50 | 2.60 | 13.50 | 7.40 | 36004 | ||||||
| Connecticut | 2023 | 28.31 | 5.02 | 72.0 | 1.0 | 37 | 2 | 14 | 6 | 36004 | ||||||||
| Connecticut | 2024 | 27.79 | 4.72 | 36004 | ||||||||||||||
| Connecticut | 2025 | 70.0 | 1.3 | 35 | 3 | 14 | 6 | 36004 | ||||||||||
| Delaware | 2017 | 81.75 | 0.79 | 13.40 | 6.10 | 36006 | ||||||||||||
| Delaware | 2018 | 77.60 | 1.60 | 22.60 | 3.94 | 52.0 | 0.7 | 18.00 | 5.60 | 36006 | ||||||||
| Delaware | 2019 | 60.61 | 7.69 | 28.21 | 3.19 | 55.8 | 0.3 | 55.00 | 55 | 1.60 | 2 | 18.70 | 13 | 2.70 | 4 | 36006 | ||
| Delaware | 2020 | 65.21 | 7.37 | 31.97 | 2.15 | 63.3 | 0.7 | 57.10 | 1.10 | 19.60 | 2.70 | 36006 | ||||||
| Delaware | 2021 | 33.26 | 1.94 | 50.0 | 2.0 | 47.70 | 0.70 | 2 | 21.90 | 18 | 2.70 | 3 | 36006 | |||||
| Delaware | 2022 | 62.67 | 1.84 | 36.70 | 1.61 | 63.9 | 0.9 | 54.40 | 0.90 | 22.30 | 2.70 | 36006 | ||||||
| Delaware | 2023 | 36.96 | 1.26 | 50.0 | 5.0 | 40 | 2 | 15 | 3 | 36006 | ||||||||
| Delaware | 2024 | 40.48 | 1.26 | 36006 | ||||||||||||||
| Delaware | 2025 | 50.0 | 5.0 | 40 | 2 | 25 | 3 | 36006 | ||||||||||
| District of Columbia | 2017 | 0.00 | 0.00 | 11.10 | 4.90 | 36092 | ||||||||||||
| District of Columbia | 2018 | 0.00 | 0.00 | 25.41 | 3.28 | 10.90 | 12.10 | 36092 | ||||||||||
| District of Columbia | 2019 | 2.29 | 82.44 | 24.59 | 4.10 | 8.2 | 7.7 | 67 | 7 | 11.90 | 15 | 11.90 | 8 | 36092 | ||||
| District of Columbia | 2020 | 6.02 | 78.95 | 27.57 | 3.29 | 23.6 | 1.5 | 1.90 | 16.30 | 16.30 | 7.60 | 36092 | ||||||
| District of Columbia | 2021 | 30.08 | 2.85 | 12.7 | 5.0 | 3.5 | 5.0 | 14 | 16.10 | 24 | 7.50 | 4 | 36092 | |||||
| District of Columbia | 2022 | 2.26 | 4.51 | 31.45 | 1.61 | 18.8 | 1.6 | 0.70 | 15.40 | 24.90 | 7.20 | 36092 | ||||||
| District of Columbia | 2023 | 34.13 | 1.59 | 20.0 | 5.0 | 2 | 15 | 22 | 7 | 36092 | ||||||||
| District of Columbia | 2024 | 34.63 | 1.95 | 36092 | ||||||||||||||
| District of Columbia | 2025 | 25.0 | 5.0 | 5 | 10 | 24 | 7 | 36092 | ||||||||||
| Florida | 2017 | 89.11 | 0.42 | 67.70 | 1.20 | 36008 | ||||||||||||
| Florida | 2018 | 87.83 | 0.63 | 67.46 | 2.64 | 54.2 | 0.6 | 66.60 | 1.20 | 36008 | ||||||||
| Florida | 2019 | 77.52 | 3.58 | 66.14 | 2.88 | 68.0 | 0.5 | 41.00 | 40 | 0.30 | 5 | 65.60 | 50 | 0.50 | 10 | 36008 | ||
| Florida | 2020 | 77.57 | 3.39 | 64.87 | 3.24 | 68.8 | 0.6 | 64.10 | 1.40 | 36008 | ||||||||
| Florida | 2021 | 63.50 | 3.62 | 70.5 | 60.0 | 0.7 | 5.0 | 47.50 | 1.10 | 5 | 61.30 | 50 | 0.50 | 10 | 36008 | |||
| Florida | 2022 | 76.02 | 0.20 | 61.78 | 3.57 | 73.2 | 0.5 | 48.80 | 1.20 | 57.70 | 0.60 | 36008 | ||||||
| Florida | 2023 | 60.33 | 3.49 | 60.0 | 5.0 | 40 | 5 | 50 | 10 | 36008 | ||||||||
| Florida | 2024 | 59.55 | 2.79 | 36008 | ||||||||||||||
| Florida | 2025 | 60.0 | 5.0 | 40 | 5 | 50 | 10 | 36008 | ||||||||||
| Georgia | 2017 | 74.61 | 1.73 | 47.30 | 1.10 | 36010 | ||||||||||||
| Georgia | 2018 | 79.07 | 1.50 | 42.36 | 3.32 | 64.1 | 0.2 | 51.50 | 1.10 | 36010 | ||||||||
| Georgia | 2019 | 75.47 | 3.04 | 45.49 | 2.95 | 57.0 | 0.3 | 46.50 | 40 | 0.80 | 12 | 67.50 | 50 | 0.80 | 10 | 36010 | ||
| Georgia | 2020 | 77.36 | 3.14 | 62.00 | 2.50 | 59.4 | 0.2 | 44.20 | 0.80 | 78.50 | 0.60 | 36010 | ||||||
| Georgia | 2021 | 73.76 | 2.13 | 67.4 | 50.0 | 0.1 | 5.0 | 49.20 | 0.60 | 12 | 79.10 | 60 | 0.50 | 10 | 36010 | |||
| Georgia | 2022 | 77.03 | 0.39 | 74.76 | 1.95 | 75.6 | 0.1 | 51.20 | 0.70 | 79.90 | 0.70 | 36010 | ||||||
| Georgia | 2023 | 75.45 | 1.59 | 50.0 | 5.0 | 40 | 12 | 50 | 10 | 36010 | ||||||||
| Georgia | 2024 | 74.84 | 1.59 | 36010 | ||||||||||||||
| Georgia | 2025 | 50.0 | 5.0 | 40 | 12 | 60 | 10 | 36010 | ||||||||||
| Hawaii | 2017 | 28.75 | 22.50 | 25.30 | 1.80 | 36012 | ||||||||||||
| Hawaii | 2018 | 26.25 | 20.00 | 31.22 | 6.86 | 20.6 | 2.8 | 23.90 | 2.00 | 36012 | ||||||||
| Hawaii | 2019 | 24.67 | 31.06 | 26.10 | 7.03 | 19.2 | 4.8 | 20.40 | 15 | 4.40 | 4 | 19.30 | 20 | 2.30 | 2 | 36012 | ||
| Hawaii | 2020 | 28.31 | 24.49 | 21.34 | 7.29 | 17.2 | 4.9 | 26.10 | 2.80 | 19.40 | 2.30 | 36012 | ||||||
| Hawaii | 2021 | 22.81 | 7.49 | 18.3 | 7.0 | 3.9 | 4.0 | 26.40 | 3.80 | 4 | 25.50 | 20 | 1.90 | 2 | 36012 | |||
| Hawaii | 2022 | 32.13 | 4.94 | 24.13 | 6.29 | 14.7 | 4.0 | 27.90 | 4.00 | 30.00 | 2.20 | 36012 | ||||||
| Hawaii | 2023 | 29.41 | 6.72 | 25.0 | 4.0 | 25 | 4 | 25 | 4 | 36012 | ||||||||
| Hawaii | 2024 | 37.24 | 6.53 | 36012 | ||||||||||||||
| Hawaii | 2025 | 30.0 | 4.0 | 30 | 4 | 30 | 4 | 36012 | ||||||||||
| Idaho | 2017 | 77.35 | 2.15 | 18.70 | 2.30 | 36014 | ||||||||||||
| Idaho | 2018 | 78.88 | 1.73 | 28.09 | 7.03 | 65.6 | 0.2 | 18.80 | 3.20 | 36014 | ||||||||
| Idaho | 2019 | 78.28 | 3.13 | 28.53 | 6.57 | 61.1 | 0.5 | 50 | 8 | 18.00 | 19 | 4.00 | 3 | 36014 | ||||
| Idaho | 2020 | 78.68 | 5.47 | 29.01 | 6.32 | 60.0 | 0.4 | 46.30 | 0.80 | 18.80 | 2.40 | 36014 | ||||||
| Idaho | 2021 | 28.98 | 5.22 | 57.8 | 50.0 | 0.3 | 4.0 | 40.30 | 0.70 | 8 | 21.00 | 19 | 3.70 | 3 | 36014 | |||
| Idaho | 2022 | 77.20 | 0.47 | 28.72 | 5.11 | 56.2 | 0.2 | 39.00 | 0.70 | 22.30 | 2.30 | 36014 | ||||||
| Idaho | 2023 | 28.88 | 5.12 | 35.0 | 4.0 | 20 | 8 | 19 | 3 | 36014 | ||||||||
| Idaho | 2024 | 29.53 | 4.90 | 36014 | ||||||||||||||
| Idaho | 2025 | 35.0 | 4.0 | 20 | 8 | 19 | 3 | 36014 | ||||||||||
| Illinois | 2017 | 67.54 | 3.77 | 29.10 | 11.60 | 36016 | ||||||||||||
| Illinois | 2018 | 67.87 | 4.80 | 50.12 | 8.48 | 63.8 | 0.4 | 28.10 | 13.70 | 36016 | ||||||||
| Illinois | 2019 | 51.90 | 13.94 | 48.78 | 8.97 | 61.1 | 0.7 | 24.30 | 27 | 8.60 | 6 | 26.20 | 28 | 13.30 | 13 | 36016 | ||
| Illinois | 2020 | 53.34 | 13.77 | 48.39 | 8.84 | 64.0 | 0.6 | 25.60 | 9.40 | 23.70 | 13.30 | 36016 | ||||||
| Illinois | 2021 | 47.86 | 8.96 | 65.7 | 61.0 | 0.4 | 2.0 | 29.50 | 8.00 | 9 | 22.80 | 23 | 12.40 | 15 | 36016 | |||
| Illinois | 2022 | 55.61 | 1.65 | 47.44 | 9.02 | 64.0 | 0.4 | 29.90 | 7.80 | 22.90 | 11.10 | 36016 | ||||||
| Illinois | 2023 | 46.44 | 9.20 | 65.0 | 1.0 | 29 | 8 | 18 | 12 | 36016 | ||||||||
| Illinois | 2024 | 45.64 | 9.35 | 36016 | ||||||||||||||
| Illinois | 2025 | 66.0 | 0.7 | 30 | 8 | 15 | 12 | 36016 | ||||||||||
| Indiana | 2017 | 75.50 | 3.60 | 50.00 | 2.30 | 36018 | ||||||||||||
| Indiana | 2018 | 74.30 | 4.36 | 41.28 | 6.24 | 67.3 | 0.2 | 49.70 | 2.00 | 36018 | ||||||||
| Indiana | 2019 | 66.14 | 4.58 | 40.93 | 6.05 | 56.5 | 0.5 | 44.80 | 78 | 0.90 | 3 | 48.00 | 48 | 2.60 | 2 | 36018 | ||
| Indiana | 2020 | 76.95 | 3.25 | 40.76 | 5.75 | 69.9 | 0.3 | 54.40 | 0.70 | 49.70 | 1.90 | 36018 | ||||||
| Indiana | 2021 | 40.68 | 5.60 | 73.2 | 50.0 | 0.4 | 0.8 | 3 | 50.60 | 47 | 2.30 | 3 | 36018 | |||||
| Indiana | 2022 | 79.77 | 1.63 | 40.87 | 5.37 | 71.0 | 0.4 | 55.50 | 0.70 | 52.40 | 2.20 | 36018 | ||||||
| Indiana | 2023 | 41.44 | 5.25 | 60.0 | 1.0 | 50 | 1 | 49 | 3 | 36018 | ||||||||
| Indiana | 2024 | 42.19 | 5.22 | 36018 | ||||||||||||||
| Indiana | 2025 | 62.0 | 1.0 | 48 | 1 | 47 | 3 | 36018 | ||||||||||
| Iowa | 2017 | 61.02 | 6.59 | 48.90 | 2.30 | 36020 | ||||||||||||
| Iowa | 2018 | 63.81 | 6.49 | 38.05 | 19.38 | 67.5 | 0.4 | 48.90 | 2.30 | 36020 | ||||||||
| Iowa | 2019 | 60.79 | 8.07 | 38.76 | 19.03 | 66.1 | 0.4 | 48 | 13 | 48.70 | 45 | 2.20 | 3 | 36020 | ||||
| Iowa | 2020 | 58.83 | 8.96 | 38.80 | 19.06 | 59.3 | 0.5 | 54.00 | 50.20 | 50.20 | 2.40 | 36020 | ||||||
| Iowa | 2021 | 39.19 | 18.87 | 58.8 | 49.4 | 0.4 | 2.7 | 14 | 49.40 | 44 | 2.40 | 3 | 36020 | |||||
| Iowa | 2022 | 59.34 | 0.59 | 39.10 | 19.32 | 60.1 | 0.3 | 37.80 | 3.80 | 47.90 | 2.10 | 36020 | ||||||
| Iowa | 2023 | 38.97 | 19.22 | 55.0 | 3.0 | 35 | 6 | 52 | 5 | 36020 | ||||||||
| Iowa | 2024 | 38.84 | 19.16 | 36020 | ||||||||||||||
| Iowa | 2025 | 55.0 | 3.0 | 35 | 6 | 56 | 6 | 36020 | ||||||||||
| Kansas | 2017 | 89.32 | 0.96 | 74.80 | 1.50 | 36022 | ||||||||||||
| Kansas | 2018 | 88.58 | 1.04 | 54.58 | 5.17 | 64.3 | 0.3 | 71.20 | 1.40 | 36022 | ||||||||
| Kansas | 2019 | 84.06 | 2.61 | 54.01 | 5.13 | 60.7 | 0.3 | 56.30 | 55 | 1.50 | 1 | 71.30 | 70 | 1.70 | 3 | 36022 | ||
| Kansas | 2020 | 84.73 | 2.63 | 53.33 | 5.30 | 67.5 | 0.3 | 59.10 | 1.80 | 70.90 | 2.30 | 36022 | ||||||
| Kansas | 2021 | 53.50 | 5.12 | 66.5 | 65.0 | 0.3 | 0.5 | 56.90 | 1.50 | 1 | 70.60 | 70 | 2.50 | 3 | 36022 | |||
| Kansas | 2022 | 84.03 | 0.45 | 53.07 | 5.19 | 66.3 | 0.4 | 54.80 | 1.80 | 70.00 | 2.60 | 36022 | ||||||
| Kansas | 2023 | 52.88 | 5.24 | 60.0 | 0.4 | 61 | 1 | 72 | 3 | 36022 | ||||||||
| Kansas | 2024 | 52.46 | 5.26 | 36022 | ||||||||||||||
| Kansas | 2025 | 61.0 | 0.4 | 61 | 1 | 72 | 3 | 36022 | ||||||||||
| Kentucky | 2017 | 85.89 | 1.46 | 34.80 | 3.80 | 36024 | ||||||||||||
| Kentucky | 2018 | 86.07 | 1.29 | 36.46 | 7.07 | 68.4 | 0.8 | 33.70 | 3.80 | 36024 | ||||||||
| Kentucky | 2019 | 76.04 | 3.46 | 34.10 | 7.24 | 68.1 | 1.1 | 48.90 | 35 | 1.40 | 6 | 29.70 | 35 | 3.70 | 3 | 36024 | ||
| Kentucky | 2020 | 75.58 | 3.21 | 29.89 | 7.16 | 72.0 | 0.7 | 53.30 | 0.90 | 29.70 | 3.80 | 36024 | ||||||
| Kentucky | 2021 | 28.38 | 6.87 | 66.2 | 50.0 | 0.9 | 4.0 | 58.60 | 1.30 | 6 | 28.60 | 27 | 3.80 | 3 | 36024 | |||
| Kentucky | 2022 | 81.09 | 1.10 | 27.03 | 6.99 | 67.4 | 1.3 | 60.60 | 1.20 | 27.30 | 3.70 | 36024 | ||||||
| Kentucky | 2023 | 25.93 | 6.98 | 55.0 | 4.0 | 35 | 6 | 31 | 3 | 36024 | ||||||||
| Kentucky | 2024 | 26.57 | 7.37 | 36024 | ||||||||||||||
| Kentucky | 2025 | 60.0 | 3.0 | 40 | 5 | 27 | 3 | 36024 | ||||||||||
| Louisiana | 2017 | 56.92 | 6.95 | 44.80 | 6.70 | 36026 | ||||||||||||
| Louisiana | 2018 | 56.97 | 7.70 | 50.27 | 13.01 | 19.6 | 2.9 | 41.10 | 7.60 | 36026 | ||||||||
| Louisiana | 2019 | 47.21 | 15.17 | 48.46 | 13.20 | 22.4 | 2.9 | 16.90 | 16 | 12.60 | 10 | 40.30 | 35 | 6.80 | 9 | 36026 | ||
| Louisiana | 2020 | 45.77 | 15.68 | 48.07 | 12.71 | 22.2 | 2.8 | 16.30 | 12.70 | 38.50 | 6.70 | 36026 | ||||||
| Louisiana | 2021 | 46.40 | 12.76 | 17.1 | 10.0 | 3.3 | 4.0 | 12 | 37.50 | 30 | 5.50 | 9 | 36026 | |||||
| Louisiana | 2022 | 42.94 | 5.15 | 43.18 | 12.34 | 21.8 | 3.2 | 15.50 | 12.60 | 36.60 | 3.50 | 36026 | ||||||
| Louisiana | 2023 | 40.35 | 12.15 | 16.9 | 2.1 | 9 | 14 | 34 | 4 | 36026 | ||||||||
| Louisiana | 2024 | 38.74 | 11.48 | 36026 | ||||||||||||||
| Louisiana | 2025 | 13.5 | 2.4 | 5 | 15 | 34 | 4 | 36026 | ||||||||||
| Maine | 2017 | 68.74 | 7.37 | 29.40 | 5.40 | 36028 | ||||||||||||
| Maine | 2018 | 69.23 | 8.43 | 31.78 | 13.14 | 9.4 | 0.6 | 28.50 | 3.50 | 36028 | ||||||||
| Maine | 2019 | 66.82 | 10.13 | 30.39 | 12.76 | 26.1 | 0.9 | 38.20 | 32 | 7.10 | 5 | 27.20 | 32 | 4.10 | 4 | 36028 | ||
| Maine | 2020 | 72.75 | 7.23 | 29.37 | 12.74 | 20.1 | 0.9 | 42.80 | 5.40 | 26.20 | 6.50 | 36028 | ||||||
| Maine | 2021 | 29.30 | 12.64 | 31.1 | 40.0 | 0.2 | 1.5 | 42.90 | 5.20 | 5 | 25.30 | 30 | 7.10 | 4 | 36028 | |||
| Maine | 2022 | 78.92 | 0.00 | 27.07 | 14.17 | 20.5 | 0.1 | 42.60 | 4.90 | 24.80 | 6.70 | 36028 | ||||||
| Maine | 2023 | 25.59 | 14.76 | 28.0 | 1.5 | 40 | 6 | 26 | 7 | 36028 | ||||||||
| Maine | 2024 | 24.86 | 15.41 | 36028 | ||||||||||||||
| Maine | 2025 | 32.0 | 1.5 | 40 | 7 | 27 | 5 | 36028 | ||||||||||
| Maryland | 2017 | 85.74 | 2.12 | 27.40 | 2.30 | 36030 | ||||||||||||
| Maryland | 2018 | 85.36 | 2.31 | 32.80 | 5.11 | 55.3 | 0.4 | 27.40 | 2.60 | 36030 | ||||||||
| Maryland | 2019 | 62.12 | 15.89 | 33.01 | 5.05 | 54.7 | 0.7 | 32.20 | 35 | 6.80 | 7 | 23.60 | 29 | 2.70 | 2 | 36030 | ||
| Maryland | 2020 | 61.73 | 16.20 | 32.65 | 5.03 | 49.1 | 0.6 | 28.00 | 7.00 | 24.10 | 2.50 | 36030 | ||||||
| Maryland | 2021 | 32.85 | 4.65 | 55.4 | 50.0 | 0.6 | 2.0 | 30.40 | 6.20 | 8 | 24.70 | 28 | 2.50 | 2 | 36030 | |||
| Maryland | 2022 | 61.36 | 2.31 | 32.62 | 4.60 | 50.1 | 0.5 | 27.90 | 7.20 | 25.00 | 2.10 | 36030 | ||||||
| Maryland | 2023 | 32.49 | 4.60 | 48.0 | 1.0 | 29 | 8 | 24 | 2 | 36030 | ||||||||
| Maryland | 2024 | 32.29 | 4.56 | 36030 | ||||||||||||||
| Maryland | 2025 | 45.0 | 1.0 | 28 | 9 | 24 | 2 | 36030 | ||||||||||
| Massachusetts | 2017 | 60.32 | 7.89 | 15.10 | 13.10 | 36032 | ||||||||||||
| Massachusetts | 2018 | 62.22 | 7.07 | 26.27 | 9.22 | 70.1 | 0.3 | 15.60 | 12.90 | 36032 | ||||||||
| Massachusetts | 2019 | 39.59 | 27.91 | 26.20 | 8.96 | 75.6 | 0.1 | 34.10 | 30 | 15.60 | 30 | 15.60 | 15 | 13.50 | 13 | 36032 | ||
| Massachusetts | 2020 | 40.71 | 27.49 | 25.44 | 9.03 | 72.3 | 0.0 | 35.40 | 15.50 | 15.50 | 12.70 | 36032 | ||||||
| Massachusetts | 2021 | 25.19 | 8.69 | 71.8 | 70.0 | 0.0 | 4.0 | 16.00 | 30 | 16.00 | 16 | 12.20 | 12 | 36032 | ||||
| Massachusetts | 2022 | 42.32 | 1.21 | 25.32 | 8.45 | 69.3 | 0.0 | 31.20 | 2.50 | 16.50 | 11.60 | 36032 | ||||||
| Massachusetts | 2023 | 25.36 | 8.52 | 70.0 | 2.0 | 30 | 5 | 16 | 12 | 36032 | ||||||||
| Massachusetts | 2024 | 25.15 | 8.87 | 36032 | ||||||||||||||
| Massachusetts | 2025 | 70.0 | 2.0 | 30 | 5 | 16 | 12 | 36032 | ||||||||||
| Michigan | 2017 | 80.45 | 2.33 | 32.70 | 9.80 | 36034 | ||||||||||||
| Michigan | 2018 | 78.72 | 2.43 | 39.89 | 10.65 | 57.8 | 4.9 | 30.90 | 6.30 | 36034 | ||||||||
| Michigan | 2019 | 56.62 | 14.56 | 38.28 | 10.82 | 63.6 | 4.6 | 46 | 21 | 26.50 | 27 | 6.20 | 7 | 36034 | ||||
| Michigan | 2020 | 56.92 | 14.19 | 37.20 | 10.82 | 0.0 | 0.0 | 25.00 | 25.00 | 6.80 | 36034 | |||||||
| Michigan | 2021 | 36.25 | 10.99 | 47.8 | 10.0 | 24 | 22.10 | 23 | 7.00 | 8 | 36034 | |||||||
| Michigan | 2022 | 62.73 | 1.81 | 34.92 | 11.22 | 0.0 | 0.0 | 41.50 | 8.80 | 23.80 | 7.40 | 36034 | ||||||
| Michigan | 2023 | 34.22 | 11.39 | 59.2 | 5.0 | 33 | 10 | 15 | 6 | 36034 | ||||||||
| Michigan | 2024 | 33.73 | 11.27 | 36034 | ||||||||||||||
| Michigan | 2025 | 56.7 | 5.0 | 33 | 10 | 12 | 5 | 36034 | ||||||||||
| Minnesota | 2017 | 70.51 | 4.44 | 48.00 | 1.90 | 36036 | ||||||||||||
| Minnesota | 2018 | 71.17 | 3.97 | 61.83 | 5.00 | 66.1 | 0.4 | 41.80 | 1.00 | 36036 | ||||||||
| Minnesota | 2019 | 69.96 | 4.82 | 60.58 | 4.73 | 63.5 | 0.9 | 59.10 | 50 | 1.10 | 4 | 37.30 | 50 | 3.20 | 4 | 36036 | ||
| Minnesota | 2020 | 74.51 | 2.99 | 58.97 | 4.91 | 68.5 | 0.5 | 64.00 | 0.40 | 34.00 | 3.00 | 36036 | ||||||
| Minnesota | 2021 | 58.22 | 4.58 | 70.9 | 55.0 | 0.6 | 2.0 | 61.40 | 0.50 | 4 | 31.80 | 35 | 5.80 | 4 | 36036 | |||
| Minnesota | 2022 | 77.84 | 0.27 | 57.84 | 4.46 | 71.0 | 0.3 | 58.00 | 0.60 | 29.90 | 6.00 | 36036 | ||||||
| Minnesota | 2023 | 57.37 | 4.31 | 60.0 | 2.0 | 55 | 2 | 30 | 5 | 36036 | ||||||||
| Minnesota | 2024 | 56.66 | 4.44 | 36036 | ||||||||||||||
| Minnesota | 2025 | 60.0 | 2.0 | 55 | 2 | 35 | 5 | 36036 | ||||||||||
| Mississippi | 2017 | 72.53 | 4.12 | 61.70 | 2.10 | 36038 | ||||||||||||
| Mississippi | 2018 | 72.05 | 3.93 | 62.74 | 9.39 | 66.8 | 0.5 | 58.40 | 2.00 | 36038 | ||||||||
| Mississippi | 2019 | 67.40 | 7.66 | 62.77 | 8.72 | 70.0 | 0.6 | 35.40 | 25 | 3.70 | 10 | 57.90 | 60 | 2.10 | 5 | 36038 | ||
| Mississippi | 2020 | 66.53 | 7.44 | 59.83 | 8.21 | 72.5 | 0.6 | 37.70 | 4.20 | 57.50 | 2.30 | 36038 | ||||||
| Mississippi | 2021 | 59.10 | 6.99 | 71.2 | 55.0 | 0.7 | 5.0 | 37.70 | 4.20 | 10 | 55.80 | 60 | 2.80 | 5 | 36038 | |||
| Mississippi | 2022 | 64.22 | 1.21 | 57.56 | 6.54 | 57.1 | 0.6 | 24.60 | 6.60 | 55.00 | 1.50 | 36038 | ||||||
| Mississippi | 2023 | 56.09 | 6.28 | 55.0 | 5.0 | 25 | 10 | 50 | 5 | 36038 | ||||||||
| Mississippi | 2024 | 55.13 | 6.03 | 36038 | ||||||||||||||
| Mississippi | 2025 | 55.0 | 5.0 | 25 | 10 | 50 | 5 | 36038 | ||||||||||
| Missouri | 2017 | 84.57 | 1.23 | 34.00 | 7.10 | 36040 | ||||||||||||
| Missouri | 2018 | 85.10 | 1.15 | 43.16 | 8.63 | 79.1 | 0.0 | 30.80 | 8.20 | 36040 | ||||||||
| Missouri | 2019 | 78.11 | 4.29 | 41.76 | 8.77 | 75.0 | 0.1 | 61.60 | 61 | 0.80 | 1 | 29.80 | 30 | 7.50 | 7 | 36040 | ||
| Missouri | 2020 | 77.76 | 4.19 | 40.15 | 8.92 | 84.2 | 0.0 | 63.30 | 0.80 | 28.40 | 7.30 | 36040 | ||||||
| Missouri | 2021 | 39.26 | 9.02 | 79.9 | 77.5 | 0.0 | 0.1 | 61.30 | 0.90 | 1 | 27.20 | 26 | 7.10 | 8 | 36040 | |||
| Missouri | 2022 | 76.44 | 0.80 | 38.48 | 9.08 | 70.1 | 0.0 | 55.40 | 1.90 | 27.90 | 6.50 | 36040 | ||||||
| Missouri | 2023 | 38.08 | 8.99 | 77.5 | 0.1 | 61 | 1 | 22 | 7 | 36040 | ||||||||
| Missouri | 2024 | 37.63 | 8.95 | 36040 | ||||||||||||||
| Missouri | 2025 | 77.5 | 0.1 | 61 | 1 | 19 | 7 | 36040 | ||||||||||
| Montana | 2017 | 76.41 | 3.15 | 17.40 | 7.30 | 36042 | ||||||||||||
| Montana | 2018 | 75.61 | 3.21 | 30.48 | 7.41 | 58.1 | 0.2 | 19.20 | 6.90 | 36042 | ||||||||
| Montana | 2019 | 74.08 | 4.09 | 30.35 | 7.20 | 58.2 | 0.3 | 44.70 | 44 | 1.30 | 6 | 19.30 | 12 | 6.20 | 9 | 36042 | ||
| Montana | 2020 | 73.07 | 4.30 | 30.58 | 7.15 | 51.7 | 0.3 | 41.00 | 1.50 | 20.70 | 5.80 | 36042 | ||||||
| Montana | 2021 | 30.38 | 6.93 | 56.2 | 54.0 | 0.3 | 3.0 | 41.90 | 1.40 | 6 | 21.20 | 12 | 4.70 | 9 | 36042 | |||
| Montana | 2022 | 75.22 | 0.29 | 30.77 | 6.95 | 40.3 | 0.5 | 36.30 | 2.10 | 19.80 | 4.20 | 36042 | ||||||
| Montana | 2023 | 30.74 | 6.86 | 50.0 | 2.0 | 40 | 3 | 16 | 9 | 36042 | ||||||||
| Montana | 2024 | 31.51 | 6.81 | 36042 | ||||||||||||||
| Montana | 2025 | 50.0 | 2.0 | 40 | 3 | 16 | 9 | 36042 | ||||||||||
| Nebraska | 2017 | 75.55 | 4.31 | 61.00 | 1.90 | 36044 | ||||||||||||
| Nebraska | 2018 | 76.68 | 3.63 | 52.02 | 8.85 | 76.2 | 0.2 | 58.30 | 1.80 | 36044 | ||||||||
| Nebraska | 2019 | 69.81 | 8.47 | 52.15 | 8.84 | 80.3 | 0.1 | 58.10 | 40 | 2.10 | 10 | 56.50 | 55 | 1.90 | 10 | 36044 | ||
| Nebraska | 2020 | 70.60 | 8.36 | 52.37 | 8.48 | 81.1 | 0.0 | 56.50 | 2.20 | 56.60 | 1.90 | 36044 | ||||||
| Nebraska | 2021 | 51.90 | 8.34 | 77.5 | 50.0 | 0.1 | 5.0 | 56.00 | 2.30 | 10 | 57.70 | 55 | 2.00 | 10 | 36044 | |||
| Nebraska | 2022 | 67.48 | 0.28 | 51.85 | 7.96 | 72.4 | 0.1 | 54.80 | 1.50 | 58.20 | 2.10 | 36044 | ||||||
| Nebraska | 2023 | 52.08 | 7.90 | 65.0 | 5.0 | 40 | 10 | 55 | 10 | 36044 | ||||||||
| Nebraska | 2024 | 52.92 | 7.90 | 36044 | ||||||||||||||
| Nebraska | 2025 | 65.0 | 5.0 | 40 | 10 | 55 | 10 | 36044 | ||||||||||
| Nevada | 2017 | 93.43 | 0.60 | 42.20 | 0.50 | 36046 | ||||||||||||
| Nevada | 2018 | 93.03 | 0.50 | 49.42 | 1.36 | 78.6 | 0.3 | 44.10 | 0.90 | 36046 | ||||||||
| Nevada | 2019 | 84.63 | 2.28 | 49.73 | 1.28 | 81.8 | 0.3 | 77.60 | 67 | 4.70 | 5 | 42.90 | 35 | 0.90 | 7 | 36046 | ||
| Nevada | 2020 | 83.65 | 2.63 | 49.37 | 1.36 | 81.4 | 0.2 | 76.40 | 3.50 | 44.90 | 0.90 | 36046 | ||||||
| Nevada | 2021 | 51.77 | 1.40 | 81.2 | 74.7 | 0.3 | 1.4 | 77.60 | 4.10 | 6 | 49.40 | 35 | 1.00 | 7 | 36046 | |||
| Nevada | 2022 | 84.46 | 0.54 | 57.17 | 1.40 | 82.2 | 0.3 | 66.10 | 0.40 | 52.10 | 0.60 | 36046 | ||||||
| Nevada | 2023 | 58.80 | 1.20 | 81.0 | 0.5 | 67 | 0 | 35 | 7 | 36046 | ||||||||
| Nevada | 2024 | 58.27 | 1.14 | 36046 | ||||||||||||||
| Nevada | 2025 | 81.0 | 0.5 | 67 | 0 | 35 | 7 | 36046 | ||||||||||
| New Hampshire | 2017 | 84.50 | 2.84 | 57.00 | 7.00 | 36048 | ||||||||||||
| New Hampshire | 2018 | 83.36 | 3.02 | 53.05 | 8.98 | 52.6 | 0.0 | 60.90 | 4.60 | 36048 | ||||||||
| New Hampshire | 2019 | 76.93 | 6.65 | 52.88 | 8.51 | 64.7 | 0.2 | 72.80 | 65 | 8.30 | 12 | 60.50 | 57 | 4.50 | 7 | 36048 | ||
| New Hampshire | 2020 | 79.16 | 5.69 | 52.82 | 8.55 | 60.0 | 0.3 | 75.10 | 7.10 | 59.70 | 4.50 | 36048 | ||||||
| New Hampshire | 2021 | 53.19 | 7.68 | 62.4 | 65.0 | 0.0 | 0.5 | 45.30 | 1.80 | 12 | 58.40 | 57 | 4.30 | 7 | 36048 | |||
| New Hampshire | 2022 | 81.31 | 0.00 | 52.90 | 7.51 | 60.2 | 0.0 | 45.00 | 2.40 | 56.80 | 4.40 | 36048 | ||||||
| New Hampshire | 2023 | 52.11 | 7.61 | 57.0 | 0.5 | 35 | 7 | 57 | 5 | 36048 | ||||||||
| New Hampshire | 2024 | 51.61 | 7.51 | 36048 | ||||||||||||||
| New Hampshire | 2025 | 57.0 | 0.5 | 35 | 7 | 57 | 5 | 36048 | ||||||||||
| New Jersey | 2017 | 59.58 | 9.58 | 21.70 | 6.50 | 36050 | ||||||||||||
| New Jersey | 2018 | 61.67 | 9.58 | 26.96 | 8.06 | 58.9 | 1.9 | 21.40 | 7.00 | 36050 | ||||||||
| New Jersey | 2019 | 42.65 | 29.14 | 26.89 | 7.80 | 62.1 | 1.8 | 33.00 | 25 | 10.70 | 2 | 22.10 | 19 | 6.80 | 6 | 36050 | ||
| New Jersey | 2020 | 44.98 | 25.27 | 26.76 | 7.38 | 62.6 | 1.1 | 34.90 | 7.20 | 20.90 | 6.40 | 36050 | ||||||
| New Jersey | 2021 | 26.61 | 7.09 | 75.7 | 50.0 | 0.1 | 2.5 | 41.60 | 4.80 | 15 | 21.30 | 21 | 6.60 | 6 | 36050 | |||
| New Jersey | 2022 | 50.34 | 1.68 | 26.32 | 6.69 | 70.1 | 0.2 | 40.70 | 4.50 | 20.90 | 6.20 | 36050 | ||||||
| New Jersey | 2023 | 25.89 | 6.48 | 75.7 | 0.1 | 41 | 4 | 21 | 6 | 36050 | ||||||||
| New Jersey | 2024 | 25.36 | 6.01 | 36050 | ||||||||||||||
| New Jersey | 2025 | 77.0 | 0.1 | 43 | 4 | 23 | 6 | 36050 | ||||||||||
| New Mexico | 2017 | 78.62 | 2.73 | 37.40 | 3.30 | 36052 | ||||||||||||
| New Mexico | 2018 | 78.87 | 2.89 | 37.88 | 5.79 | 70.8 | 0.3 | 38.00 | 3.10 | 36052 | ||||||||
| New Mexico | 2019 | 74.26 | 4.83 | 37.79 | 5.48 | 55.0 | 0.9 | 35.80 | 35 | 2.50 | 9 | 37.60 | 36 | 3.10 | 3 | 36052 | ||
| New Mexico | 2020 | 72.41 | 5.40 | 37.30 | 5.14 | 56.4 | 1.2 | 38.90 | 2.50 | 36.80 | 2.90 | 36052 | ||||||
| New Mexico | 2021 | 36.42 | 5.17 | 54.0 | 55.0 | 1.7 | 5.0 | 36.70 | 2.60 | 12 | 36.20 | 30 | 2.40 | 3 | 36052 | |||
| New Mexico | 2022 | 71.00 | 2.24 | 35.73 | 4.93 | 61.1 | 1.3 | 40.10 | 3.00 | 35.00 | 2.70 | 36052 | ||||||
| New Mexico | 2023 | 35.17 | 4.98 | 42.7 | 3.2 | 40 | 3 | 30 | 4 | 36052 | ||||||||
| New Mexico | 2024 | 35.04 | 4.51 | 36052 | ||||||||||||||
| New Mexico | 2025 | 37.0 | 3.8 | 38 | 3 | 23 | 5 | 36052 | ||||||||||
| New York | 2017 | 68.26 | 4.73 | 22.80 | 10.60 | 36054 | ||||||||||||
| New York | 2018 | 66.81 | 5.29 | 36.53 | 10.03 | 53.0 | 1.2 | 24.40 | 10.20 | 36054 | ||||||||
| New York | 2019 | 47.07 | 20.10 | 36.19 | 9.95 | 51.1 | 1.1 | 13.40 | 14 | 7.50 | 12 | 26.00 | 23 | 9.60 | 11 | 36054 | ||
| New York | 2020 | 47.65 | 20.06 | 36.29 | 9.70 | 45.5 | 0.7 | 18.30 | 7.30 | 25.30 | 10.90 | 36054 | ||||||
| New York | 2021 | 36.20 | 9.52 | 45.3 | 47.3 | 1.1 | 4.0 | 18.90 | 7.60 | 14 | 25.30 | 24 | 11.30 | 11 | 36054 | |||
| New York | 2022 | 46.89 | 2.93 | 36.17 | 9.18 | 36.9 | 1.8 | 16.30 | 7.50 | 24.70 | 11.20 | 36054 | ||||||
| New York | 2023 | 35.82 | 8.98 | 53.2 | 1.4 | 22 | 9 | 24 | 12 | 36054 | ||||||||
| New York | 2024 | 35.41 | 9.43 | 36054 | ||||||||||||||
| New York | 2025 | 54.3 | 1.7 | 20 | 10 | 21 | 12 | 36054 | ||||||||||
| North Carolina | 2017 | 76.65 | 2.40 | 38.20 | 6.60 | 36056 | ||||||||||||
| North Carolina | 2018 | 78.32 | 2.13 | 39.10 | 10.18 | 69.6 | 0.2 | 38.10 | 6.40 | 36056 | ||||||||
| North Carolina | 2019 | 68.33 | 5.16 | 38.50 | 9.31 | 70.3 | 0.1 | 36.60 | 27 | 1.00 | 4 | 41.00 | 33 | 4.20 | 8 | 36056 | ||
| North Carolina | 2020 | 69.35 | 4.57 | 40.75 | 7.79 | 76.1 | 0.2 | 38.60 | 0.80 | 43.90 | 2.90 | 36056 | ||||||
| North Carolina | 2021 | 41.53 | 7.02 | 75.1 | 37.0 | 0.2 | 2.2 | 34.60 | 1.20 | 4 | 45.90 | 30 | 2.80 | 9 | 36056 | |||
| North Carolina | 2022 | 68.32 | 0.82 | 41.39 | 6.92 | 72.3 | 0.1 | 34.80 | 1.50 | 44.80 | 3.00 | 36056 | ||||||
| North Carolina | 2023 | 41.00 | 7.10 | 60.0 | 1.8 | 30 | 3 | 38 | 5 | 36056 | ||||||||
| North Carolina | 2024 | 43.84 | 6.76 | 36056 | ||||||||||||||
| North Carolina | 2025 | 62.0 | 1.5 | 31 | 3 | 36 | 5 | 36056 | ||||||||||
| North Dakota | 2017 | 81.83 | 1.71 | 65.30 | 3.80 | 36058 | ||||||||||||
| North Dakota | 2018 | 81.91 | 1.91 | 53.75 | 10.77 | 83.1 | 0.0 | 67.10 | 2.30 | 36058 | ||||||||
| North Dakota | 2019 | 82.26 | 3.04 | 54.33 | 10.67 | 83.6 | 0.1 | 64.90 | 58 | 0.20 | 3 | 62.90 | 60 | 1.00 | 4 | 36058 | ||
| North Dakota | 2020 | 82.61 | 3.17 | 54.13 | 10.30 | 80.9 | 0.1 | 64.20 | 0.20 | 52.00 | 1.10 | 36058 | ||||||
| North Dakota | 2021 | 47.75 | 11.23 | 82.9 | 75.6 | 0.1 | 3.0 | 63.20 | 0.10 | 3 | 45.50 | 60 | 2.30 | 4 | 36058 | |||
| North Dakota | 2022 | 80.95 | 0.16 | 44.41 | 10.49 | 81.3 | 0.1 | 63.00 | 0.10 | 44.20 | 2.70 | 36058 | ||||||
| North Dakota | 2023 | 44.18 | 10.63 | 75.6 | 3.0 | 58 | 3 | 50 | 10 | 36058 | ||||||||
| North Dakota | 2024 | 42.30 | 10.98 | 36058 | ||||||||||||||
| North Dakota | 2025 | 75.6 | 3.0 | 58 | 3 | 50 | 10 | 36058 | ||||||||||
| Ohio | 2017 | 79.03 | 2.40 | 59.00 | 1.60 | 36060 | ||||||||||||
| Ohio | 2018 | 79.59 | 2.04 | 58.56 | 5.57 | 60.8 | 0.0 | 59.60 | 1.70 | 36060 | ||||||||
| Ohio | 2019 | 65.23 | 10.17 | 59.27 | 5.36 | 73.0 | 0.1 | 46.00 | 35 | 1.70 | 3 | 59.90 | 50 | 1.70 | 5 | 36060 | ||
| Ohio | 2020 | 64.77 | 9.97 | 60.02 | 5.09 | 71.5 | 0.2 | 44.90 | 1.80 | 61.30 | 1.90 | 36060 | ||||||
| Ohio | 2021 | 60.75 | 4.91 | 72.9 | 50.0 | 0.1 | 1.0 | 46.40 | 1.90 | 3 | 60.90 | 50 | 2.00 | 5 | 36060 | |||
| Ohio | 2022 | 66.57 | 1.66 | 60.87 | 4.53 | 73.9 | 0.2 | 0.00 | 0.00 | 62.10 | 2.00 | 36060 | ||||||
| Ohio | 2023 | 61.22 | 4.64 | 55.0 | 1.0 | 40 | 2 | 55 | 3 | 36060 | ||||||||
| Ohio | 2024 | 61.05 | 4.74 | 36060 | ||||||||||||||
| Ohio | 2025 | 55.0 | 1.0 | 40 | 2 | 55 | 3 | 36060 | ||||||||||
| Oklahoma | 2017 | 66.91 | 5.54 | 47.20 | 3.20 | 36062 | ||||||||||||
| Oklahoma | 2018 | 65.84 | 5.94 | 44.58 | 10.99 | 58.2 | 1.1 | 47.50 | 2.40 | 36062 | ||||||||
| Oklahoma | 2019 | 61.43 | 7.50 | 43.97 | 10.17 | 61.1 | 1.0 | 38.40 | 45 | 3.60 | 5 | 46.60 | 55 | 1.60 | 5 | 36062 | ||
| Oklahoma | 2020 | 64.70 | 6.98 | 42.83 | 10.05 | 65.6 | 1.0 | 40.50 | 3.50 | 46.30 | 1.30 | 36062 | ||||||
| Oklahoma | 2021 | 42.63 | 9.89 | 68.7 | 50.0 | 1.1 | 3.0 | 43.40 | 2.70 | 7 | 48.20 | 45 | 0.80 | 5 | 36062 | |||
| Oklahoma | 2022 | 64.29 | 1.40 | 42.35 | 9.51 | 72.3 | 0.6 | 48.60 | 1.40 | 46.40 | 0.60 | 36062 | ||||||
| Oklahoma | 2023 | 42.53 | 7.94 | 59.0 | 3.0 | 41 | 5 | 43 | 3 | 36062 | ||||||||
| Oklahoma | 2024 | 41.98 | 7.70 | 36062 | ||||||||||||||
| Oklahoma | 2025 | 56.0 | 4.0 | 40 | 6 | 40 | 5 | 36062 | ||||||||||
| Oregon | 2017 | 73.98 | 2.19 | 12.40 | 1.90 | 36064 | ||||||||||||
| Oregon | 2018 | 77.09 | 1.90 | 35.30 | 5.17 | 57.3 | 0.3 | 13.40 | 1.80 | 36064 | ||||||||
| Oregon | 2019 | 70.08 | 5.25 | 34.71 | 5.19 | 64.4 | 0.2 | 65.90 | 50 | 6.60 | 10 | 13.20 | 11 | 1.90 | 2 | 36064 | ||
| Oregon | 2020 | 69.36 | 5.71 | 34.30 | 4.81 | 57.7 | 0.1 | 64.70 | 7.20 | 12.80 | 1.40 | 36064 | ||||||
| Oregon | 2021 | 34.00 | 4.64 | 57.8 | 35.0 | 0.1 | 0.5 | 33.40 | 2.90 | 10 | 12.40 | 10 | 1.10 | 3 | 36064 | |||
| Oregon | 2022 | 71.08 | 0.47 | 33.94 | 4.80 | 39.5 | 1.7 | 28.60 | 5.70 | 12.70 | 2.00 | 36064 | ||||||
| Oregon | 2023 | 34.02 | 4.84 | 30.0 | 2.5 | 20 | 10 | 11 | 1 | 36064 | ||||||||
| Oregon | 2024 | 33.31 | 4.61 | 36064 | ||||||||||||||
| Oregon | 2025 | 30.0 | 2.5 | 20 | 10 | 9 | 3 | 36064 | ||||||||||
| Pennsylvania | 2017 | 72.77 | 4.44 | 23.70 | 5.10 | 36066 | ||||||||||||
| Pennsylvania | 2018 | 73.84 | 4.05 | 30.72 | 16.58 | 67.9 | 0.3 | 26.60 | 5.20 | 36066 | ||||||||
| Pennsylvania | 2019 | 54.40 | 13.86 | 31.99 | 15.28 | 71.5 | 0.4 | 37.60 | 35 | 2.00 | 4 | 27.00 | 25 | 5.10 | 5 | 36066 | ||
| Pennsylvania | 2020 | 54.27 | 13.82 | 32.62 | 14.60 | 71.2 | 0.5 | 36.30 | 1.40 | 27.90 | 4.80 | 36066 | ||||||
| Pennsylvania | 2021 | 33.26 | 13.80 | 68.8 | 60.0 | 0.4 | 2.0 | 37.20 | 1.50 | 5 | 27.50 | 26 | 4.40 | 6 | 36066 | |||
| Pennsylvania | 2022 | 55.57 | 1.98 | 33.61 | 13.41 | 73.7 | 0.4 | 33.90 | 1.30 | 27.80 | 3.70 | 36066 | ||||||
| Pennsylvania | 2023 | 33.88 | 12.99 | 69.0 | 2.0 | 31 | 6 | 28 | 7 | 36066 | ||||||||
| Pennsylvania | 2024 | 33.97 | 12.58 | 36066 | ||||||||||||||
| Pennsylvania | 2025 | 65.0 | 2.0 | 29 | 6 | 28 | 7 | 36066 | ||||||||||
| Rhode Island | 2017 | 30.95 | 25.40 | 13.10 | 24.00 | 36068 | ||||||||||||
| Rhode Island | 2018 | 30.40 | 27.20 | 17.18 | 23.08 | 44.3 | 0.2 | 13.30 | 23.30 | 36068 | ||||||||
| Rhode Island | 2019 | 26.67 | 38.07 | 17.72 | 22.34 | 50.6 | 0.4 | 16.10 | 10 | 19.00 | 20 | 14.80 | 14 | 20.40 | 26 | 36068 | ||
| Rhode Island | 2020 | 30.37 | 35.57 | 18.40 | 19.05 | 59.1 | 0.1 | 20.20 | 15.90 | 17.40 | 19.60 | 36068 | ||||||
| Rhode Island | 2021 | 21.57 | 17.46 | 53.9 | 55.0 | 0.1 | 5.0 | 19.80 | 13.20 | 20 | 16.10 | 16 | 16.40 | 21 | 36068 | |||
| Rhode Island | 2022 | 30.37 | 0.00 | 21.43 | 16.58 | 55.3 | 0.0 | 21.10 | 12.20 | 18.00 | 14.10 | 36068 | ||||||
| Rhode Island | 2023 | 22.63 | 15.35 | 55.0 | 5.0 | 10 | 20 | 20 | 15 | 36068 | ||||||||
| Rhode Island | 2024 | 22.86 | 15.20 | 36068 | ||||||||||||||
| Rhode Island | 2025 | 55.0 | 5.0 | 10 | 20 | 24 | 11 | 36068 | ||||||||||
| South Carolina | 2017 | 63.11 | 4.78 | 41.10 | 4.00 | 36070 | ||||||||||||
| South Carolina | 2018 | 67.09 | 3.98 | 44.94 | 8.46 | 63.1 | 0.6 | 39.70 | 5.00 | 36070 | ||||||||
| South Carolina | 2019 | 60.55 | 7.24 | 43.85 | 8.44 | 63.2 | 1.2 | 27.40 | 14 | 3.90 | 4 | 40.00 | 42 | 4.20 | 4 | 36070 | ||
| South Carolina | 2020 | 64.38 | 5.88 | 43.74 | 7.88 | 74.6 | 0.4 | 31.80 | 3.10 | 39.30 | 3.40 | 36070 | ||||||
| South Carolina | 2021 | 44.09 | 5.31 | 75.8 | 71.0 | 0.2 | 3.0 | 38.80 | 1.60 | 4 | 38.50 | 42 | 4.30 | 6 | 36070 | |||
| South Carolina | 2022 | 66.57 | 0.56 | 43.44 | 5.06 | 78.1 | 0.4 | 41.50 | 1.80 | 33.00 | 4.70 | 36070 | ||||||
| South Carolina | 2023 | 40.63 | 5.56 | 77.0 | 2.5 | 36 | 10 | 35 | 6 | 36070 | ||||||||
| South Carolina | 2024 | 38.88 | 6.17 | 36070 | ||||||||||||||
| South Carolina | 2025 | 78.0 | 2.5 | 38 | 10 | 34 | 6 | 36070 | ||||||||||
| South Dakota | 2017 | 62.26 | 4.60 | 27.20 | 1.30 | 36072 | ||||||||||||
| South Dakota | 2018 | 65.32 | 4.31 | 32.73 | 16.71 | 73.2 | 0.0 | 27.50 | 2.90 | 36072 | ||||||||
| South Dakota | 2019 | 64.32 | 4.59 | 33.33 | 17.02 | 75.8 | 0.0 | 55.30 | 41 | 0.60 | 1 | 26.60 | 22 | 2.50 | 5 | 36072 | ||
| South Dakota | 2020 | 72.46 | 3.52 | 33.10 | 17.65 | 78.7 | 0.0 | 66.00 | 0.10 | 24.10 | 2.70 | 36072 | ||||||
| South Dakota | 2021 | 33.01 | 17.30 | 81.8 | 62.6 | 0.0 | 2.4 | 68.50 | 0.10 | 1 | 23.50 | 20 | 3.30 | 5 | 36072 | |||
| South Dakota | 2022 | 74.96 | 0.16 | 33.07 | 16.89 | 83.8 | 0.0 | 66.60 | 0.10 | 25.80 | 5.30 | 36072 | ||||||
| South Dakota | 2023 | 33.37 | 16.73 | 62.0 | 2.0 | 41 | 2 | 20 | 5 | 36072 | ||||||||
| South Dakota | 2024 | 33.84 | 16.36 | 36072 | ||||||||||||||
| South Dakota | 2025 | 62.0 | 2.0 | 41 | 2 | 20 | 5 | 36072 | ||||||||||
| Tennessee | 2017 | 87.35 | 1.05 | 39.50 | 3.50 | 36074 | ||||||||||||
| Tennessee | 2018 | 84.49 | 1.61 | 45.70 | 4.32 | 72.0 | 0.3 | 36.80 | 3.80 | 36074 | ||||||||
| Tennessee | 2019 | 75.50 | 5.53 | 43.39 | 4.39 | 71.5 | 0.3 | 41.60 | 42 | 4.00 | 4 | 35.10 | 36 | 4.10 | 6 | 36074 | ||
| Tennessee | 2020 | 75.41 | 5.64 | 42.63 | 4.35 | 71.7 | 0.2 | 41.90 | 4.00 | 33.20 | 4.60 | 36074 | ||||||
| Tennessee | 2021 | 42.74 | 4.14 | 70.8 | 60.0 | 0.2 | 1.0 | 40.30 | 4.10 | 5 | 32.50 | 36 | 5.00 | 6 | 36074 | |||
| Tennessee | 2022 | 75.23 | 0.64 | 42.31 | 4.32 | 64.5 | 0.4 | 35.80 | 4.40 | 33.50 | 4.60 | 36074 | ||||||
| Tennessee | 2023 | 42.37 | 4.41 | 58.0 | 1.0 | 36 | 6 | 32 | 6 | 36074 | ||||||||
| Tennessee | 2024 | 42.51 | 4.41 | 36074 | ||||||||||||||
| Tennessee | 2025 | 58.0 | 1.0 | 36 | 6 | 32 | 6 | 36074 | ||||||||||
| Texas | 2017 | 75.89 | 1.79 | 50.70 | 0.90 | 36076 | ||||||||||||
| Texas | 2018 | 74.88 | 1.72 | 51.76 | 1.28 | 65.7 | 0.2 | 50.20 | 0.90 | 36076 | ||||||||
| Texas | 2019 | 61.08 | 9.76 | 51.36 | 1.33 | 66.6 | 0.1 | 55.20 | 52 | 13.50 | 14 | 50.70 | 50 | 1.30 | 0 | 36076 | ||
| Texas | 2020 | 60.18 | 10.06 | 50.72 | 1.50 | 65.8 | 0.1 | 54.50 | 13.70 | 49.80 | 0.90 | 36076 | ||||||
| Texas | 2021 | 50.40 | 1.43 | 64.5 | 66.5 | 0.1 | 0.2 | 51.70 | 1.30 | 14 | 49.20 | 50 | 1.10 | 1 | 36076 | |||
| Texas | 2022 | 63.65 | 0.92 | 50.34 | 1.39 | 65.4 | 0.1 | 51.50 | 1.70 | 49.70 | 1.00 | 36076 | ||||||
| Texas | 2023 | 51.09 | 1.26 | 63.9 | 0.2 | 45 | 1 | 48 | 1 | 36076 | ||||||||
| Texas | 2024 | 51.35 | 1.23 | 36076 | ||||||||||||||
| Texas | 2025 | 63.6 | 0.2 | 46 | 1 | 47 | 1 | 36076 | ||||||||||
| Utah | 2017 | 69.99 | 2.60 | 54.60 | 0.40 | 36078 | ||||||||||||
| Utah | 2018 | 71.86 | 2.09 | 54.20 | 2.16 | 63.9 | 0.4 | 43.30 | 0.40 | 36078 | ||||||||
| Utah | 2019 | 67.08 | 3.48 | 46.33 | 2.15 | 59.4 | 0.4 | 41.20 | 35 | 1.00 | 5 | 37.50 | 40 | 0.40 | 10 | 36078 | ||
| Utah | 2020 | 69.30 | 3.30 | 38.11 | 2.02 | 60.8 | 0.4 | 44.60 | 0.70 | 31.70 | 0.40 | 36078 | ||||||
| Utah | 2021 | 32.89 | 2.06 | 67.8 | 60.0 | 0.2 | 5.0 | 49.30 | 0.90 | 5 | 28.60 | 40 | 0.10 | 10 | 36078 | |||
| Utah | 2022 | 70.33 | 0.57 | 27.86 | 2.08 | 67.3 | 0.2 | 47.00 | 0.90 | 24.60 | 1.10 | 36078 | ||||||
| Utah | 2023 | 24.64 | 2.41 | 50.0 | 5.0 | 30 | 10 | 40 | 10 | 36078 | ||||||||
| Utah | 2024 | 22.18 | 2.91 | 36078 | ||||||||||||||
| Utah | 2025 | 50.0 | 5.0 | 30 | 10 | 40 | 10 | 36078 | ||||||||||
| Vermont | 2017 | 82.89 | 3.21 | 49.80 | 1.80 | 36080 | ||||||||||||
| Vermont | 2018 | 80.93 | 4.28 | 53.02 | 2.38 | 50.3 | 0.3 | 47.40 | 3.70 | 36080 | ||||||||
| Vermont | 2019 | 81.43 | 3.38 | 53.02 | 2.41 | 32.9 | 0.2 | 42.40 | 30 | 4.60 | 9 | 47.80 | 35 | 3.30 | 6 | 36080 | ||
| Vermont | 2020 | 79.27 | 4.62 | 53.56 | 2.33 | 16.9 | 1.4 | 29.20 | 8.20 | 47.30 | 3.40 | 36080 | ||||||
| Vermont | 2021 | 52.68 | 2.40 | 19.8 | 28.0 | 1.0 | 4.9 | 35.80 | 7.50 | 9 | 46.70 | 35 | 3.40 | 6 | 36080 | |||
| Vermont | 2022 | 77.87 | 1.40 | 52.46 | 2.49 | 29.9 | 1.3 | 31.10 | 7.60 | 47.00 | 3.50 | 36080 | ||||||
| Vermont | 2023 | 52.31 | 2.63 | 23.0 | 4.9 | 30 | 9 | 35 | 6 | 36080 | ||||||||
| Vermont | 2024 | 52.10 | 2.90 | 36080 | ||||||||||||||
| Vermont | 2025 | 28.0 | 4.9 | 30 | 9 | 35 | 6 | 36080 | ||||||||||
| Virginia | 2017 | 73.14 | 1.83 | 33.60 | 3.50 | 36082 | ||||||||||||
| Virginia | 2018 | 72.96 | 1.75 | 34.36 | 4.64 | 57.5 | 0.3 | 32.50 | 3.00 | 36082 | ||||||||
| Virginia | 2019 | 60.46 | 7.17 | 33.52 | 4.36 | 57.9 | 0.3 | 36.70 | 25 | 0.90 | 5 | 31.80 | 33 | 2.60 | 3 | 36082 | ||
| Virginia | 2020 | 61.33 | 7.08 | 33.14 | 4.13 | 56.3 | 0.2 | 36.60 | 0.80 | 29.40 | 3.10 | 36082 | ||||||
| Virginia | 2021 | 33.18 | 3.79 | 57.3 | 45.0 | 0.1 | 3.0 | 33.50 | 0.50 | 5 | 29.80 | 30 | 3.00 | 3 | 36082 | |||
| Virginia | 2022 | 59.56 | 0.90 | 33.24 | 3.57 | 58.2 | 0.1 | 36.50 | 0.40 | 29.20 | 2.80 | 36082 | ||||||
| Virginia | 2023 | 33.19 | 3.54 | 45.0 | 3.0 | 25 | 5 | 27 | 3 | 36082 | ||||||||
| Virginia | 2024 | 33.00 | 3.39 | 36082 | ||||||||||||||
| Virginia | 2025 | 45.0 | 3.0 | 25 | 5 | 25 | 3 | 36082 | ||||||||||
| Washington | 2017 | 66.91 | 5.18 | 32.90 | 7.80 | 36084 | ||||||||||||
| Washington | 2018 | 66.95 | 5.18 | 52.15 | 4.61 | 0.0 | 0.0 | 33.50 | 8.30 | 36084 | ||||||||
| Washington | 2019 | 52.03 | 13.89 | 51.89 | 4.63 | 40.4 | 1.7 | 45.70 | 45 | 34.00 | 21 | 34.00 | 30 | 6.30 | 10 | 36084 | ||
| Washington | 2020 | 52.88 | 13.58 | 51.68 | 4.99 | 46.9 | 1.6 | 45.70 | 33.70 | 33.70 | 6.90 | 36084 | ||||||
| Washington | 2021 | 51.82 | 4.80 | 46.0 | 30.0 | 1.9 | 4.0 | 20.30 | 4.20 | 5 | 32.80 | 30 | 8.80 | 10 | 36084 | |||
| Washington | 2022 | 53.37 | 1.28 | 51.16 | 5.04 | 44.3 | 1.2 | 17.60 | 4.40 | 32.00 | 8.50 | 36084 | ||||||
| Washington | 2023 | 50.48 | 5.42 | 30.0 | 4.0 | 45 | 5 | 30 | 10 | 36084 | ||||||||
| Washington | 2024 | 50.11 | 5.45 | 36084 | ||||||||||||||
| Washington | 2025 | 30.0 | 4.0 | 45 | 5 | 30 | 10 | 36084 | ||||||||||
| West Virginia | 2017 | 61.87 | 5.62 | 13.90 | 11.90 | 36086 | ||||||||||||
| West Virginia | 2018 | 60.47 | 6.09 | 27.21 | 19.87 | 78.7 | 0.2 | 13.10 | 15.30 | 36086 | ||||||||
| West Virginia | 2019 | 59.92 | 9.12 | 25.52 | 21.00 | 80.6 | 0.0 | 43.00 | 40 | 2.00 | 5 | 11.60 | 14 | 13.50 | 10 | 36086 | ||
| West Virginia | 2020 | 58.49 | 8.65 | 24.17 | 21.18 | 73.7 | 0.5 | 43.30 | 1.50 | 8.90 | 13.40 | 36086 | ||||||
| West Virginia | 2021 | 23.50 | 20.37 | 73.8 | 75.0 | 0.4 | 4.0 | 46.50 | 0.90 | 5 | 10.10 | 11 | 14.00 | 13 | 36086 | |||
| West Virginia | 2022 | 59.81 | 1.52 | 23.38 | 19.97 | 78.1 | 0.2 | 44.10 | 2.10 | 10.00 | 14.70 | 36086 | ||||||
| West Virginia | 2023 | 23.58 | 19.69 | 74.0 | 4.0 | 46 | 5 | 11 | 14 | 36086 | ||||||||
| West Virginia | 2024 | 25.24 | 18.64 | 36086 | ||||||||||||||
| West Virginia | 2025 | 70.0 | 4.0 | 45 | 5 | 12 | 13 | 36086 | ||||||||||
| Wisconsin | 2017 | 58.49 | 7.28 | 56.20 | 1.80 | 36088 | ||||||||||||
| Wisconsin | 2018 | 62.94 | 6.05 | 51.72 | 7.38 | 59.1 | 1.7 | 53.00 | 1.90 | 36088 | ||||||||
| Wisconsin | 2019 | 46.66 | 14.75 | 51.03 | 7.20 | 67.5 | 0.3 | 36.80 | 20 | 3.10 | 12 | 53.20 | 50 | 1.70 | 3 | 36088 | ||
| Wisconsin | 2020 | 45.70 | 14.72 | 51.39 | 6.86 | 66.5 | 0.4 | 35.30 | 2.60 | 51.70 | 1.40 | 36088 | ||||||
| Wisconsin | 2021 | 50.95 | 6.90 | 65.9 | 45.0 | 0.3 | 5.0 | 36.30 | 4.20 | 12 | 51.30 | 50 | 2.60 | 3 | 36088 | |||
| Wisconsin | 2022 | 52.74 | 0.82 | 51.31 | 6.43 | 71.3 | 0.2 | 39.00 | 4.00 | 50.20 | 2.30 | 36088 | ||||||
| Wisconsin | 2023 | 51.05 | 6.54 | 60.0 | 4.0 | 30 | 10 | 49 | 3 | 36088 | ||||||||
| Wisconsin | 2024 | 51.00 | 6.52 | 36088 | ||||||||||||||
| Wisconsin | 2025 | 60.0 | 4.0 | 30 | 10 | 48 | 3 | 36088 | ||||||||||
| Wyoming | 2017 | 80.17 | 1.40 | 21.90 | 8.00 | 36090 | ||||||||||||
| Wyoming | 2018 | 79.65 | 1.77 | 29.59 | 8.21 | 64.0 | 0.3 | 23.60 | 5.30 | 36090 | ||||||||
| Wyoming | 2019 | 77.46 | 2.71 | 30.28 | 6.90 | 46.5 | 1.4 | 53.90 | 40 | 0.70 | 10 | 19.80 | 10 | 6.20 | 10 | 36090 | ||
| Wyoming | 2020 | 76.53 | 2.50 | 28.54 | 6.98 | 48.9 | 1.5 | 50.20 | 1.10 | 19.70 | 7.20 | 36090 | ||||||
| Wyoming | 2021 | 29.54 | 7.39 | 41.4 | 40.0 | 2.1 | 5.0 | 42.10 | 1.10 | 10 | 21.70 | 10 | 5.20 | 10 | 36090 | |||
| Wyoming | 2022 | 79.43 | 1.00 | 30.98 | 6.57 | 61.5 | 1.0 | 42.20 | 1.10 | 22.90 | 4.30 | 36090 | ||||||
| Wyoming | 2023 | 30.85 | 6.52 | 40.0 | 5.0 | 40 | 10 | 10 | 10 | 36090 | ||||||||
| Wyoming | 2024 | 30.07 | 6.51 | 36090 | ||||||||||||||
| Wyoming | 2025 | 40.0 | 5.0 | 40 | 10 | 10 | 10 | 36090 | ||||||||||
| National | 2017 | 73.50 | 3.62 | 83.4 | 2.1 | 46.80 | 7.70 | |||||||||||
| National | 2018 | 74.26 | 3.54 | 45.99 | 7.64 | 84.0 | 2.1 | 46.00 | 7.60 | |||||||||
| National | 2019 | 62.64 | 10.33 | 45.31 | 7.48 | 79.2 | 3.4 | 57.88 | 12.33 | 45.30 | 7.50 | |||||||
| National | 2020 | 62.98 | 10.38 | 45.02 | 7.28 | 79.7 | 3.3 | 58.21 | 12.40 | 45.00 | 7.30 | |||||||
| National | 2021 | 44.89 | 7.03 | 44.90 | 7.00 | |||||||||||||
| National | 2022 | 64.06 | 9.79 | 44.52 | 6.92 | 80.2 | 3.2 | 59.42 | 11.68 | 44.50 | 6.90 | |||||||
| National | 2023 | 44.26 | 6.82 | 44.30 | 6.80 | |||||||||||||
| National | 2024 | 44.10 | 6.75 | 44.10 | 6.80 | |||||||||||||
| National | 2025 | |||||||||||||||||
| State |
Use the “State” filter above to add any state’s data to this graph.
Click on any item in the legend to show or hide that trend line. To zoom in on an area, click and drag your cursor over that area. To download this chart or to see it in full-screen mode, click the menu icon in the top right.
Note: Data required for compilation of national road conditions in 2021 (FHWA Highway Stats Series Table HM-47) are currently unavailable
Thanks to Eric Dennis of Citizens Research Council of Michigan for their National Highway System Pavement Quality data and analysis used here for ranking.


Help us improve this tool
Sorry. This form is no longer accepting new submissions.

Our three principles
Despite $1.5 trillion of federal investment since 1991, traffic, emissions, and pedestrian deaths keep rising. It’s time to focus on what truly matters: a transportation system that safely and efficiently serves everyday people.