T4America Blog

News, press releases and other updates

Dangerous by Design

Dangerous by Design 600px web tease

What would the national reaction be if a jumbo jet full of passengers went down with regularity every 31 days or so? How loud would the calls be for a fundamental change in airline safety? It’s easy to imagine the shock and outrage if such a thing happened. Yet that is essentially what happens every year with preventable pedestrian fatalities on our nation’s streets and roads.

Every year, nearly 5,000 Americans die preventable deaths on roads that fail to provide safe conditions for pedestrians. This decade alone, more than 43,000 Americans – including 3,906 children under 16 – have been killed while walking or crossing a street in our communities. With more than 76,000 Americans dying in the last 15 years, it’s the equivalent of a jumbo jet going down roughly every month, yet it receives nothing like that kind of attention.

A new report from Transportation for America and the Surface Transportation Policy Partnership, Dangerous by Design: Solving the Epidemic of Preventable Pedestrian Death (and Making Great Neighborhoods), ranks metropolitan areas based on the relative danger of walking.

Download the full report, see the comprehensive rankings and view all of the companion tables of data online right here: https://t4america.org/resources/dangerousbydesign. After you’ve taken a look, ask U.S. Transportation Secretary Ray LaHood to make pedestrian safety a priority for the administration. Pedestrian deaths are preventable, and we demand safer streets!

Many of these preventable deaths are occurring along roadways that are dangerous by design, streets engineered for speeding cars with little or no provision for people on foot, in wheelchairs or on a bicycle.

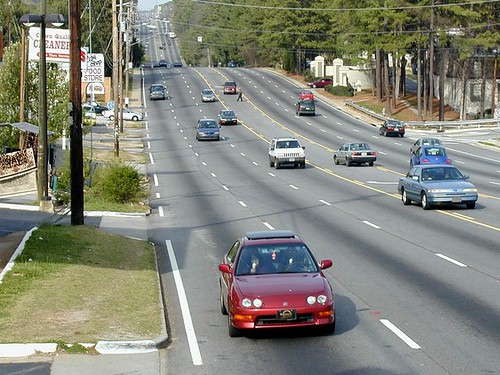
YikesPedestrian Originally uploaded by Transportation for America
Look carefully in the turning lane above the center of the photograph. There’s a pedestrian trying to cross this 7-lane urban arterial road. See any crosswalks anywhere on the road? Photo courtesy of Dan Burden.

Over the last several decades, many of our cities and communities have seen the same shift of daily business from walkable, downtown Main Streets to wide, fast-moving state highways. These “arterial” roads are the new main streets in most communities, drawing shopping centers, drive-throughs, apartment complexes and office parks. Unlike the old walkable main streets, however, the pressure to move as many cars through these areas as quickly as possible has led transportation departments to squeeze in as many lanes as they can, while disregarding sidewalks, crosswalks and crossing signals, on-street parking, and even street trees in order to remove impediments to speeding traffic.

As a result, more than half of fatal vehicle crashes occurred on these wide, high capacity and high-speed thoroughfares. Though dangerous, these arterials are all but unavoidable because they are the trunk lines carrying most local traffic and supporting nearly all the commercial activity essential to daily life.

Before the top 10 most dangerous city rankings, here are just a few facts you might like to know:

Inadequate facilities. Of the 9,168 pedestrian fatalities in 2007-08 for which the location of the collision is known, more than 40 percent were killed where no crosswalk was available.

Spending disparity. Though pedestrian fatalities make up 11.8 percent of all traffic-related fatalities, states have allocated less than 1.5 percent of total authorized transportation funds to projects aimed at improving safety for pedestrians (for funds spent under current transportation bill.) No state spends more than 5 percent of federal transportation funds on safety features or programs for pedestrians or cyclists, despite a 30 percent increase in total federal transportation dollars beginning in 2005.

Complete streets save lives. Providing sidewalks, crosswalks and designing for lower traffic speeds saves lives. Only one in 10 pedestrians deaths occurred within crosswalks, while six in 10 occurred on arterial-type roads where speeds were 40 mph or higher.

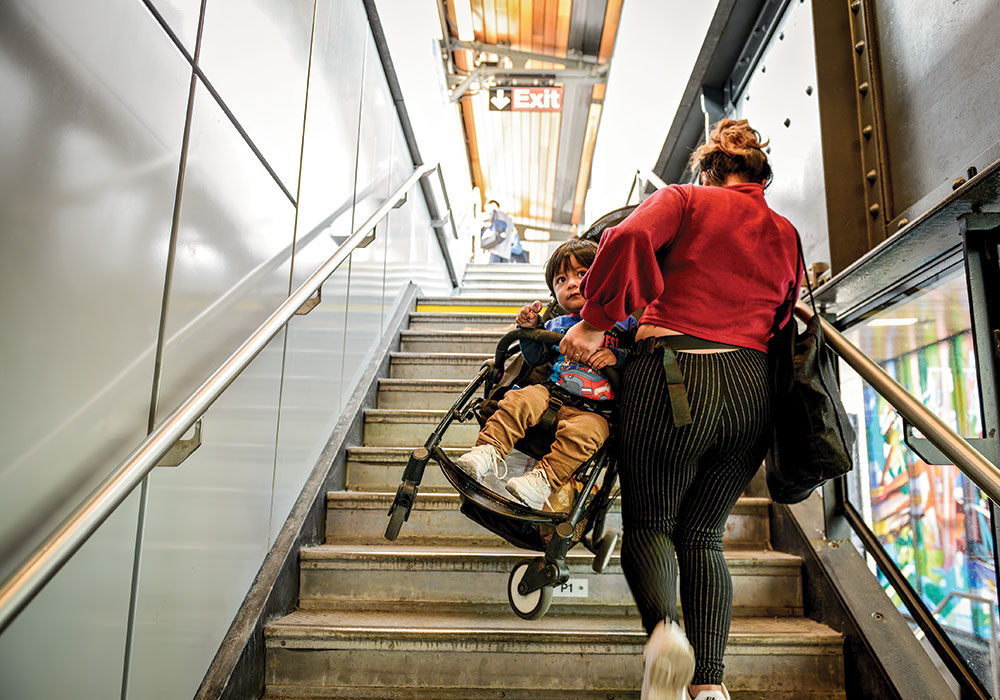
The danger is not shared equally. Older adults, disabled and low-income Americans are being killed at disproportionate rates. African-Americans, who walk for 50 percent more trips than whites, and Hispanic residents, who walk 40 percent more, are subjected to the least safe conditions and die disproportionately.

Aging in place, yet unable to leave the house on foot. An AARP poll of adults 50 years and older found that 40 percent reported inadequate sidewalks in their neighborhoods and nearly half of respondents reported that they could not safely cross the main roads close to their home.

Rank Metropolitan Area 2007-08 Pedestrian

Danger Index

1 Orlando-Kissimmee, Fla. 221.5
2 Tampa-St. Petersburg-Clearwater, Fla. 205.5
3 Miami-Fort Lauderdale-Pompano Beach, Fla. 181.2
4 Jacksonville, Fla. 157.4
5 Memphis, Tenn.-Miss.-Ark. 137.7
6 Raleigh-Cary, N.C. 128.6
7 Louisville/Jefferson County, Ky.-Ind. 114.8
8 Houston-Sugar Land-Baytown, Texas 112.4
8 Birmingham-Hoover, Ala. 110.0
10 Atlanta-Sandy Springs-Marietta, Ga. 108.3
See the full rankings and download the report

10 Comments

  1. Pingback: Streetsblog Los Angeles » Dangerous by Design: L.A. Metro Lags Behind Nation on Funds to Fix Unsafe Streets

  2. Pingback: Report: Too Many US Roads Are Dangerous by Design | Mobilizing the Region

  3. Joe Fish

    14 years ago

    This is a great report! I just wanted to point out that the population for Bloomington, IN is off the mark. If it’s the county population you’re using, it should be 120,563. If you’re using just the City population it should be 69,291 (2000 U.S. Census). The table in Appendix C shows a population of 183,944. Thanks!

  4. Stephen Lee Davis

    14 years ago

    Joe. FYI, for the cities, we’re using the Census Metropolitan Statistical Area (MSA) numbers for population. Which includes Greene and Owen counties in addition to Monroe, as I’m sure you’re aware. We used MSAs because it matches up against the data for % of walking commuters from the census data. You can find out more about the methodology and use of MSA’s on the methodology Q&A. https://t4america.org/resources/dangerousbydesign/methodology/

  5. Pingback: Cuyahoga County Planning Commission Weblog

  6. Pingback: Possibility City? | Fuck Gas

  7. Pingback: Dangerous by Design « WWBPA

  8. Pingback: Dangerous by Design « Muscle Powered – Carson City

  9. Bill Bohn

    14 years ago

    Our town of approximately 1500 population in the metro-Omaha area is considering a round-a-bout to be located on a busy street in front of an elementary school.
    Would this be considered a pedestrian friendly structure?

  10. Andrew Bernish

    14 years ago

    9 of the top 10 states are in the Southeast. Given that the report indicates that the states most in need of improvement are the ones not using federal transportation funding for pedestrian safety (even though no state allocates more than 5%), I assume this is a causal relationship at least to some extent. Interesting and troubling report.