Walk Score expands into Transit Score; housing plus transportation costs
An exciting new service that launched this morning from our friends at Walk Score will help people all across the country find out how transit-accessible a home or a neighborhood is while gaining a better understanding of the true cost of buying a home — the cost of housing plus transportation.
Starting today, when you visit Walk Score you’ll also get information about nearby transit options, commuting details, and the expected cost of housing plus transportation. Some of the new features:
- A Transit Score for the 40+ cities that provide open transit data. See the list of cities here
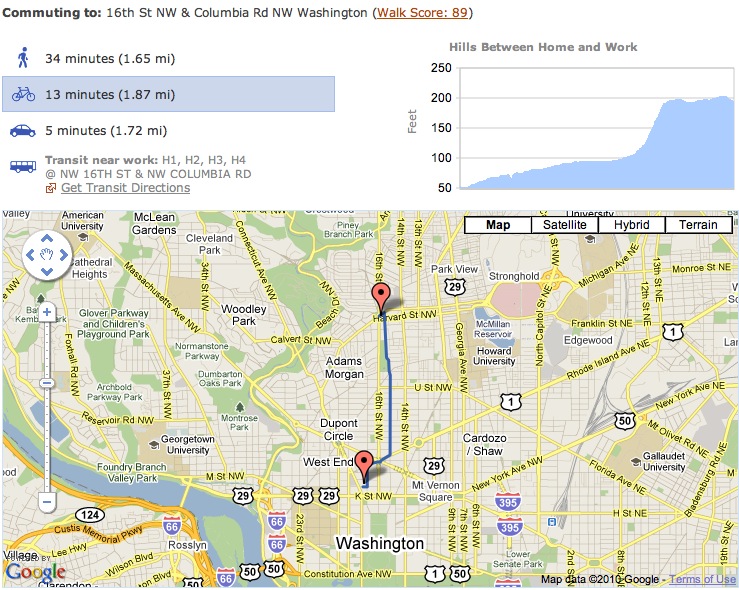
- By entering a work and home address, you can get custom commute reports for all cities showing hills on your route for biking or walking, nearby transit lines, and travel times and directions based on mode. Select walking, biking, transit or driving and see the route update dynamically. (See example below)
- They’ve also joined with the Center for Neighborhood Technology to allow users to calculate their expected transportation costs to give a fuller picture of the cost of a home.
- They’re partnering with the real estate site ZipRealty to have this provided with all of ZipRealty’s home listings. So anyone looking for a home on their site will get exposed to these ideas on a regular basis.


Together with the Center for Neighborhood Technology, Walk Score and CNT have done more than almost anyone to help raise the visibility of the issue of housing and transportation costs in the minds of consumers and adding transit to the mix is the next obvious step. After all, you may live in a neighborhood with a 75 Walk Score but you’re a five minute walk away from a bus or train that can take you to a neighborhood with a 100 Walk Score in just a few more minutes. Being able to walk to and use a variety of of other transportation options expands your “walkshed” — something that Walk Score doesn’t recognize on its own.
When you search for the Walk Score now, you also get a Transit Score. And if you live in one of the 40 cities with open transit data, you can enter a second address and get a commute report, complete with directions. As an example, here’s a commute from a neighborhood north of downtown D.C and the T4 America office., where some of our staff live and ride their bikes to work. Click on the bike commute, and it shows you the profile of the hills, the time and mileage, and the route on a map:

These commute reports will be available for all cities, though the transit data will be left off for cities without open data.
Now I know what you’re thinking: only 40 cities with transit data? Indeed, Transit Score unfortunately only has access to a limited set of open transit data, because not all agencies have chosen to open up this publicly-owned data as a public resource. But there’s hope. You can petition your local transit agency to release their data publicly to make exciting tools like this and others possible. Visit www.citygoround.org to see a list of the 695 agencies with no open data and find information on how to request your local agency provide that data. (Read our post about the release of CityGoRound.)
Transit Score was supported by the Rockefeller Foundation, and had this to say in the official press release this morning:
“The Rockefeller Foundation’s transportation initiative is committed to helping Americans re-think our transportation future as a way to expand economic opportunity, and we are excited about the potential impact Transit Score will have in helping Americans make more informed decisions about where they will live and work,” said Benjamin de la Pena, Associate Director at The Rockefeller Foundation. “Transportation costs are often the second highest expense for working Americans and Transit Score will give families more control over their household budgets by providing them with information about their transit choices.”
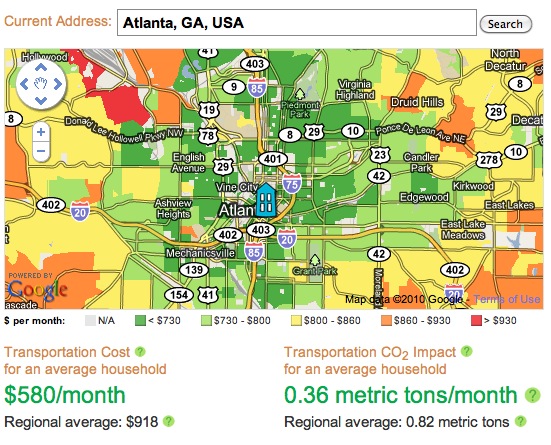
The housing+transportation calculator is cool, but at the risk of going on too long on a Monday morning, if you really want to dive into finding out more about housing and transportation costs today, you need to check out Abogo from the Center for Neighborhood Technology. Type in an address, and it gives you the cost you can expect to pay for transportation at that address and an estimate on emissions. With one glance at the color, you can see where transportation costs are low, and where they are higher, helping to make a more informed decision.
These kinds of tools are certainly important for helping consumers make more informed decisions when purchasing a house, but the greatest value is really what they do to help shatter the myth that the cost of a home is the only major cost of a home. With multiple trips taken each day to all the places we need to go, the locations of our homes have profound impacts on our pocketbooks, wallets and time. We applaud Walk Score, Transit Score and CNT for working hard to make the case that we need more walkable, transit-accessible places in our communities — and that the market is demanding them.


